. 2019 Aug 27;116(35):17480-17491.
doi: 10.1073/pnas.1904637116. Epub 2019 Aug 14.

Toxoplasma gondii effector TgIST blocks type I interferon signaling to promote infection

Affiliations

Toxoplasma gondii effector TgIST blocks type I interferon signaling to promote infection

Sumit K Matta et al. Proc Natl Acad Sci U S A. .

Abstract

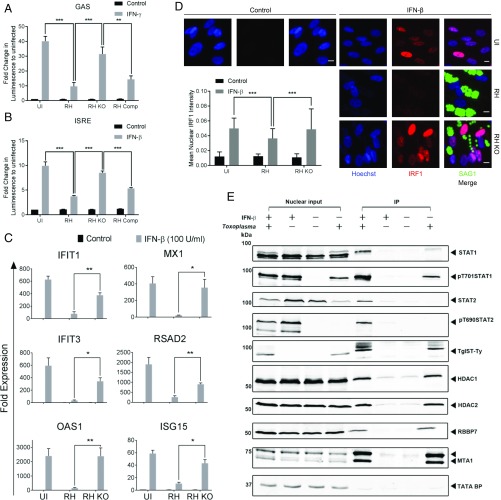
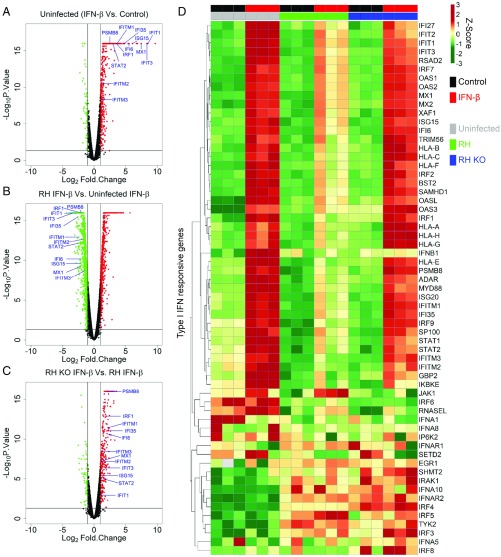
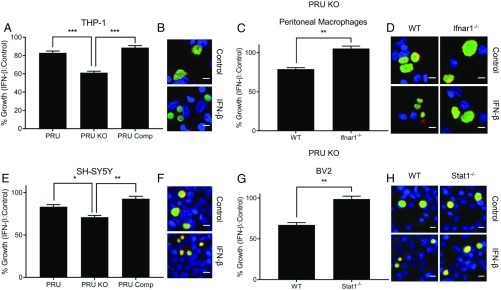
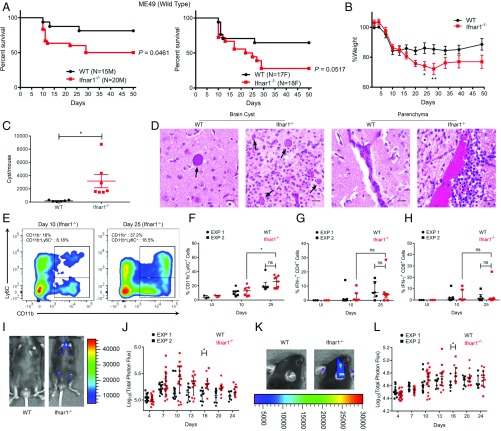
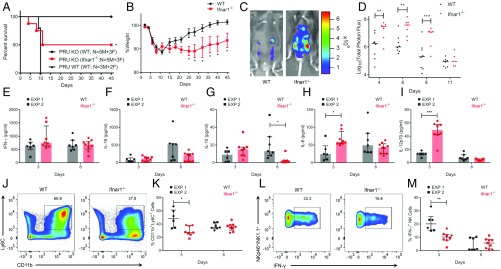
In contrast to the importance of type II interferon-γ (IFN-γ) in control of toxoplasmosis, the role of type I IFN is less clear. We demonstrate here that TgIST, a secreted effector previously implicated in blocking type II IFN-γ signaling, also blocked IFN-β responses by inhibiting STAT1/STAT2-mediated transcription in infected cells. Consistent with a role for type I IFN in cell intrinsic control, ∆Tgist mutants were more susceptible to growth inhibition by murine and human macrophages activated with IFN-β. Additionally, type I IFN was important for production of IFN-γ by natural killer (NK) cells and recruitment of inflammatory monocytes at the site of infection. Mice lacking type I IFN receptors (Ifnar1-/-) showed increased mortality following infection with wild-type parasites and decreased virulence of ∆Tgist parasites was restored in Ifnar1-/- mice. The findings highlight the importance of type I IFN in control of toxoplasmosis and illuminate a parasite mechanism to counteract the effects of both type I and II IFN-mediated host defenses.

Keywords: NK cell; central nervous system; inflammatory monocyte; interferon; transcriptome.


Conflict of interest statement

The authors declare no conflict of interest.

Figures

Fig. 1.
Fig. 1.
TgIST suppresses the type I IFN response. Luminescence is reported in HeLa cells expressing GAS (A) or ISRE (B) Gaussia Luciferase reporter constructs with and without (Control) incubation with IFN-γ (A) or IFN-β (B) at 100 units/mL for 6 h. The cells were left uninfected (UI) and infected with wild-type RH or RH KO (RH strain with knockout of TgIST) for 12 h. Luminescence is expressed as fold change ± SEM, compared with uninfected and control cells from 3 independent experiments done in triplicate. There were significant differences between the compared groups (**P = 0.0002 and ***P < 0.001 using an unpaired Student’s t test). (C) Real-time PCR showing fold induction of mRNA transcripts in HFFs infected with RH or RH KO for 12 h, followed by treatment with IFN-β (100 units/mL for 6 h). Comparative cycle threshold values were used to evaluate the fold change in transcripts using YWHAZ as an internal transcript control. Data are plotted as fold change ± SEM compared with UI and untreated (Control) cells from at least 3 independent experiments per gene. There were significant differences between the compared groups (*P < 0.05 and **P < 0.01 using a multiple Student’s t test with Holm–Sidak correction). (D) Representative images showing nuclear localization of IRF1 in HFFs infected with wild-type RH or RH KO for 6 h, followed by treatment with IFN-β (100 units/mL for 12 h). UI and untreated HFFs were used as controls. The cells were stained using a mAb against IRF1 (red) and Hoechst (100 ng/mL) to label the nuclei (blue), and parasites were detected using mAb DG52 (SAG1) (green), followed by secondary antibodies. (Scale bars, 10 μm.) The bar graph shows the mean of nuclear IRF1 intensity per image (arbitrary units) ± SD of at least 150 images per sample from a representative experiment. There was a significant difference between compared groups (***P < 0.0001 using 2-way ANOVA with Tukey’s multiple comparison test). (E) Western blot analysis of TgIST-Ty immunoprecipitated from nuclear lysates of HFF cells. Cells were either left uninfected or infected with Toxoplasma (RH or RH KO, each expressing Ty-tagged TgIST) for 16 h, followed by treatment with IFN-β (150 units/mL) for 1 h. Control cells were left untreated. Different proteins were probed for their relative enrichment across samples in the immunoprecipitated fraction. Equal amounts of nuclear lysates used for immunoprecipitation are loaded alongside as nuclear input controls. IP, immunoprecipitation.
Fig. 2.
Fig. 2.
Global transcriptomic response to IFN-β in T. gondii infection. Volcano plots between fold change (Log2Fold.Change) of genes vs. significance of change (−Log10P.Value). (A) HFF cells treated with IFN-β (100 units/mL for 6 h) normalized to untreated (Control) cells. (B) HFF cells infected with wild-type RH and treated with IFN-β normalized to uninfected cells treated with IFN-β. (C) HFF cells infected with RH KO (TgIST knockout RH parasites) and treated with IFN-β normalized to cells infected with wild-type RH and treated with IFN-β. HFF cells in B and C were infected with RH or RH KO for 12 h, followed by IFN-β (100 units/mL) treatment for 6 h. Points in red and green represent significantly up-regulated (Log2Fold.Change > 1 and −Log10P.Value > 1.3) and down-regulated (Log2Fold.Change < −1 and −Log10P.Value > 1.3) genes, respectively. Blue text denotes genes responsive to type I IFNs. (D) Heatmap of gene expression across all samples with their 3 independent biological replicates was clustered using Euclidean distance and complete linkage on normalized Log2 (Total gene reads). Normalized Z-scores are color-scaled from green to red showing relative down-regulation to up-regulation. Uninfected, RH-infected, and RH KO-infected HFFs are represented in gray, green, and blue, respectively. Samples with control and IFN-β treatment are represented in black and red, respectively.
Fig. 3.
Fig. 3.
Type I IFN-mediated growth suppression of TgIST-deficient parasites. Comparison of vacuolar growth in control or IFN-β–treated cells of various types infected with type II wild-type parasites (PRU), ∆Tgist knockout (PRU KO), or complemented lines (PRU Comp). Differentiated THP-1 human macrophages (A and B) and SH-SY5Y human neuroblastoma cells (E and F) are shown. ∆Tgist knockout (PRU KO)-infected (C and D), wild-type (WT), Ifnar1−/− thioglycolate-elicited peritoneal macrophages (G and H), mouse microglial WT, and Stat1−/− BV2 cells are shown. Cells were infected for 2 h and then treated with TNF-α (10 ng/mL; Control) alone or in combination with IFN-β (100 units/mL) during 40 h of infection. Growth or mean vacuolar size per image of parasites upon IFN-β treatment relative to control is plotted as % Growth ± SEM of at least 3 independent replicates with at least 50 images per replicate and sample. There were significant differences between the compared samples (*P < 0.05, **P < 0.01, and ***P < 0.001 using 1-way ANOVA in A and E and an unpaired Student’s t test in C and G). Representative images of vacuolar growth of PRU KO parasites in THP-1, peritoneal macrophages, SH-SY5Y, and BV2 cells are shown in B, D, F, and H, respectively. Parasites were stained with mouse mAb anti-SAG1 (green), and the vacuolar membrane was stained with Pc rabbit anti-GRA7 (red) and detected with appropriately conjugated secondary antibodies. Nuclei were stained with Hoechst (100 ng/mL). (Scale bars, 10 μm.)
Fig. 4.
Fig. 4.
Type I IFN controls in vivo expansion of acute and chronic Toxoplasma infection. (A) Kaplan–Meier curve showing survival of wild-type (n = 15 male [M] and 17 female [F]) and Ifnar1−/− (n = 20 M and 18 F) mice infected orally with 5 cysts of the type II ME49 line expressing firefly luciferase (ME49/FLUC) strain. Cumulative data from 3 independent replicates are shown separately for M and F mice. Statistical difference between wild-type and Ifnar1−/− mice was calculated using a log-rank Mantel–Cox test. (B) Percent weight of mice infected compared with average weight of wild-type mice before infection (0 d) is plotted as mean ± SEM from 2 independent experiments (*P < 0.05, using a multiple Student’s t test with Holm–Sidak correction). (C) Cyst burden in surviving mice is plotted as mean ± SEM (*P = 0.0197, Student’s t test). (D) Histopathological fields showing cyst burden and brain parenchyma. Arrows denote tissue cysts. (Scale bars, 20 μm.) (E) Representative fluorescence-activated cell sorting plot showing CD11b+ and CD11b+Ly6C+ cells in Ifnar1−/− mice at 10 d and 25 d postinfection. (F) Percentages of CD11b+Ly6C+ cells after gating on CD45+CD19CD3 (hematopoietic, non-B/T cells) brain mononuclear cells from 2 independent replicates. Each point represents 1 mouse. EXP, experiment; ns, not significant. Percentages of IFN-γ+ CD4+ T cells (G) and IFN-γ+ CD8+ T cells (H) are shown after gating on a parent population of live CD45+CD19CD3+CD4/8+ brain mononuclear cells from uninfected or ME49 infected wild-type and Ifnar1−/− mice at 10 d and 25 d postinfection. Bioluminescent imaging of ME49/FLUC infection in the peritoneum (I) and cranium (K) of wild-type and Ifnar1−/− mice is shown. Representative images show radiance from respective sites at day 16. The scatter plot shows total peritoneal (J) and cranial (L) radiance in each mouse across different time points up to 24 d postinfection. Total photon flux is log-transformed and plotted as median ± interquartile range. There was a significant difference between compared groups (*P < 0.05 using a multiple Student’s t test with Holm–Sidak correction). The number of animals per group is indicated.
Fig. 5.
Fig. 5.
Susceptibility of Ifnar1−/− mice to TgIST knockout type II PRU T. gondii. Analysis of C57BL/6J wild-type (n = 8) and Ifnar1−/− (n = 8) mice infected i.p. with 105 PRU KO or PRU WT (n = 5) tachyzoites per mouse and monitored for 45 d. (A) Kaplan–Meier curve showing survival of both groups of mice. There was a significant difference at between PRU KO-infected wild-type and Ifnar1−/− mice (*P = 0.0256 using a log-rank Mantel–Cox test). (B) Percent weight of mice infected compared with average weight before infection (0 d). (C) Bioluminescence imaging of luciferase-expressing PRU KO tachyzoite infection in the peritoneum of wild-type (WT) and Ifnar1−/− mice. Representative images of the radiance from the peritoneum at day 6 are shown. (D) Scatter plot shows total peritoneal radiance in each mouse across different time points up to 11 d postinfection. Total photon flux is log-transformed, with the dash representing the median. (EI) Serum levels of IFN-γ, IL-18, IL-10, IL-6, and IL-12p70 in wild-type and Ifnar1−/− mice at days 3 and 6 postinfection with PRU KO. EXP, experiment. (J) Representative plot of inflammatory monocytes (CD11b+Ly6C+) in wild-type and Ifnar1−/− mice at day 3 postinfection. (K) Percentages of CD11b+Ly6C+ cells after gating on CD45+CD19 (hematopoietic, non-B cells) peritoneal cells in wild-type and Ifnar1−/− mice at days 3 and 6 postinfection. (L) Representative plot of intracellular IFN-γ in NK cells (NK1.1+NKp46+) at 3 d postinfection. (M) Quantitative percentage of IFN-γ+ NK cells after gating on CD45+CD19CD3 (hematopoietic, non-B/T cells) peritoneal cells in wild-type and Ifnar1−/− mice at days 3 and 6 postinfection. Cumulative data from 2 independent experiments are shown in EI, K, and M. The data in EI, K, and M are plotted as median ± interquartile range. (BG) There were significant differences between compared groups (*P < 0.05, **P < 0.01, and ***P < 0.005) using a multiple Student’s t test with Holm–Sidak correction.

References

    1. Stark G. R., Darnell J. E. Jr, The JAK-STAT pathway at twenty. Immunity 36, 503–514 (2012). - PMC - PubMed
    1. Reich N. C., Liu L., Tracking STAT nuclear traffic. Nat. Rev. Immunol. 6, 602–612 (2006). - PubMed
    1. Mostafavi S., et al. ; Immunological Genome Project Consortium , Parsing the interferon transcriptional network and its disease associations. Cell 164, 564–578 (2016). - PMC - PubMed
    1. Schroder K., Hertzog P. J., Ravasi T., Hume D. A., Interferon-gamma: An overview of signals, mechanisms and functions. J. Leukoc. Biol. 75, 163–189 (2004). - PubMed
    1. Ramana C. V., Chatterjee-Kishore M., Nguyen H., Stark G. R., Complex roles of Stat1 in regulating gene expression. Oncogene 19, 2619–2627 (2000). - PubMed

Publication types

MeSH terms

Substances