. 2019 Aug 14;10(1):3660.
doi: 10.1038/s41467-019-11591-1.

A general approach for detecting expressed mutations in AML cells using single cell RNA-sequencing

Affiliations

A general approach for detecting expressed mutations in AML cells using single cell RNA-sequencing

Allegra A Petti et al. Nat Commun. .

Erratum in

Abstract

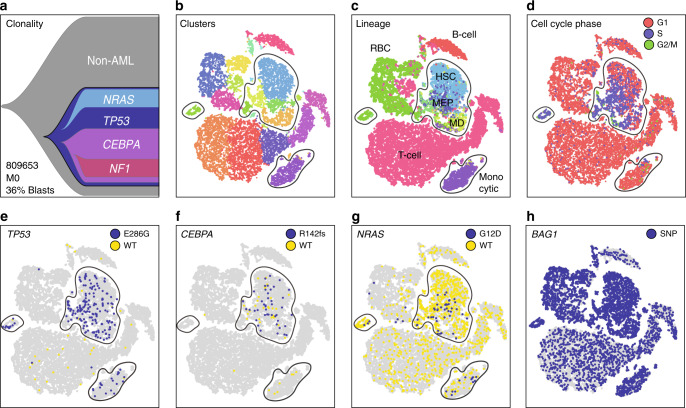
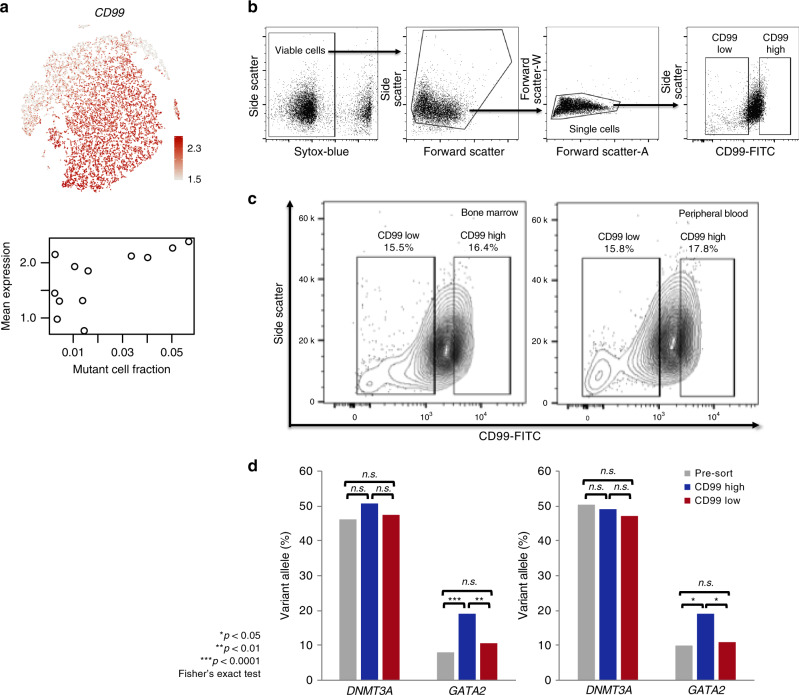
Virtually all tumors are genetically heterogeneous, containing mutationally-defined subclonal cell populations that often have distinct phenotypes. Single-cell RNA-sequencing has revealed that a variety of tumors are also transcriptionally heterogeneous, but the relationship between expression heterogeneity and subclonal architecture is unclear. Here, we address this question in the context of Acute Myeloid Leukemia (AML) by integrating whole genome sequencing with single-cell RNA-sequencing (using the 10x Genomics Chromium Single Cell 5' Gene Expression workflow). Applying this approach to five cryopreserved AML samples, we identify hundreds to thousands of cells containing tumor-specific mutations in each case, and use the results to distinguish AML cells (including normal-karyotype AML cells) from normal cells, identify expression signatures associated with subclonal mutations, and find cell surface markers that could be used to purify subclones for further study. This integrative approach for connecting genotype to phenotype is broadly applicable to any sample that is phenotypically and genetically heterogeneous.


Conflict of interest statement

S.W. and I.F. are employed by and hold shares in 10x Genomics. The remaining authors declare no competing interests.

Figures

Fig. 1
Fig. 1
Workflow, coverage, and performance metrics for variant detection in single cells. a Cryopreserved bone marrow cells from AML patients underwent eWGS, bulk RNA-seq, and scRNA-seq. Somatic mutations were discovered using eWGS data, identified in individual cells using scRNA-seq data, and interpreted in the context of expression heterogeneity. b Fraction of unique transcripts (molecules) whose reads map to any given position up to 10 kbp away from the capture site in both the 5’ and 3’ kits. c Comparison of single-cell and bulk RNA-seq coverage data for specific genes of interest. d Relationship between RNA and eWGS VAF; dependence of Mutant Cell Fraction on eWGS VAF; dependence of Mutant Cell Detection Rate on bulk RNA VAF, and dependence of Mutant Cell Detection Rate on position of the mutation in the cDNA
Fig. 2
Fig. 2
Clustering, overview of expression heterogeneity, and copy number analysis in 809653. a t-SNE projection of scRNA-seq data, with cells colored according to graph-based cluster assignment; putative AML clusters (based on later analyses) circled. b Hierarchical clustering of the most heavily weighted genes in each principal component, averaged within graph-based clusters. Each column represents a cluster from panel a. c CNV analysis: blue, cells with detected CNVs; gray, no detected CNVs
Fig. 3
Fig. 3
Single-cell mutation detection and interpretation in case 809653. a Clonality inferred from eWGS, with subclonal driver genes labeled. b t-SNE projection of scRNA-seq data with cells colored according to graph-based cluster assignment. In panels bg, putative clusters of AML cells are circled. c Cells colored according to inferred lineage; RBC = red blood cell, HSC = hematopoietic stem cell, MEP = myeloid-erythroid progenitor, MD = myeloid dendritic cell. d Cells colored according to cell cycle phase. eg Cells colored according to single-cell genotype at the TP53E286G, CEBPAR142fs, and NRASG12D sites: blue, at least one mutant read detected; yellow, wild-type reads only; gray, no coverage. h Cells colored according to single-cell genotype at the homozygous BAG1 germline SNP: blue, at least one mutant read detected; gray, no coverage
Fig. 4
Fig. 4
Single-cell mutation detection and interpretation in additional cases ordered by the differentiation signature of AML cells. a 721214, top to bottom: clonality inferred from eWGS; cells colored according to closest inferred lineage (RBC = red blood cell, HSC = hematopoietic stem cell, CMP = common myeloid progenitor); cells colored according to cell cycle phase; cells colored according to single-cell genotype at the indicated site: blue, at least one mutant read detected; yellow, wild-type reads only; gray, no coverage. b 548327, putative AML cells circled. c 508084. d 782328
Fig. 5
Fig. 5
GATA2R361C Subclonal expression signature. a t-SNE projection showing mutation-expressing cells in blue (GATA2R361C) and pink (TIMM17BL122fs). b Cells colored according to graph-based cluster assignment. c Heatmap of top 50 mutation-dependent genes, with bar graph showing mutant cell fraction in each AML cluster (labeled to the right of the heatmap). d Cells colored according to VIM expression (left), and scatterplot showing average VIM expression in each cluster as a function of the subclonal mutation fraction of each cluster (right). e t-SNE plot constructed from mutant cells, which are colored according to the mutation they contain: GATA2R361C, yellow; DNMT3AR882H, pink; FLT3-ITD, green; FLT3F612L, purple; NPM1W288FS; other somatic mutation(s), gray. f Mutant cells colored according to graph-based cluster. g Heatmap of top 25 subclonal mutation-dependent genes, with bar graph showing mutant cell fraction in each cluster (labeled to the right of the heatmap). Genes that are highly correlated with VIM in TCGA are indicated with blue dots. h Venn diagram indicating gene sets used to identify the VIM regulome
Fig. 6
Fig. 6
Orthogonal confirmation of GATA2R361C expression signature by flow cytometry and targeted sequencing. a Cells colored according to CD99 expression (top), and scatterplot showing average CD99 expression in each cluster as a function of the GATA2 mutation fraction of each cluster (bottom). b Sorting strategy: Cells staining positive for the dead cell dye Sytox-blue were excluded, then debris was excluded. Singlets were gated for final sorting of CD99-low and CD99-high expressing populations. c Gating of cells based on CD99 expression using flow cytometry (bone marrow, left; peripheral blood, right). d Variant allele fraction of the founding clone DNMT3AR882H mutation and the subclonal GATA2R361C mutation in unsorted cells (gray), CD99-high cells (blue), and CD99-low cells (red) (bone marrow, left; peripheral blood, right)
Fig. 7
Fig. 7
Additional mutation-associated gene expression signatures. a t-SNE plot of 508084, cells colored by graph-based cluster. b Cells colored according to coverage at the RNF10NULL site (mutant = blue, wild-type = yellow). c Genes that are differentially expressed between mutant-rich and mutant-poor clusters. d t-SNE plot of 809653, cells colored by graph-based cluster. e Cells colored according to coverage at the CEBPAR142fs site (mutant = blue, wild-type = yellow). f Genes that are differentially expressed between mutant-rich and mutant-poor clusters; non-AML cells shown for comparison

References

    1. Ding J, Lin C, Bar-Joseph Z. Cell lineage inference from SNP and scRNA-Seq data. Nucleic Acids Res. 2018;47:56–64. doi: 10.1093/nar/gkz146. - DOI - PMC - PubMed
    1. van der Wijst MGP, et al. Single-cell RNA sequencing identifies celltype- specific cis-eQTLs and co-expression QTLs. Nat. Genet. 2018;50:1–9. doi: 10.1038/s41588-017-0017-4. - DOI - PMC - PubMed
    1. Lee M-CW, et al. Single-cell analyses of transcriptional heterogeneity during drug tolerance transition in cancer cells by RNA sequencing. Proc. Natl Acad. Sci. USA. 2014;111:E4726–E4735. - PMC - PubMed
    1. Patel AP, et al. Single-cell RNA-seq highlights intratumoral heterogeneity in primary glioblastoma. Science. 2014;344:1396–1401. doi: 10.1126/science.1254257. - DOI - PMC - PubMed
    1. Kim K-T, et al. Single-cell mRNA sequencing identifies subclonal heterogeneity in anti-cancer drug responses of lung adenocarcinoma cells. Genome Biol. 2015;16:1–15. doi: 10.1186/s13059-014-0572-2. - DOI - PMC - PubMed

Publication types