. 2019 Aug;572(7770):467-473.
doi: 10.1038/s41586-019-1492-9. Epub 2019 Aug 15.

Genetic induction and mechanochemical propagation of a morphogenetic wave

Affiliations

Genetic induction and mechanochemical propagation of a morphogenetic wave

Anaïs Bailles et al. Nature. 2019 Aug.

Abstract

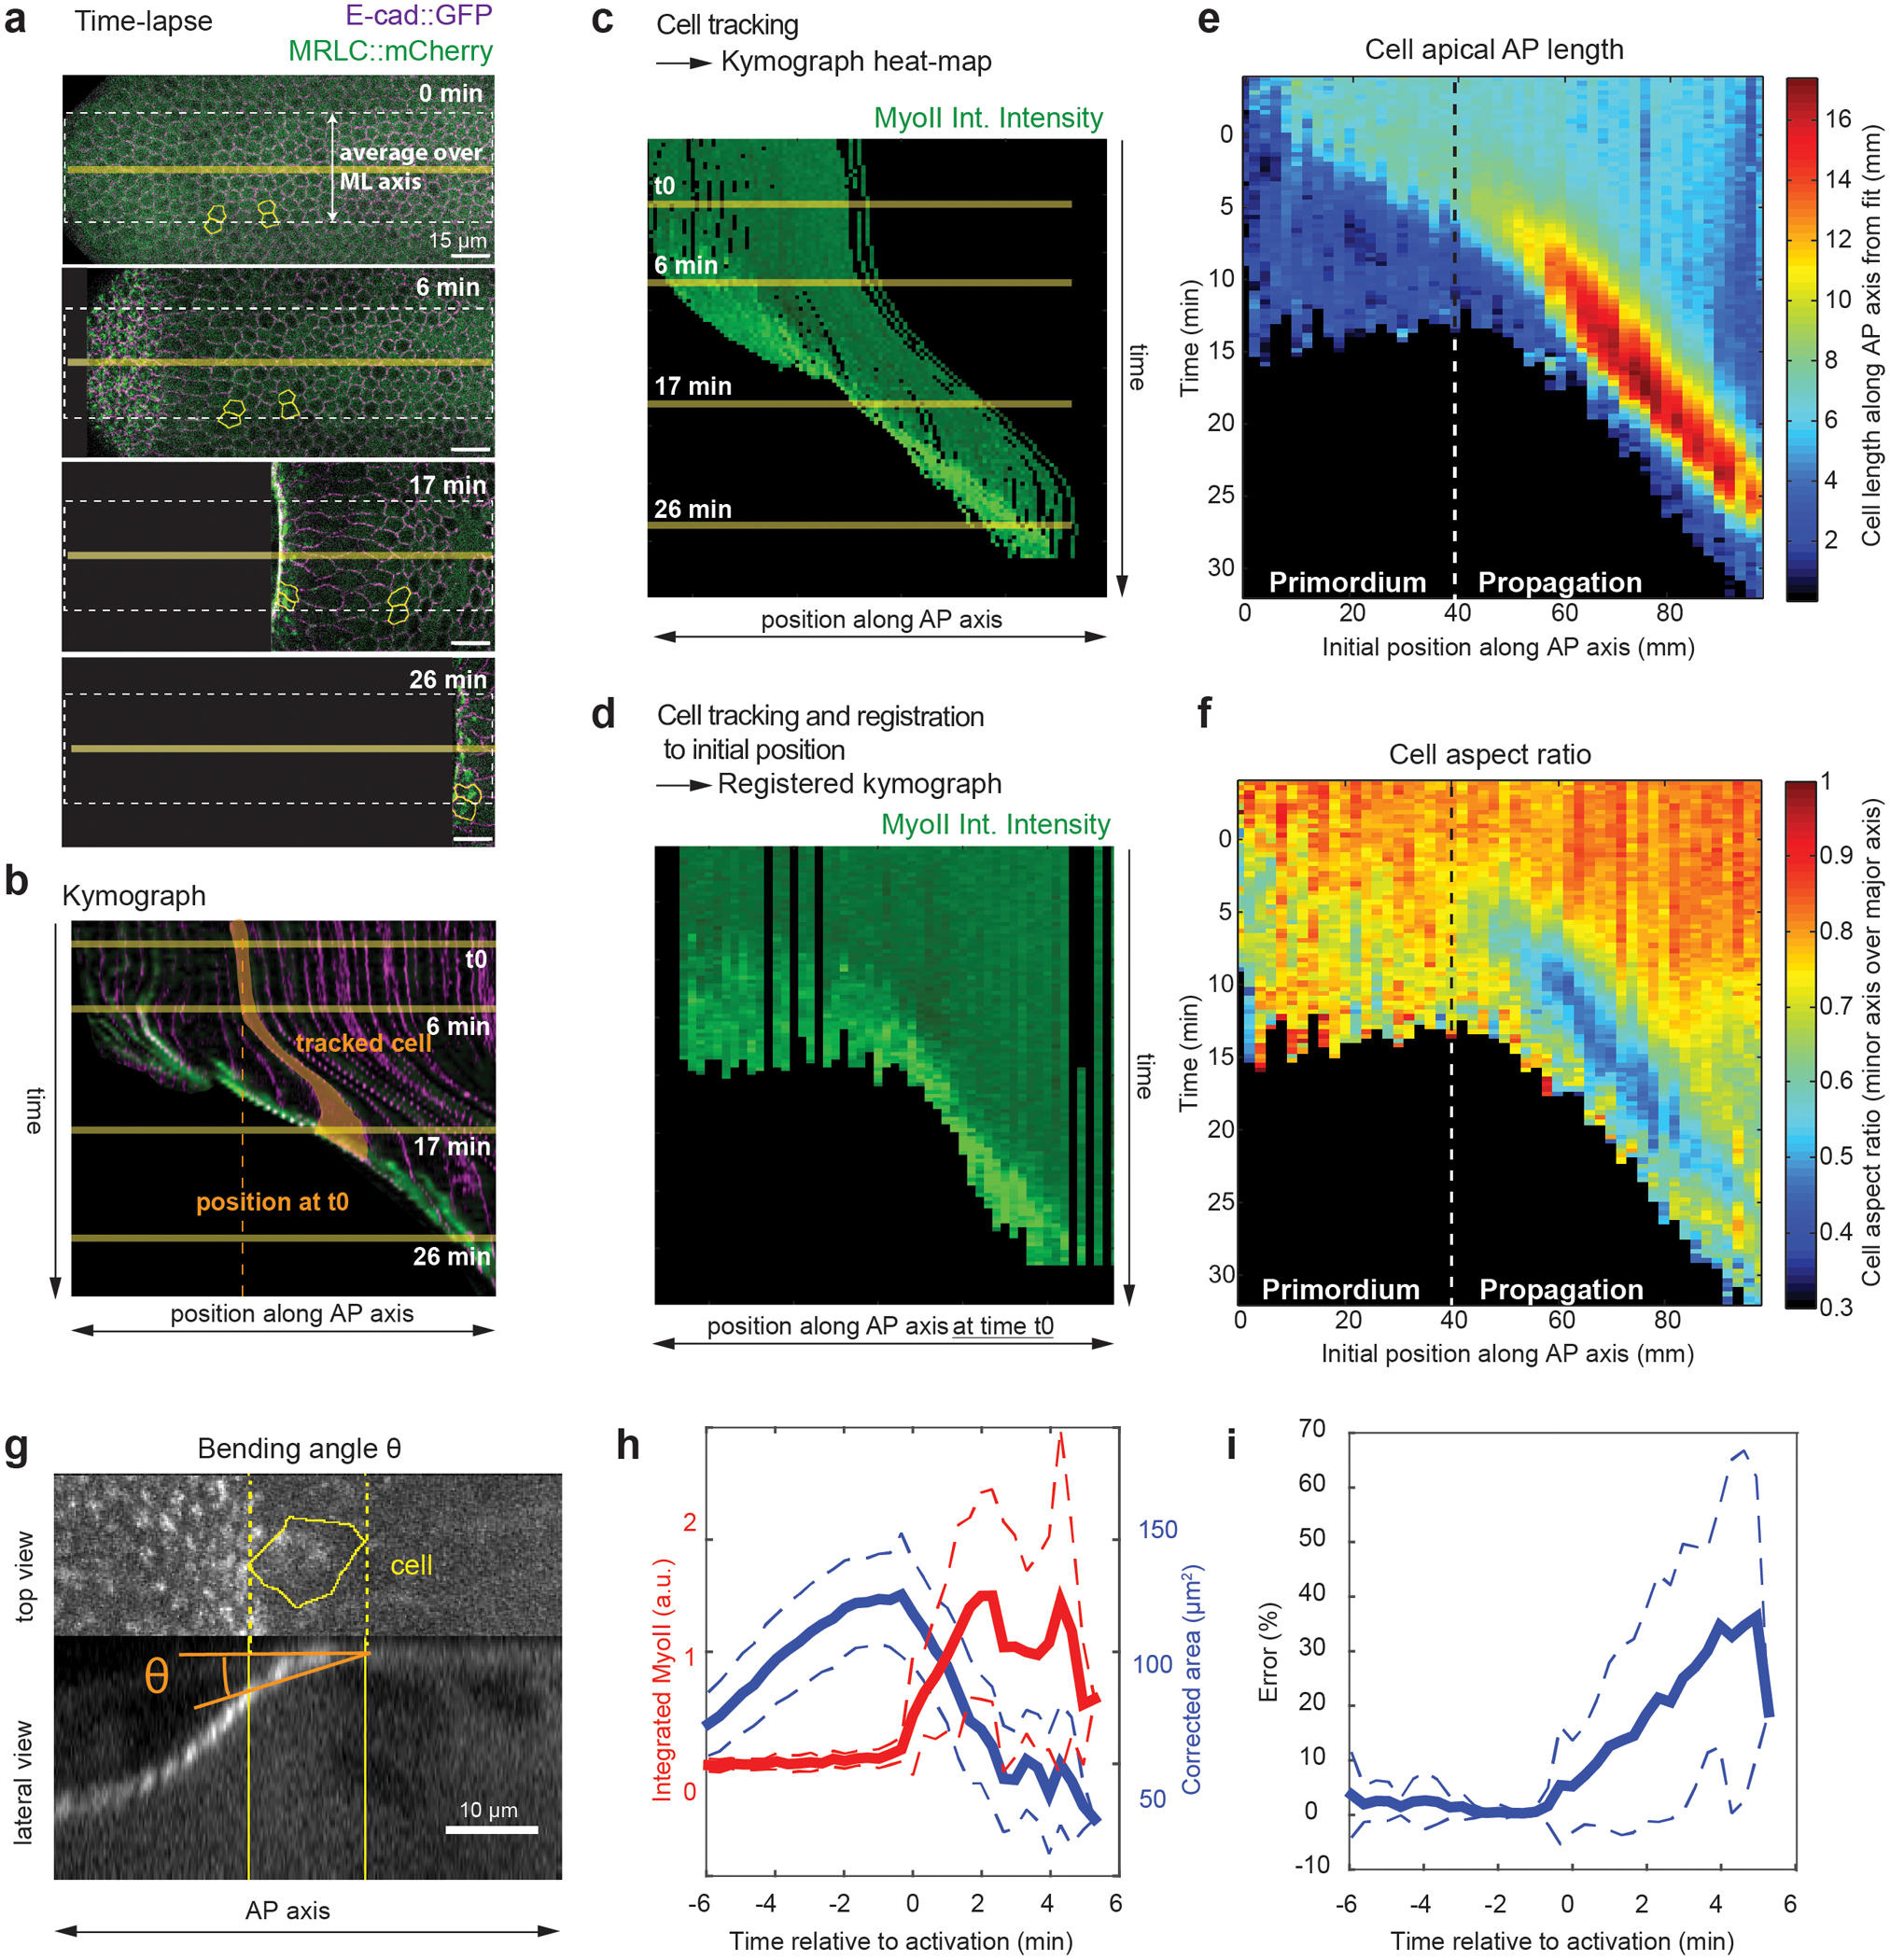
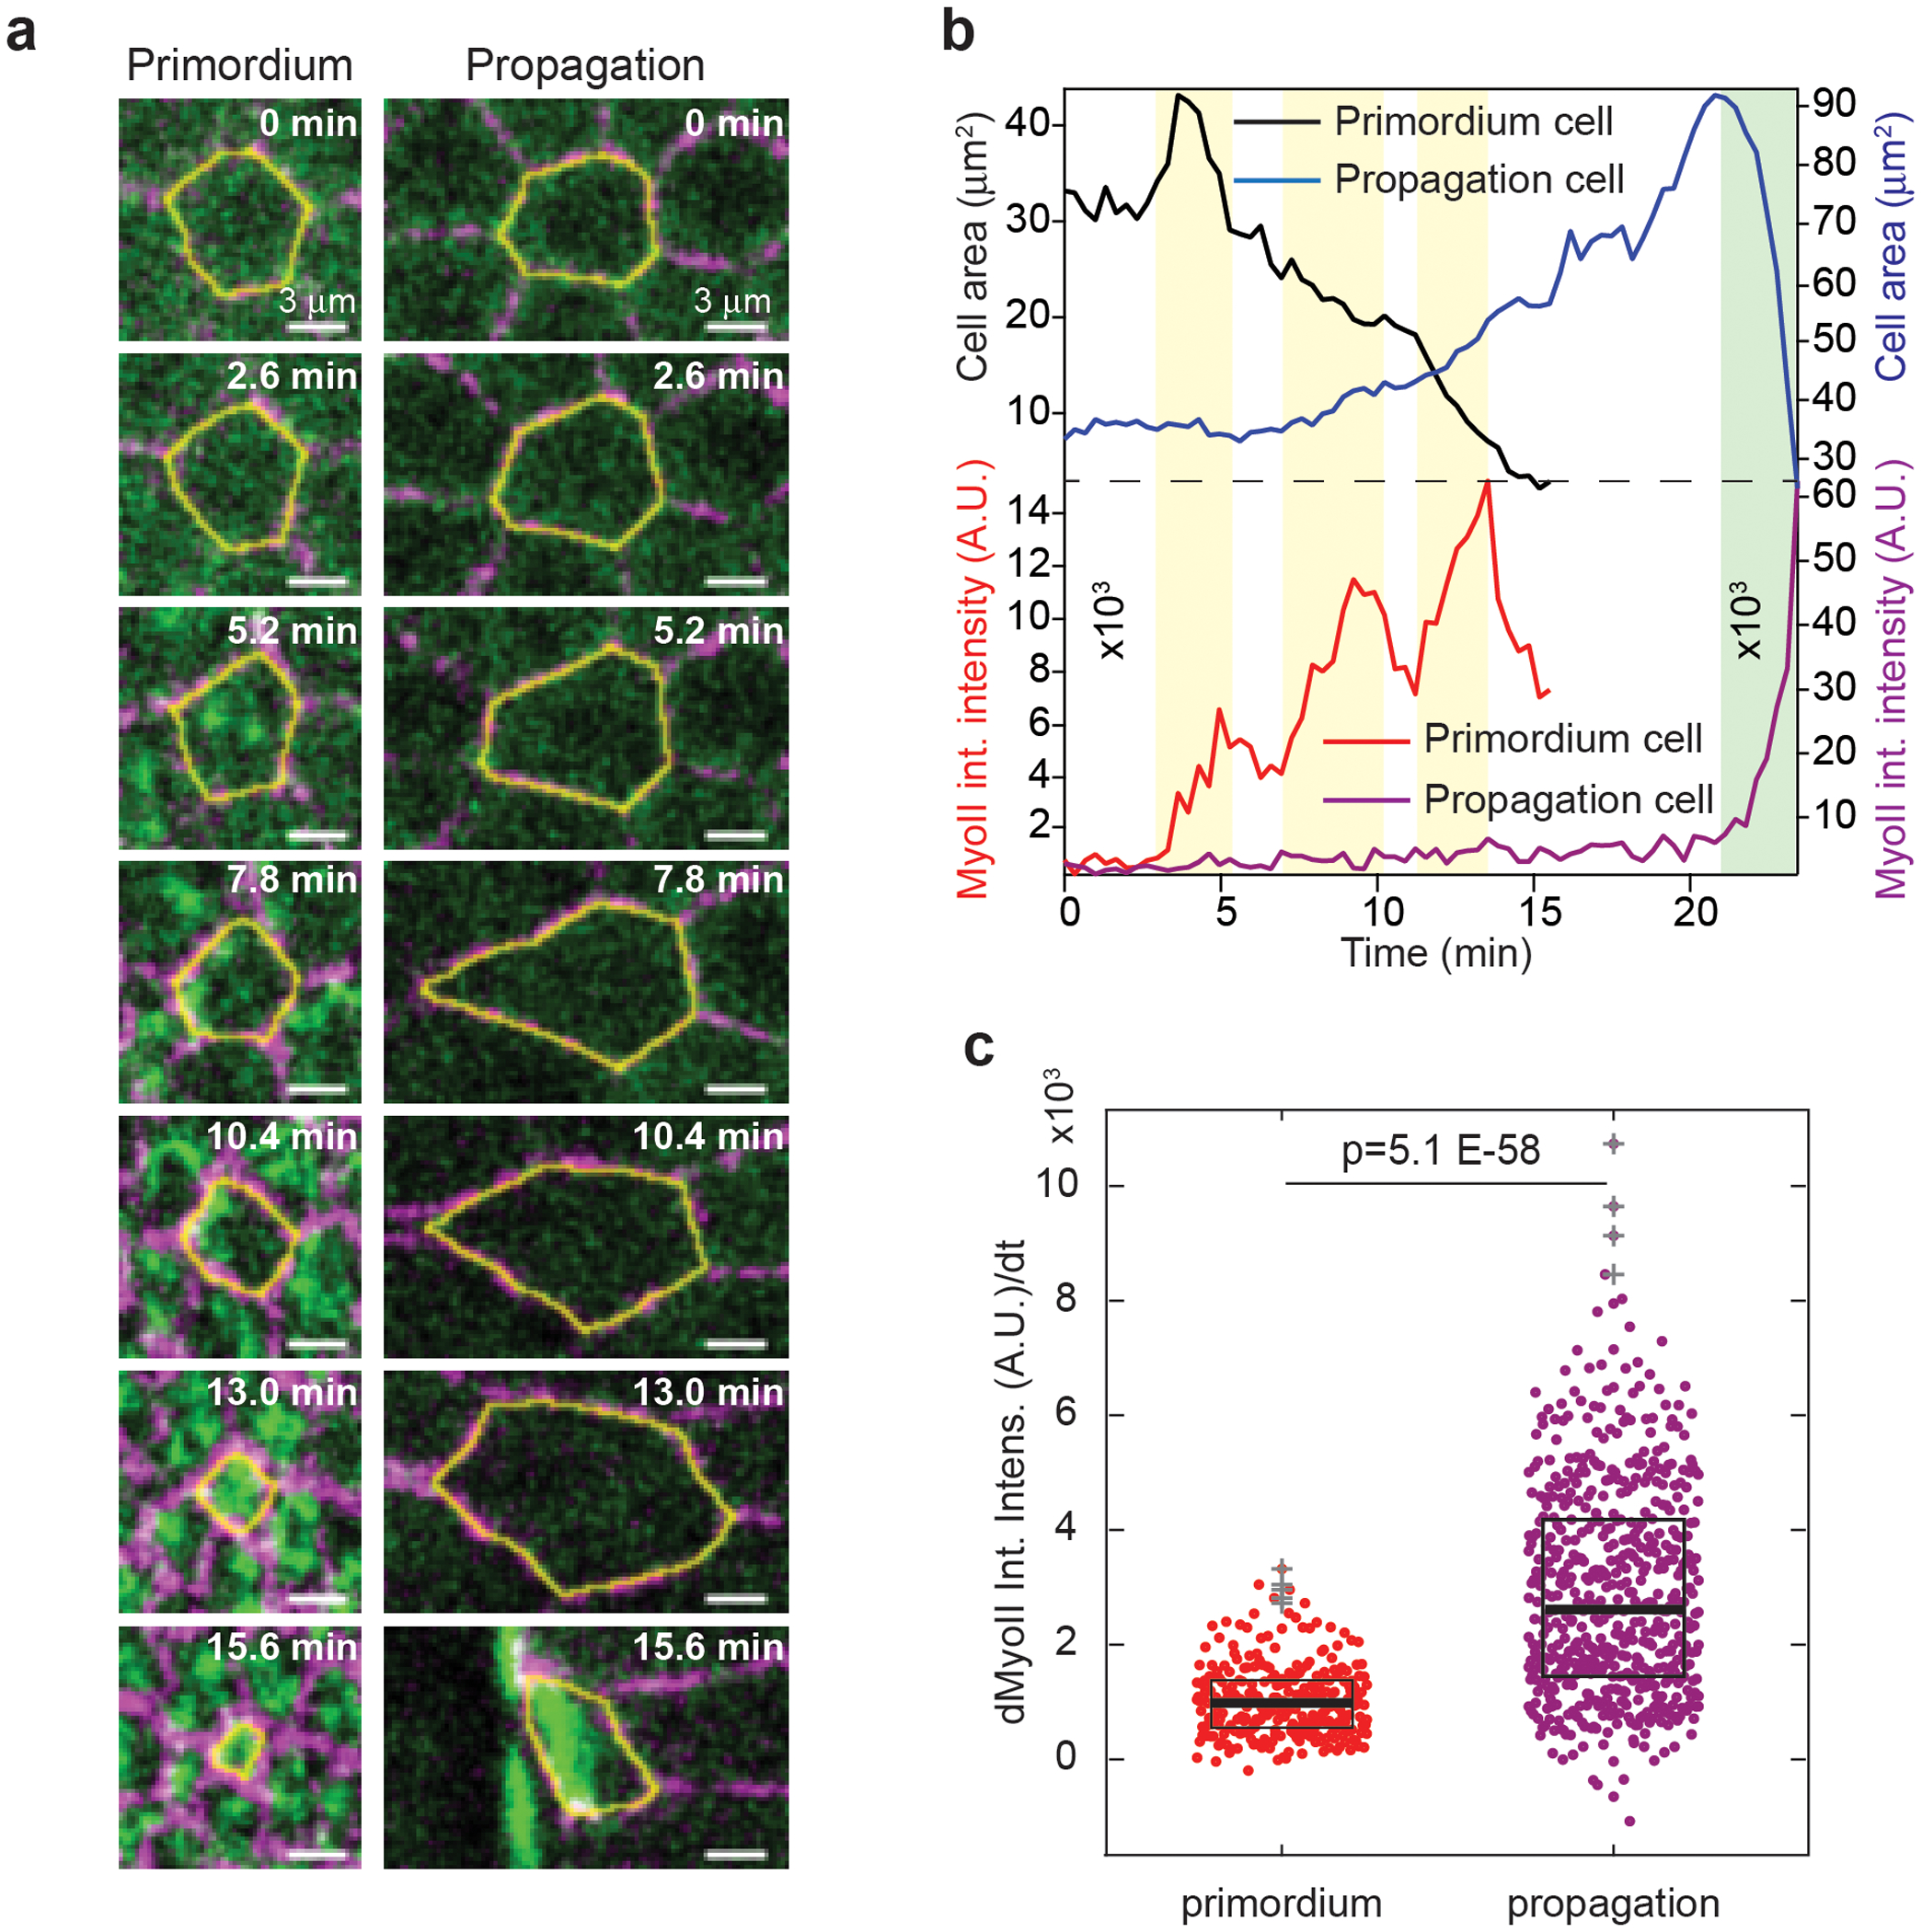
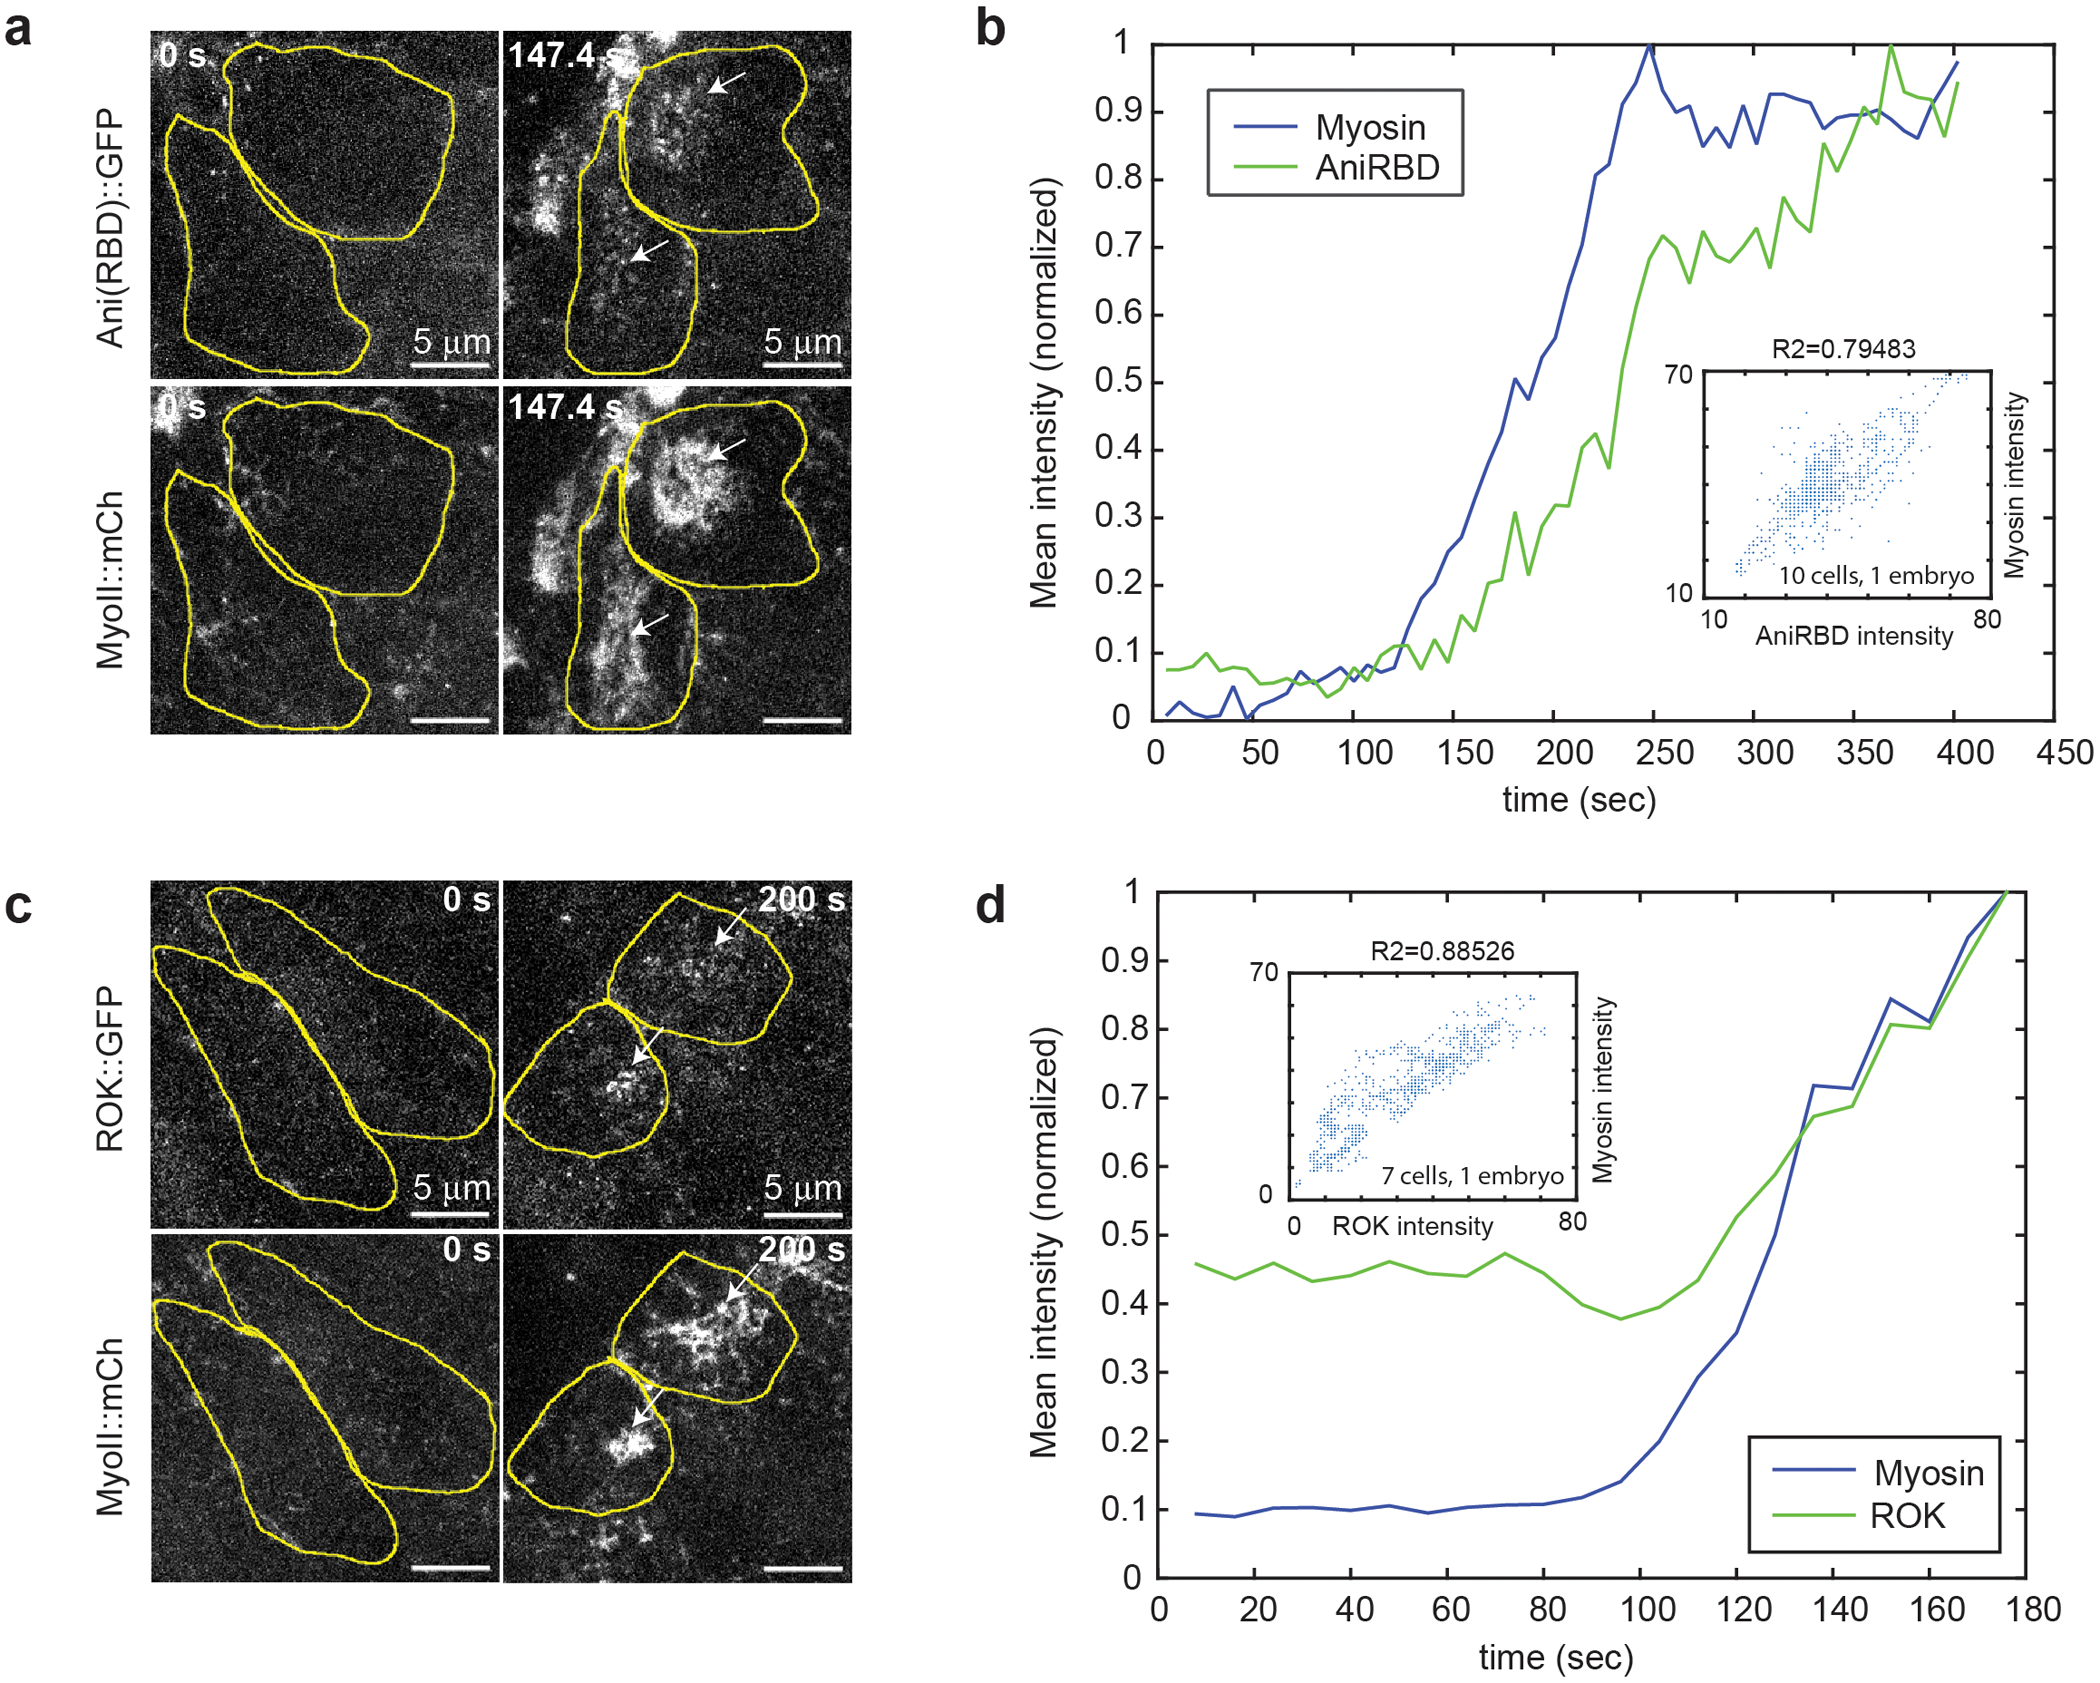
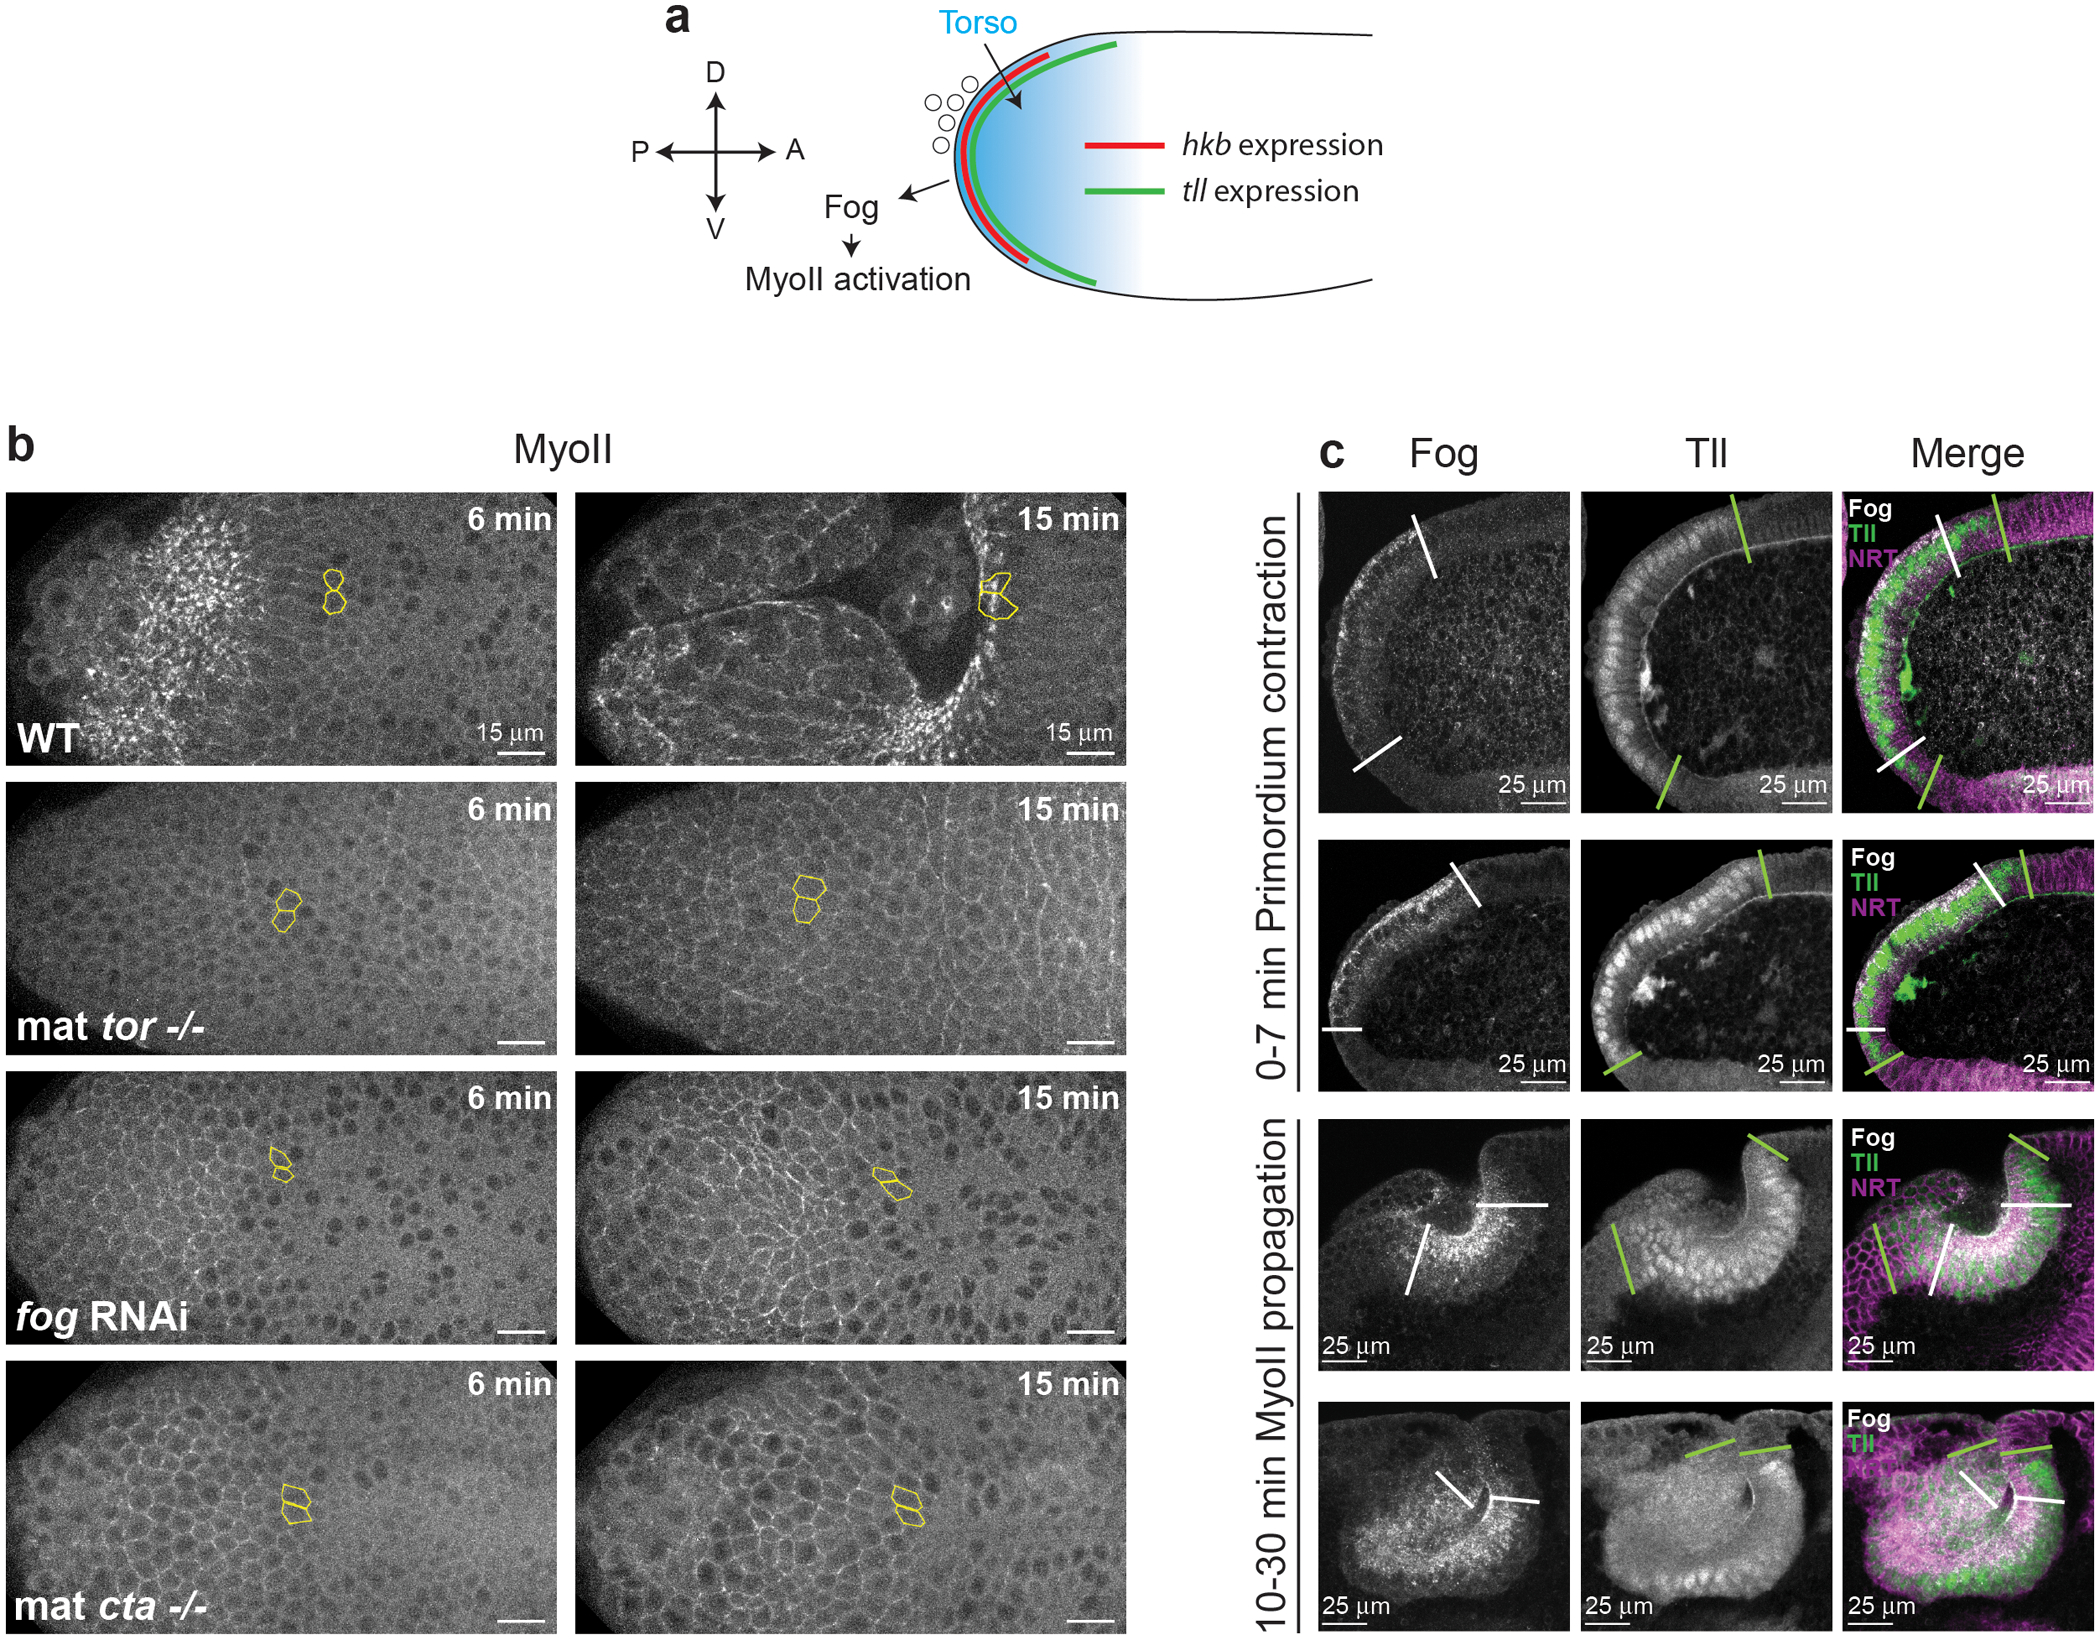
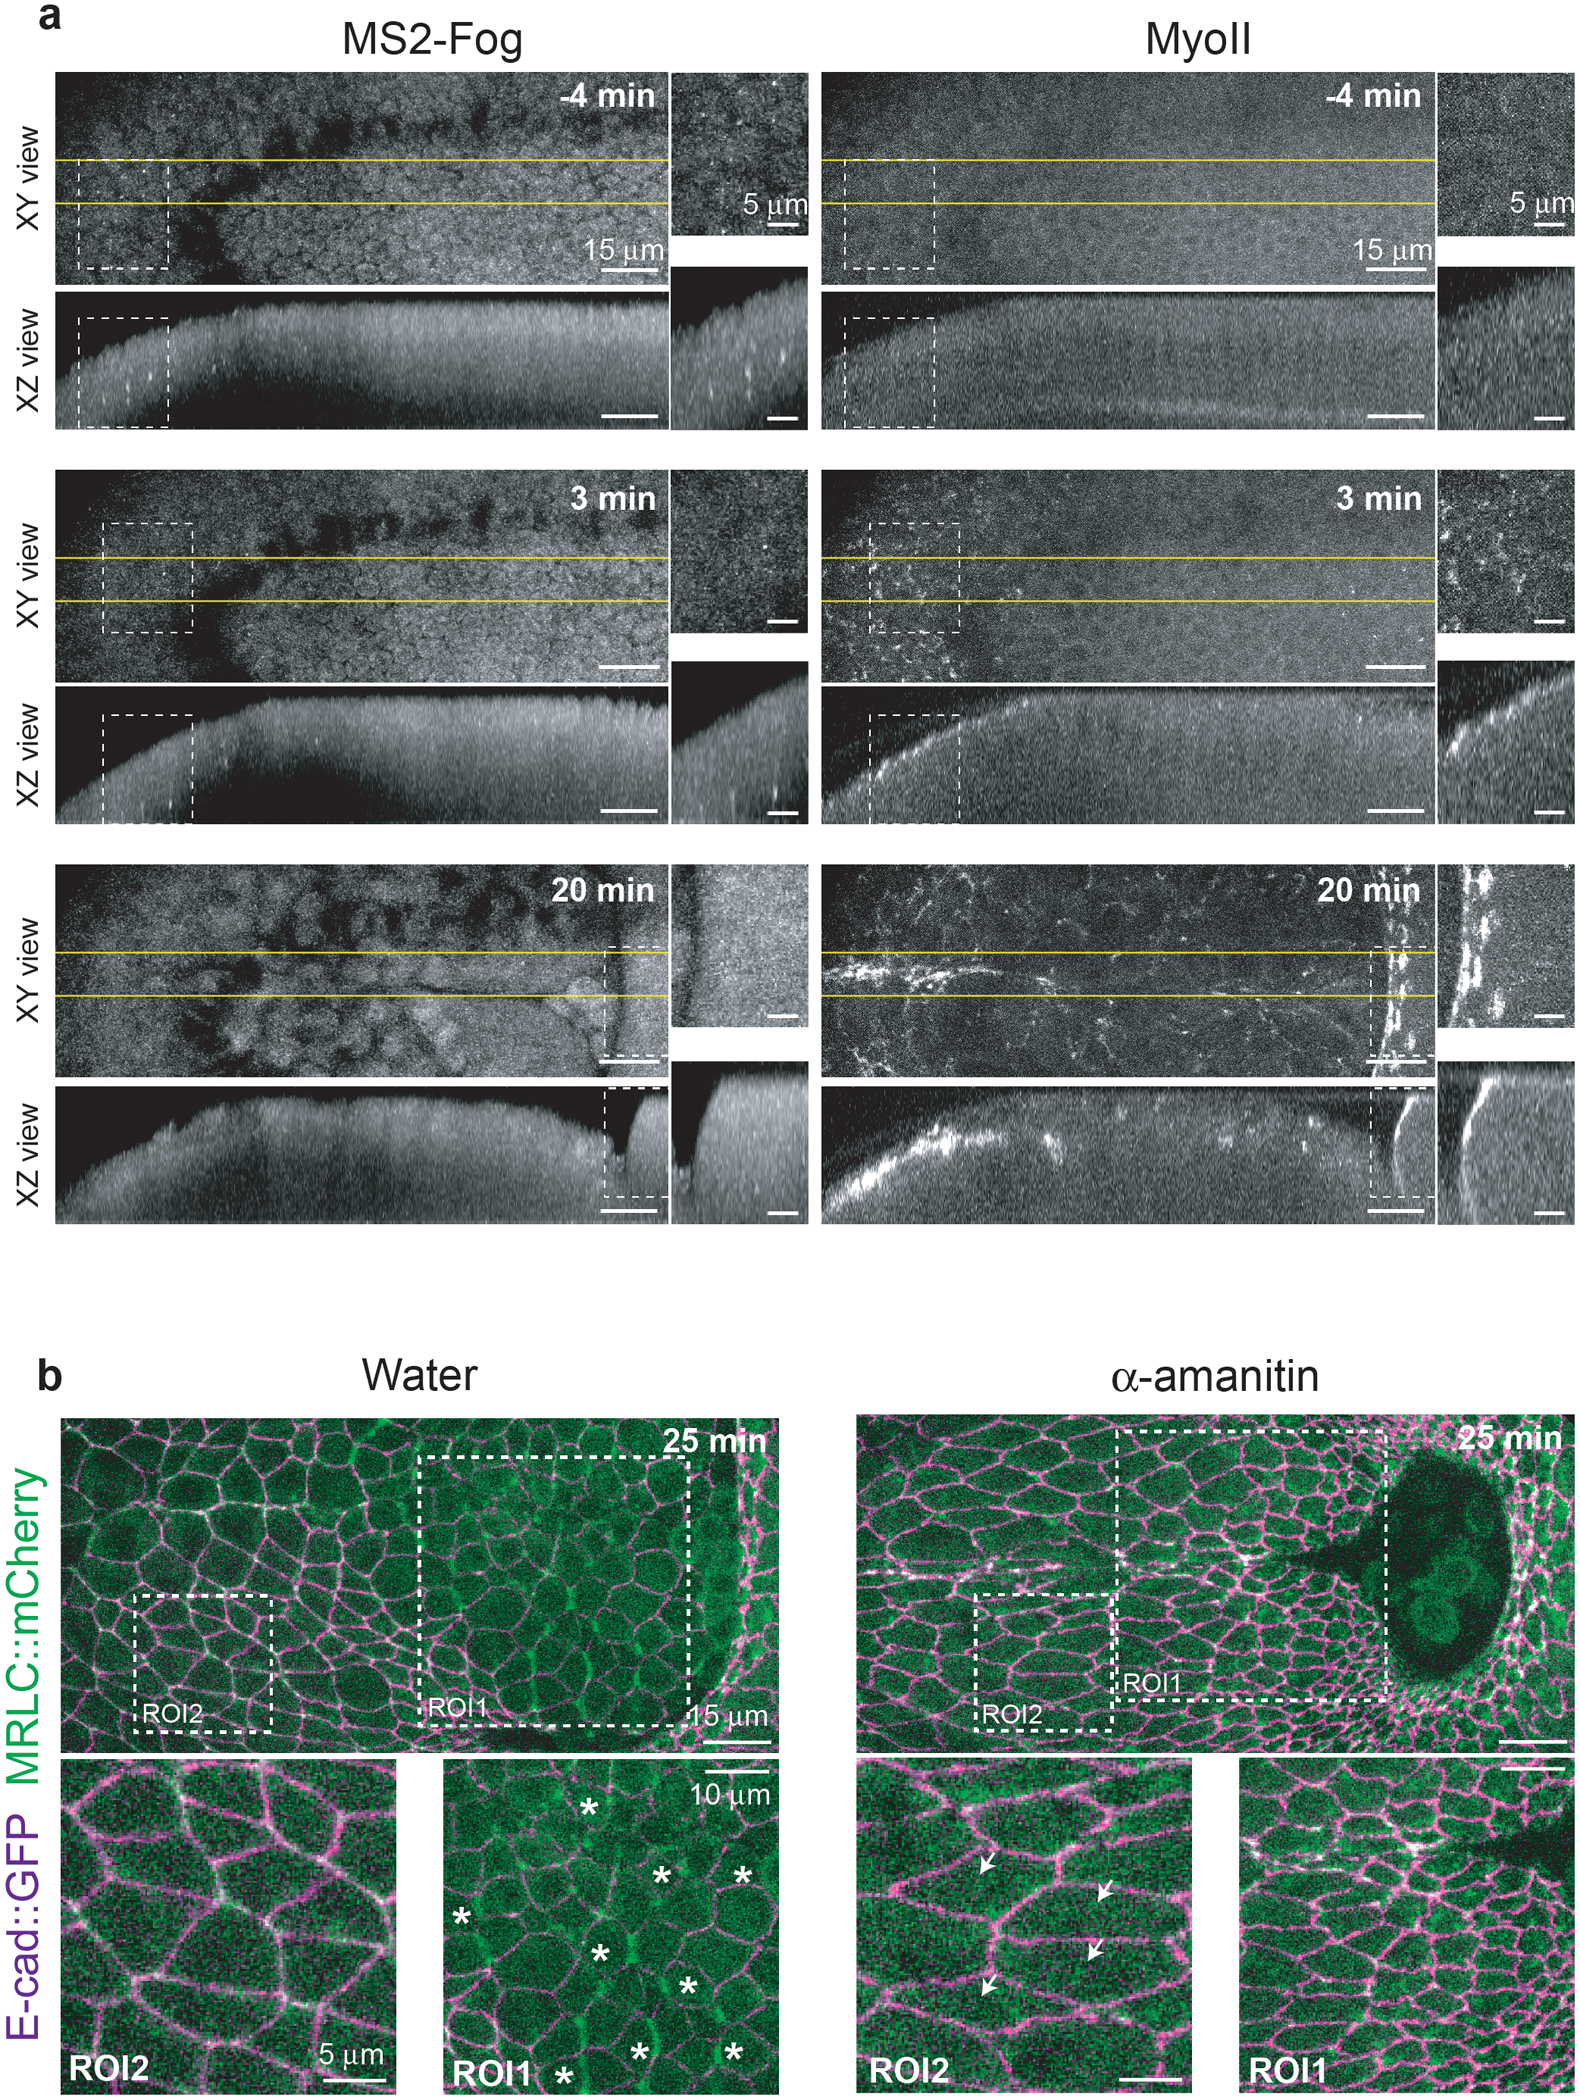
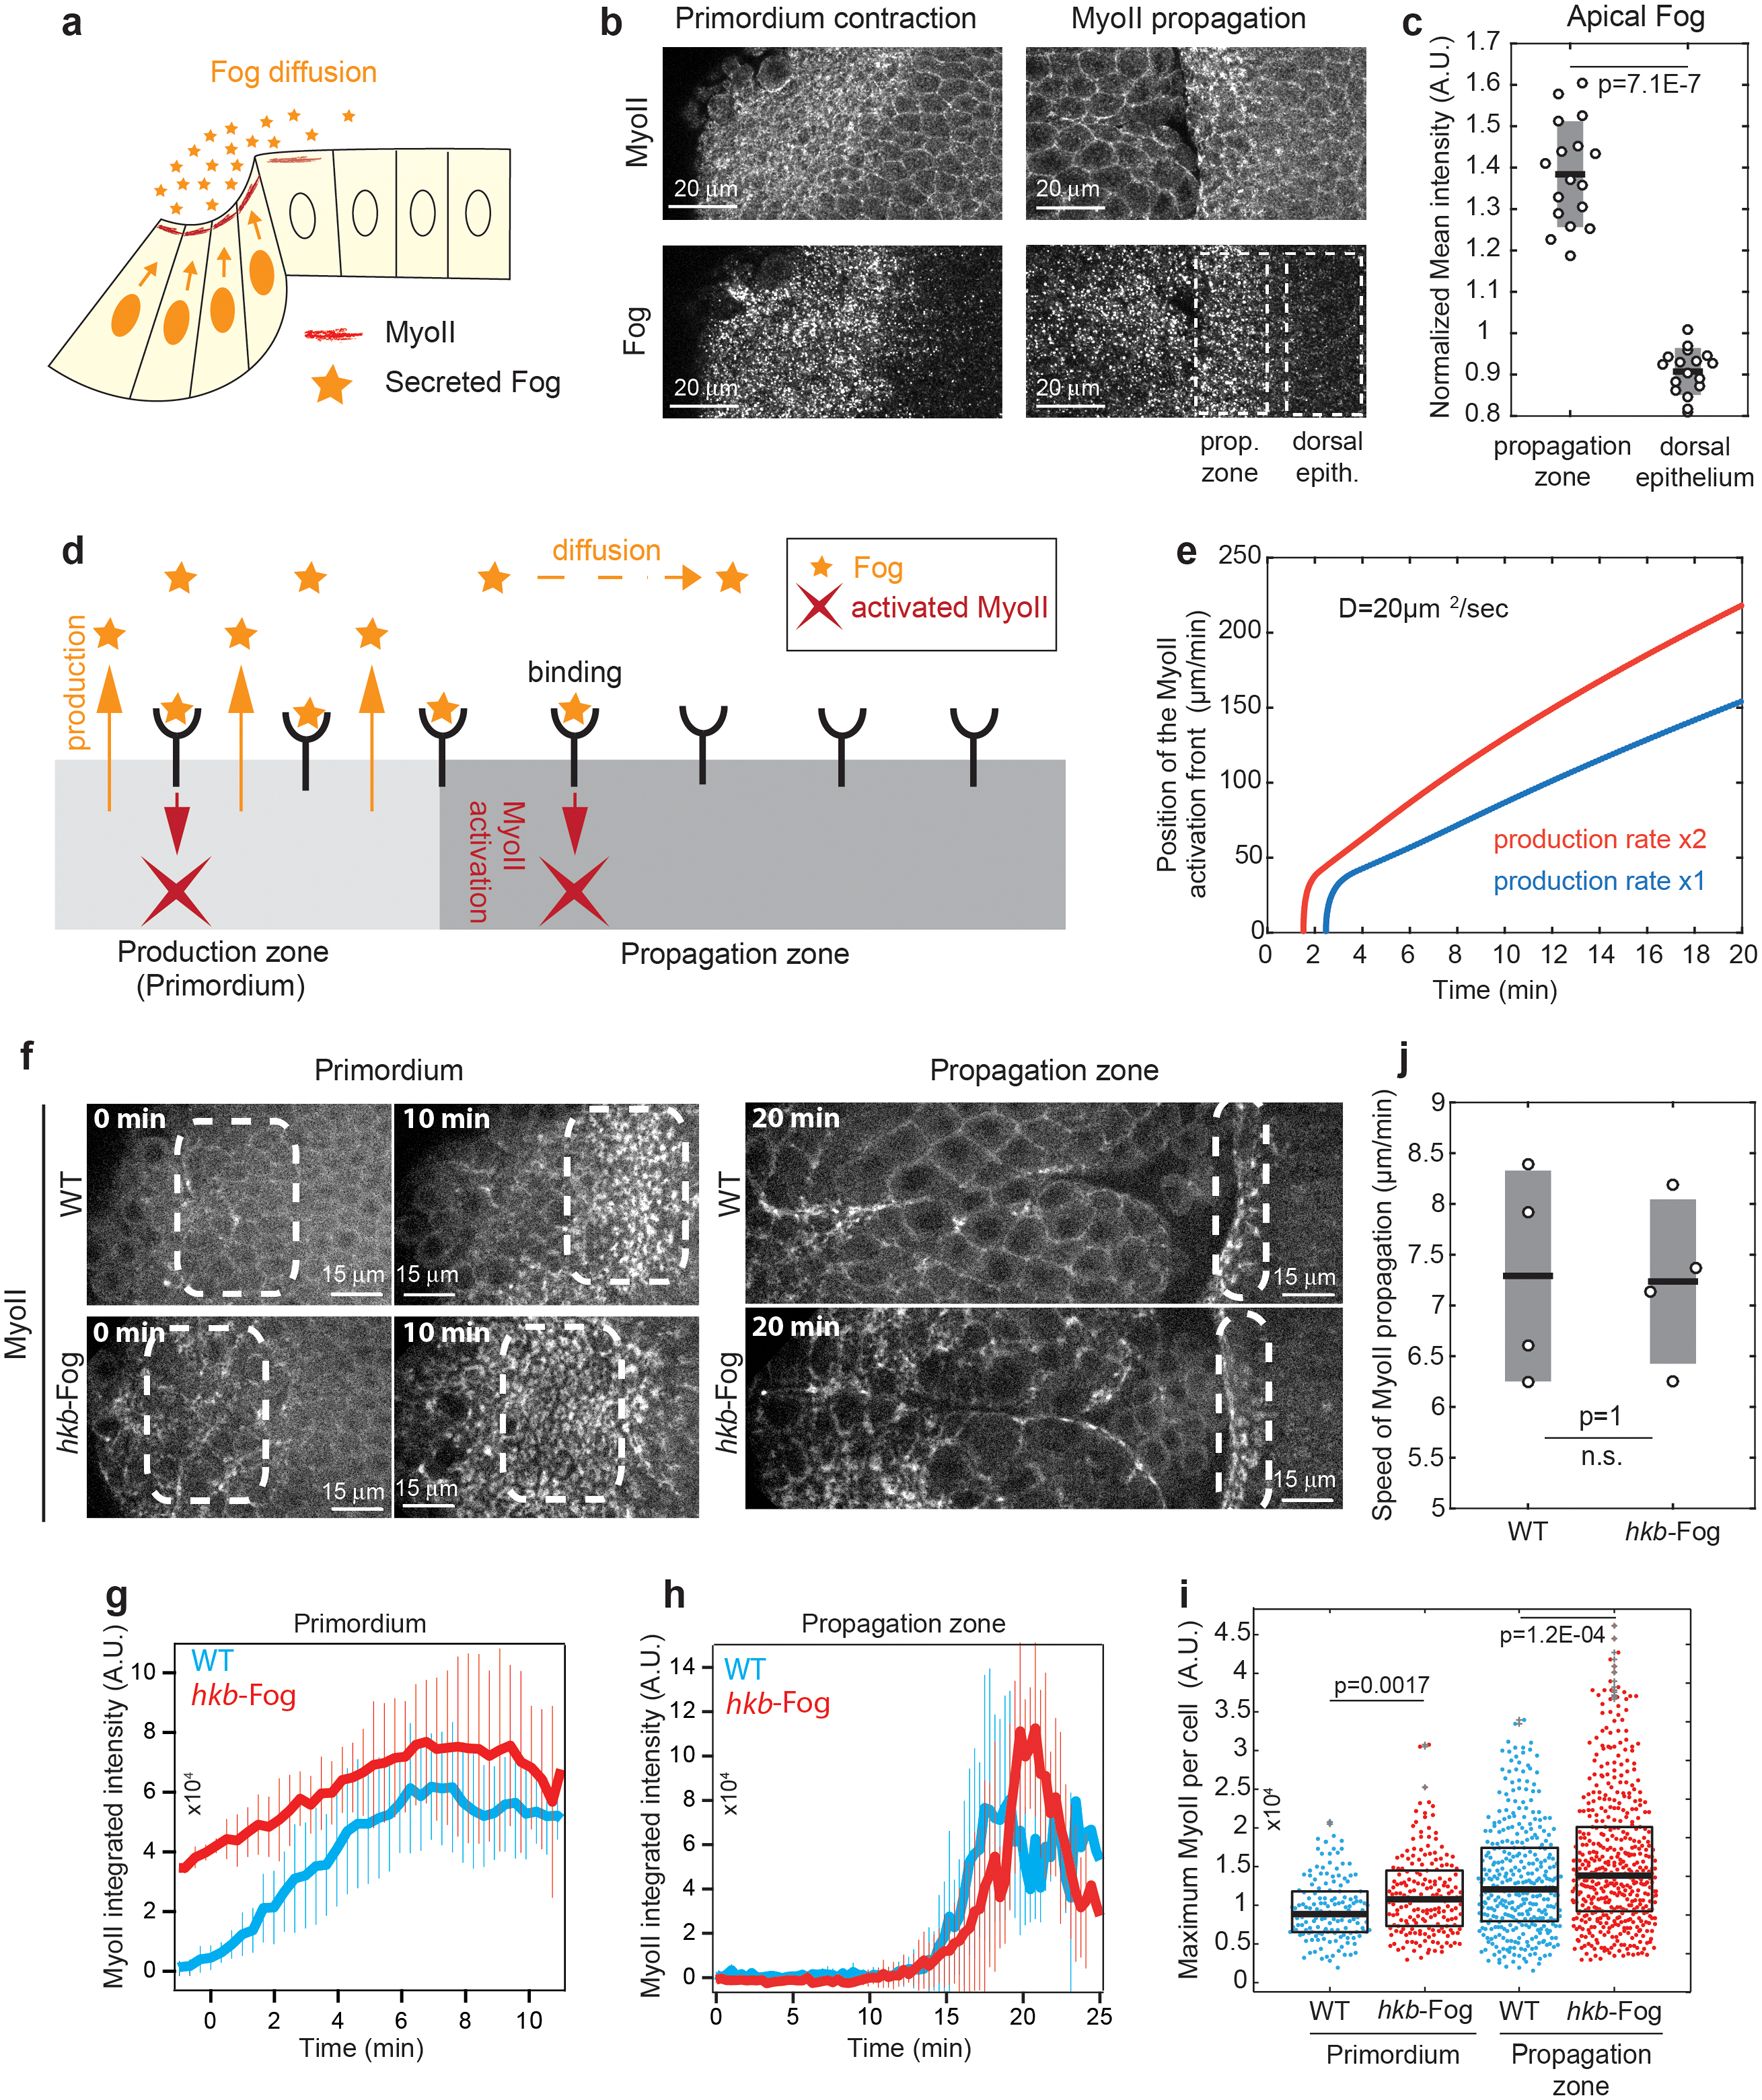
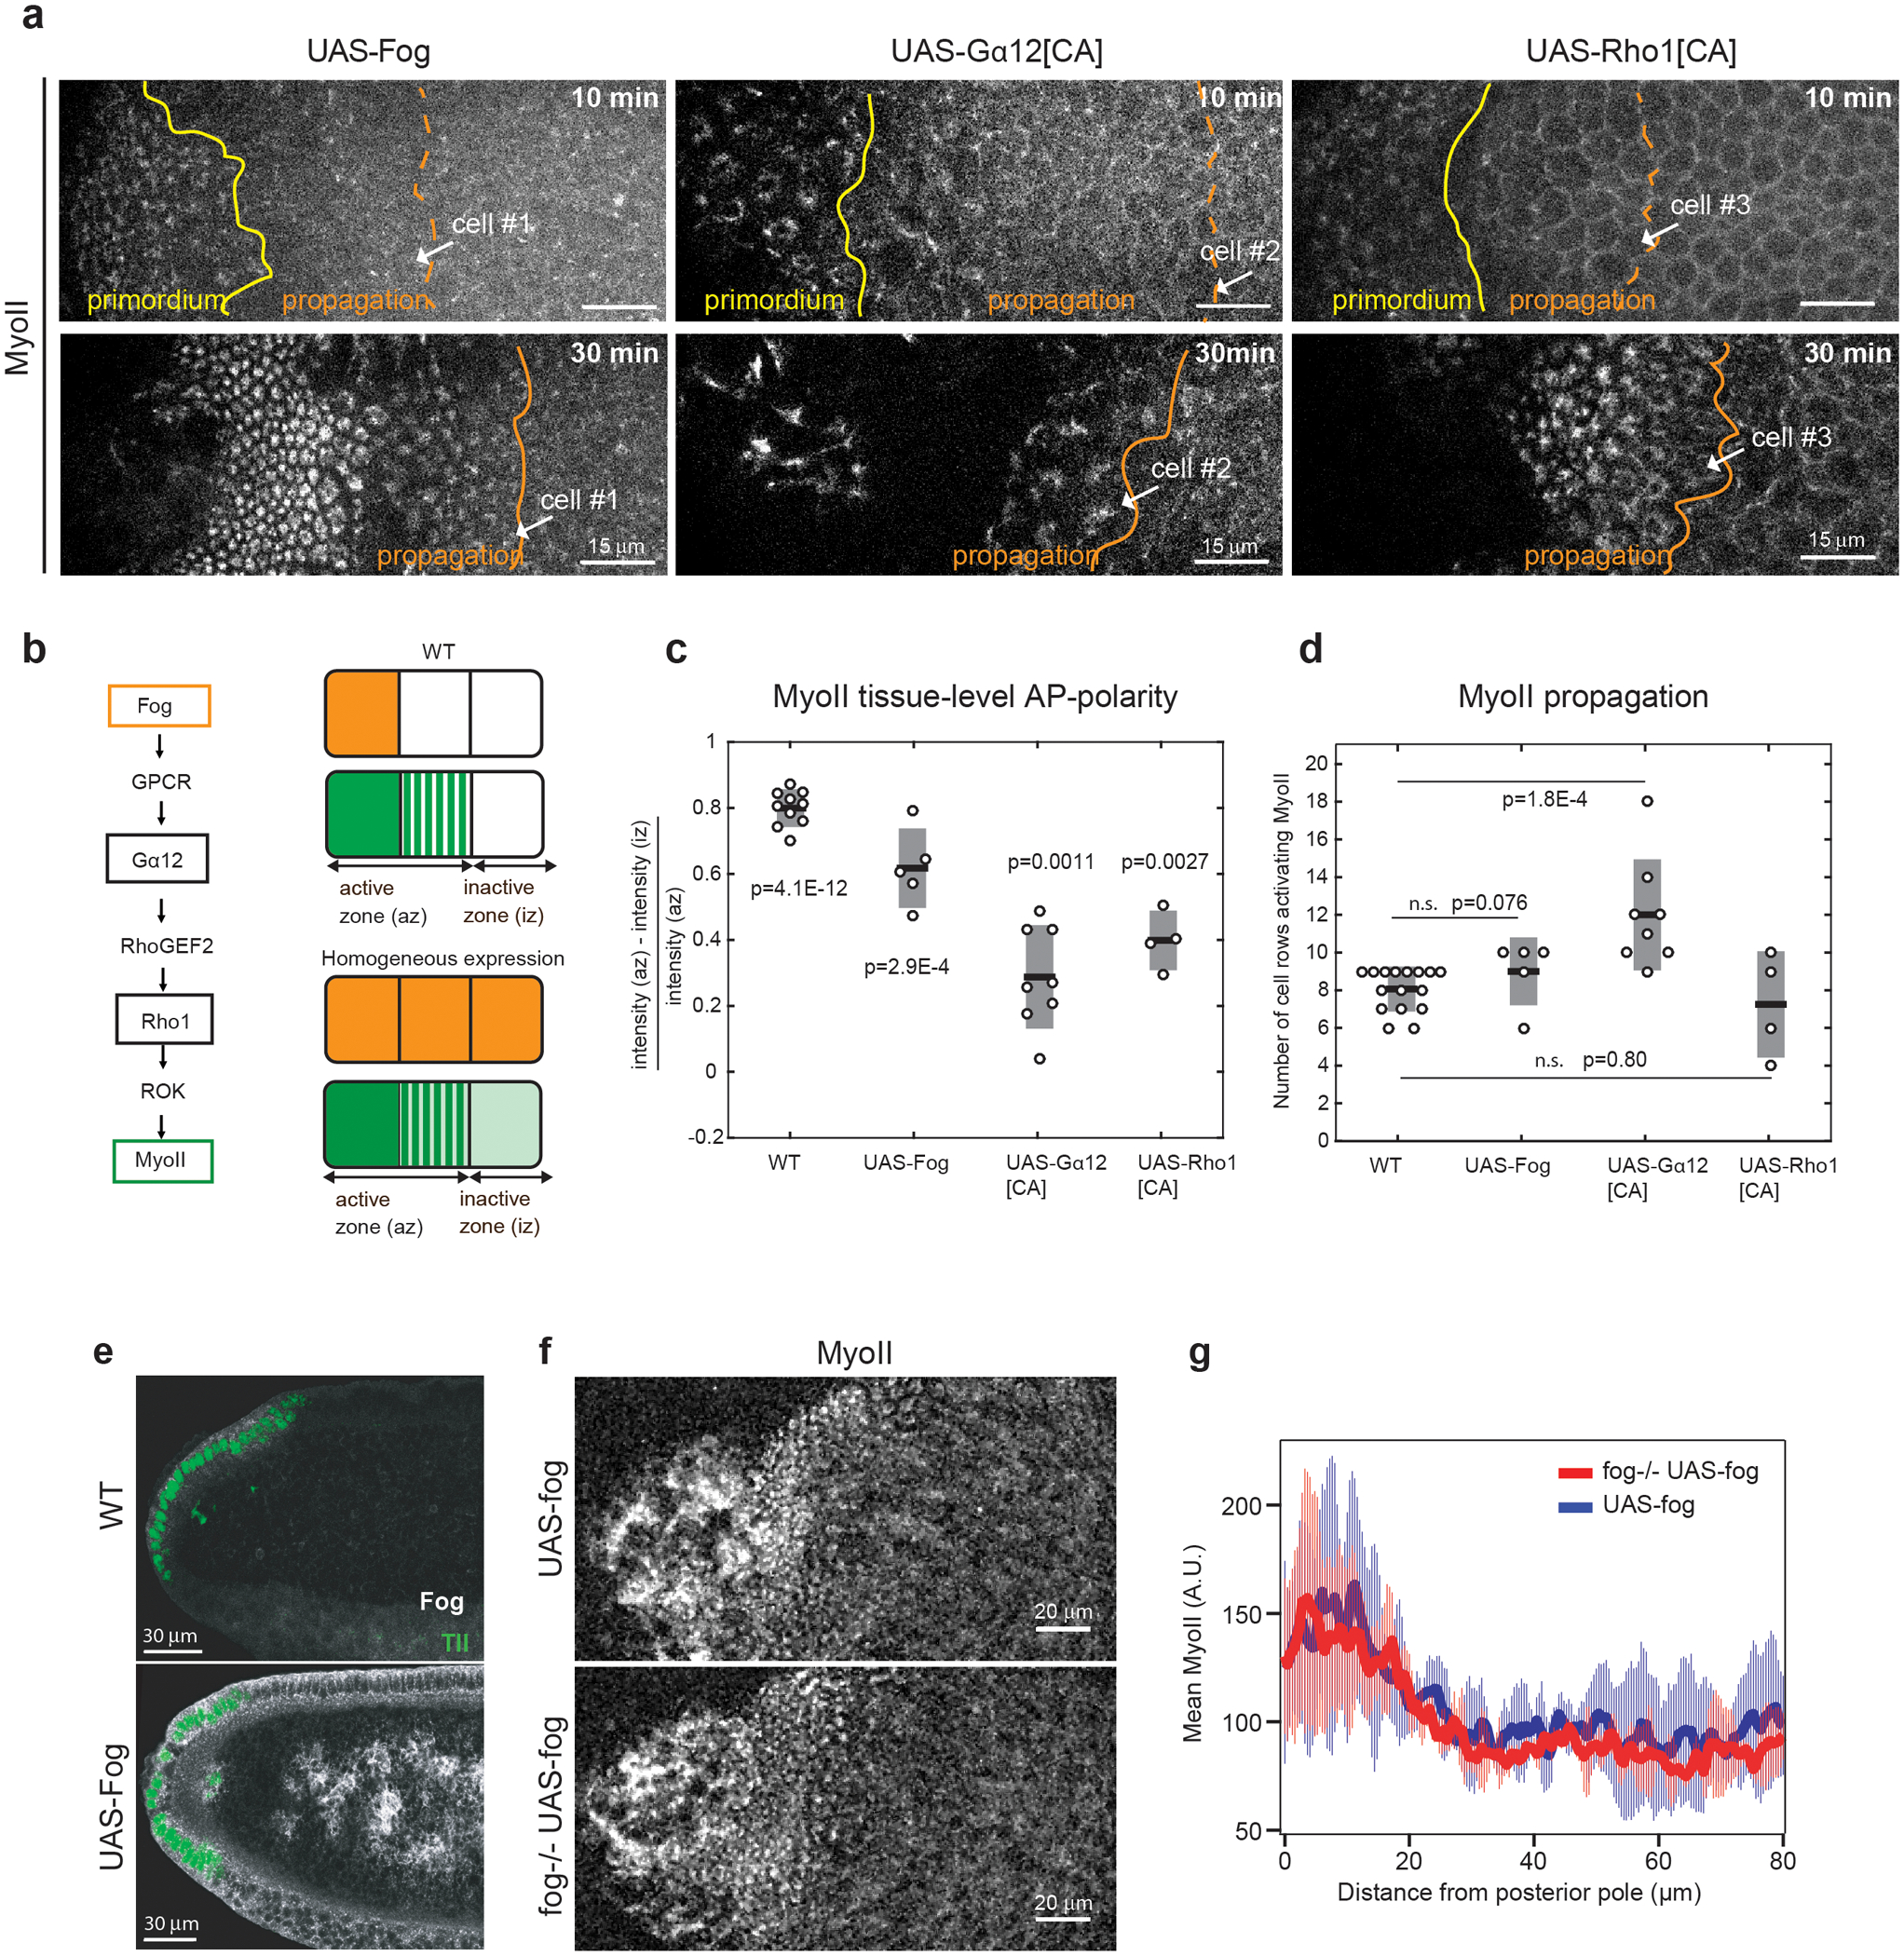
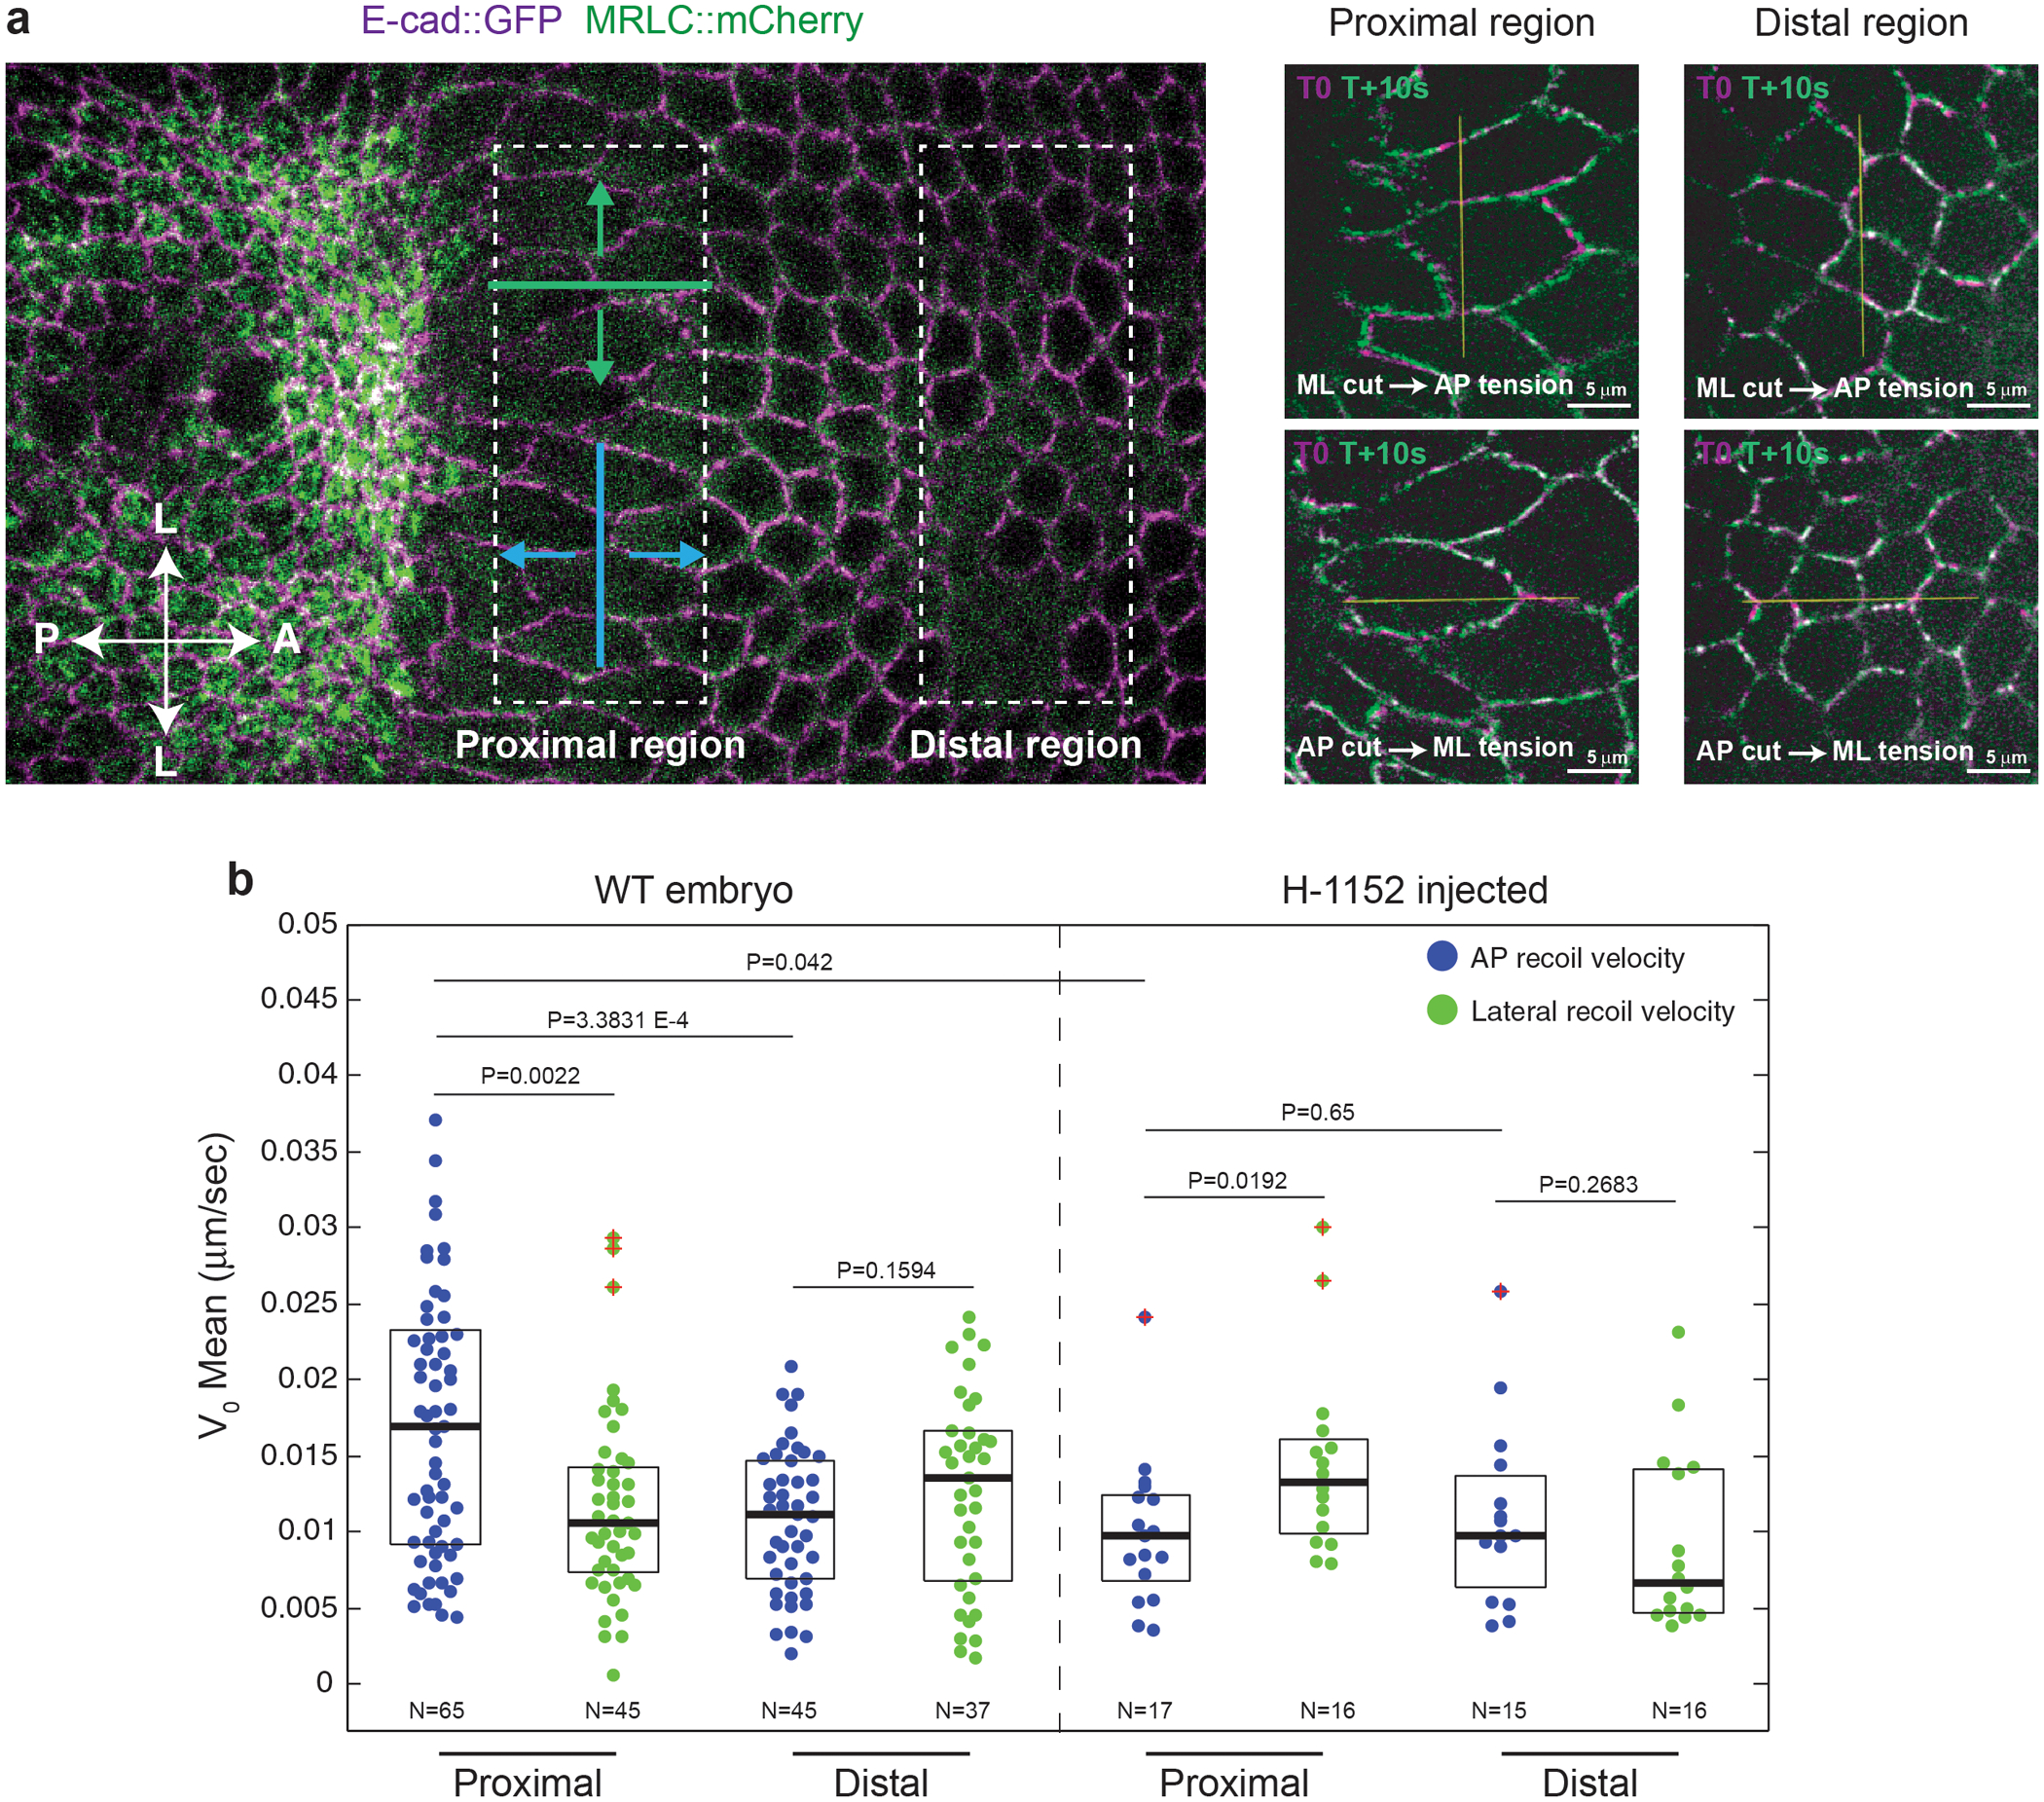
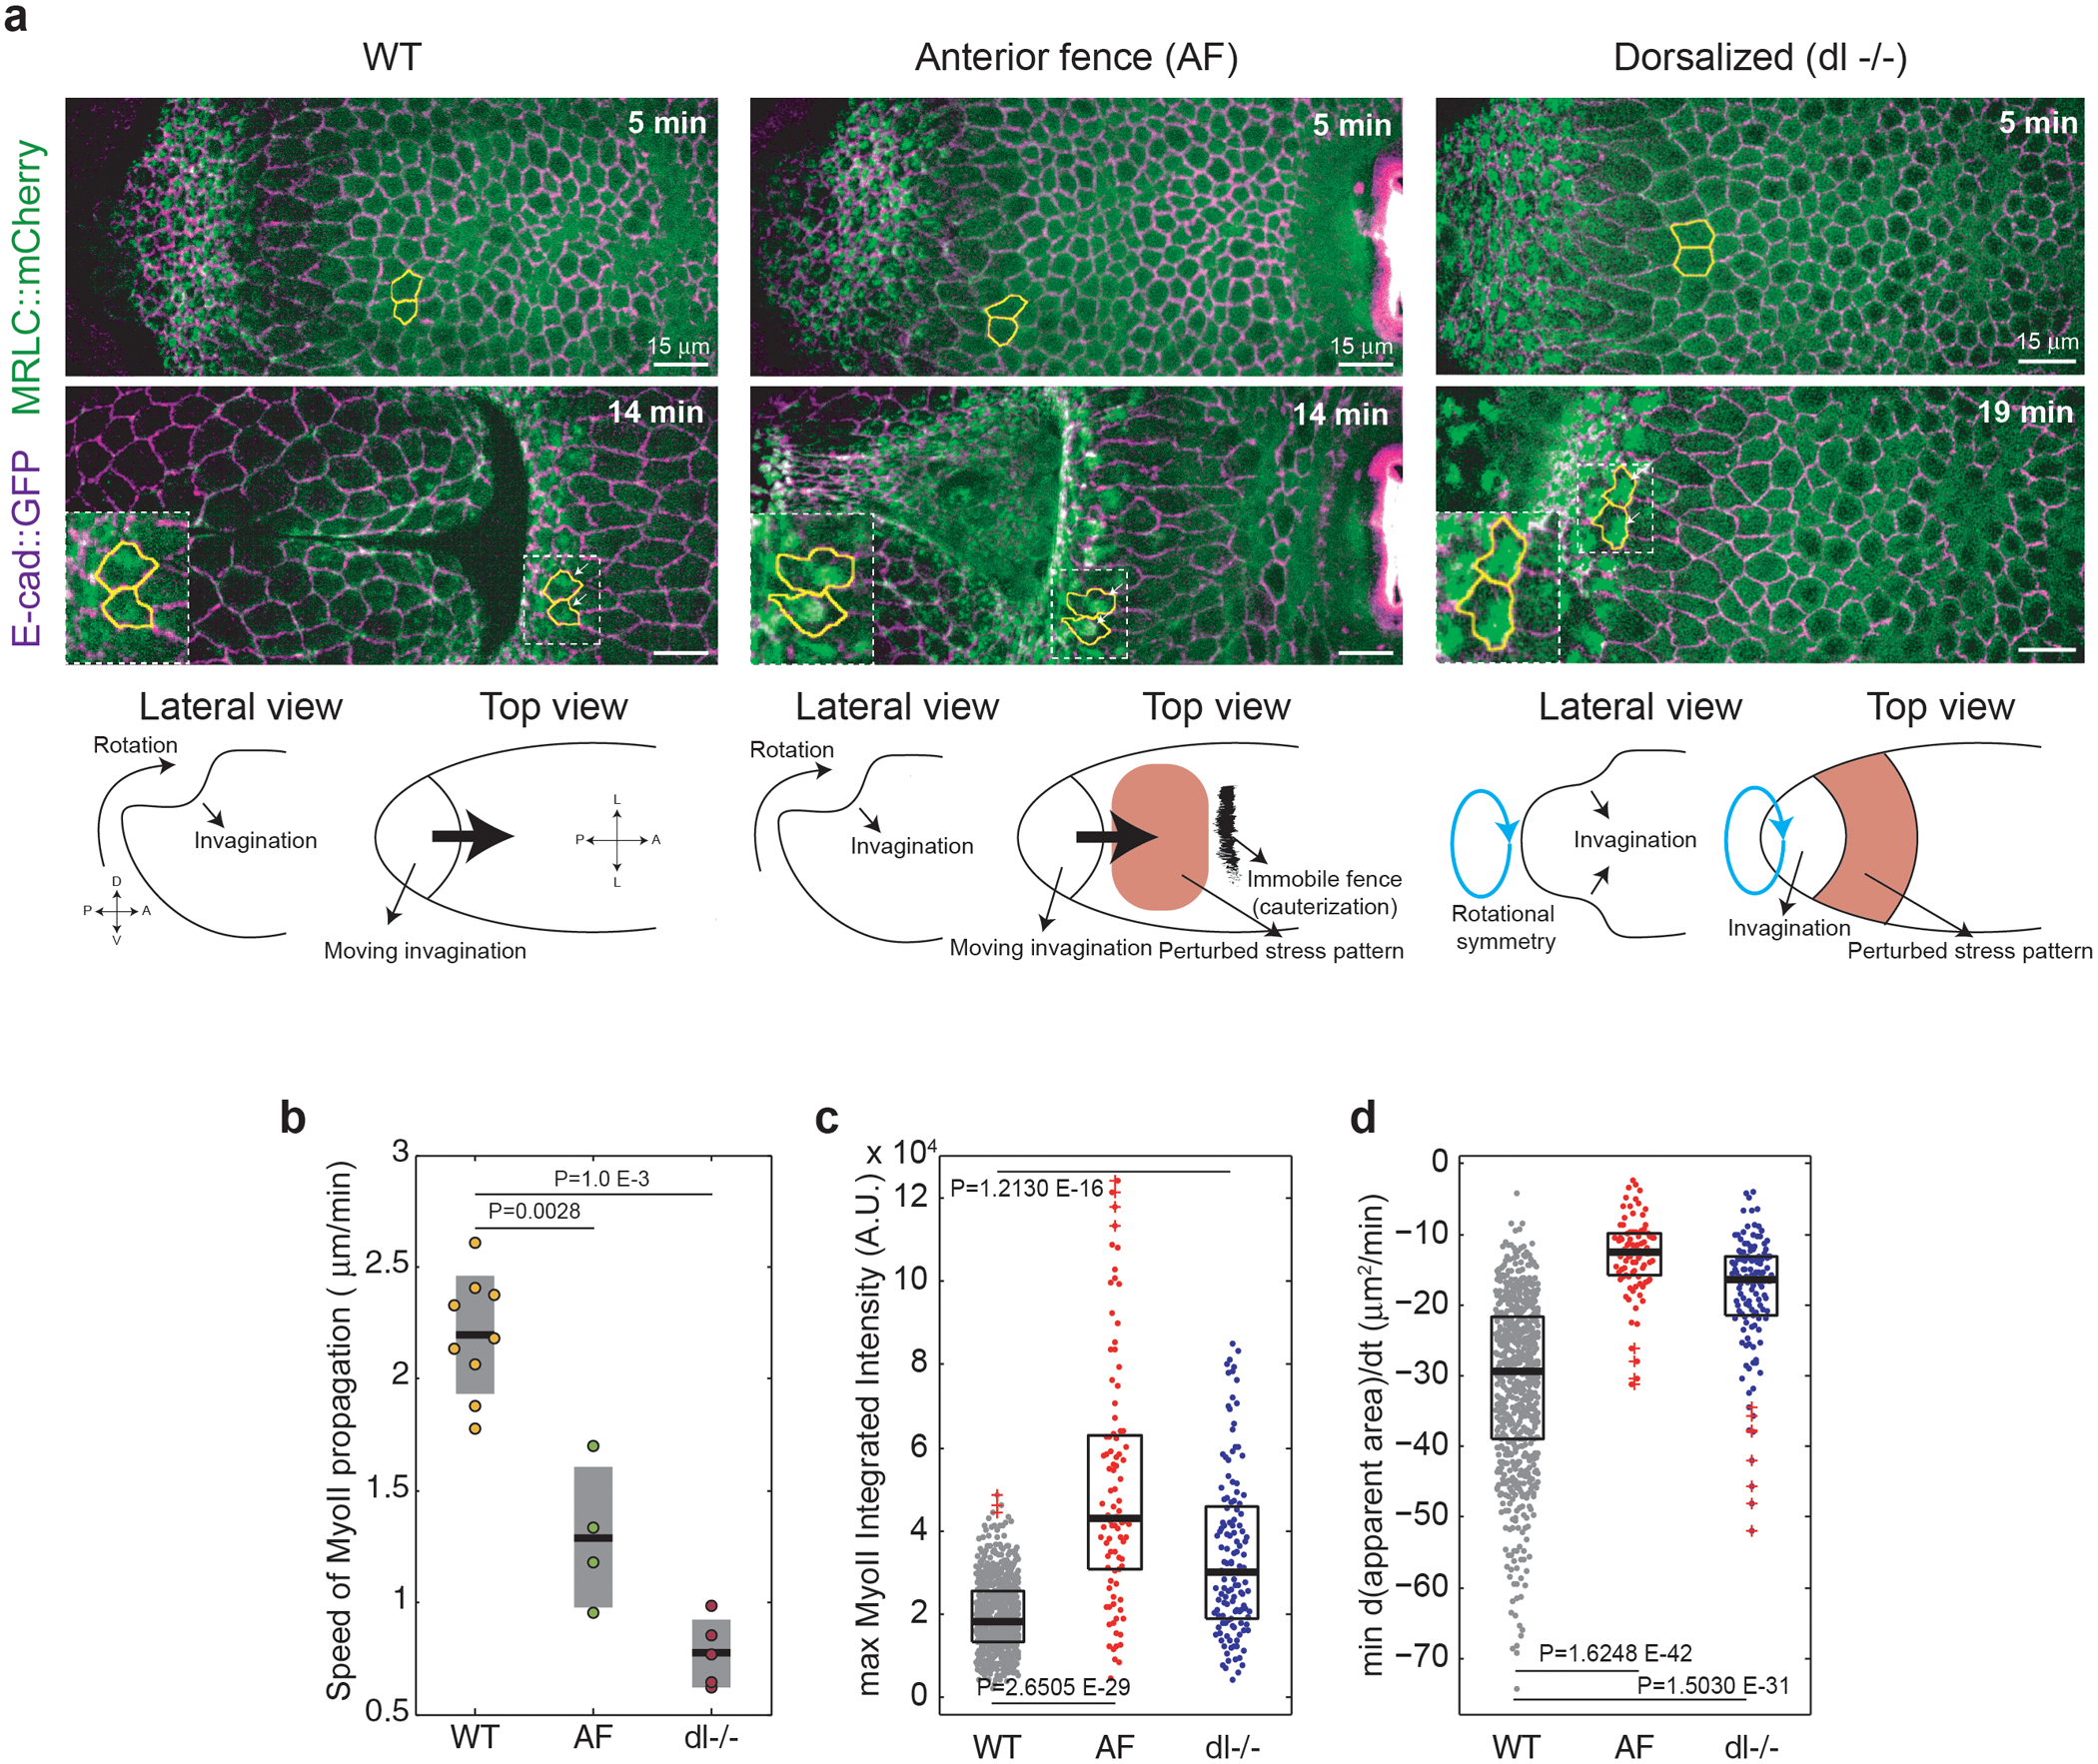
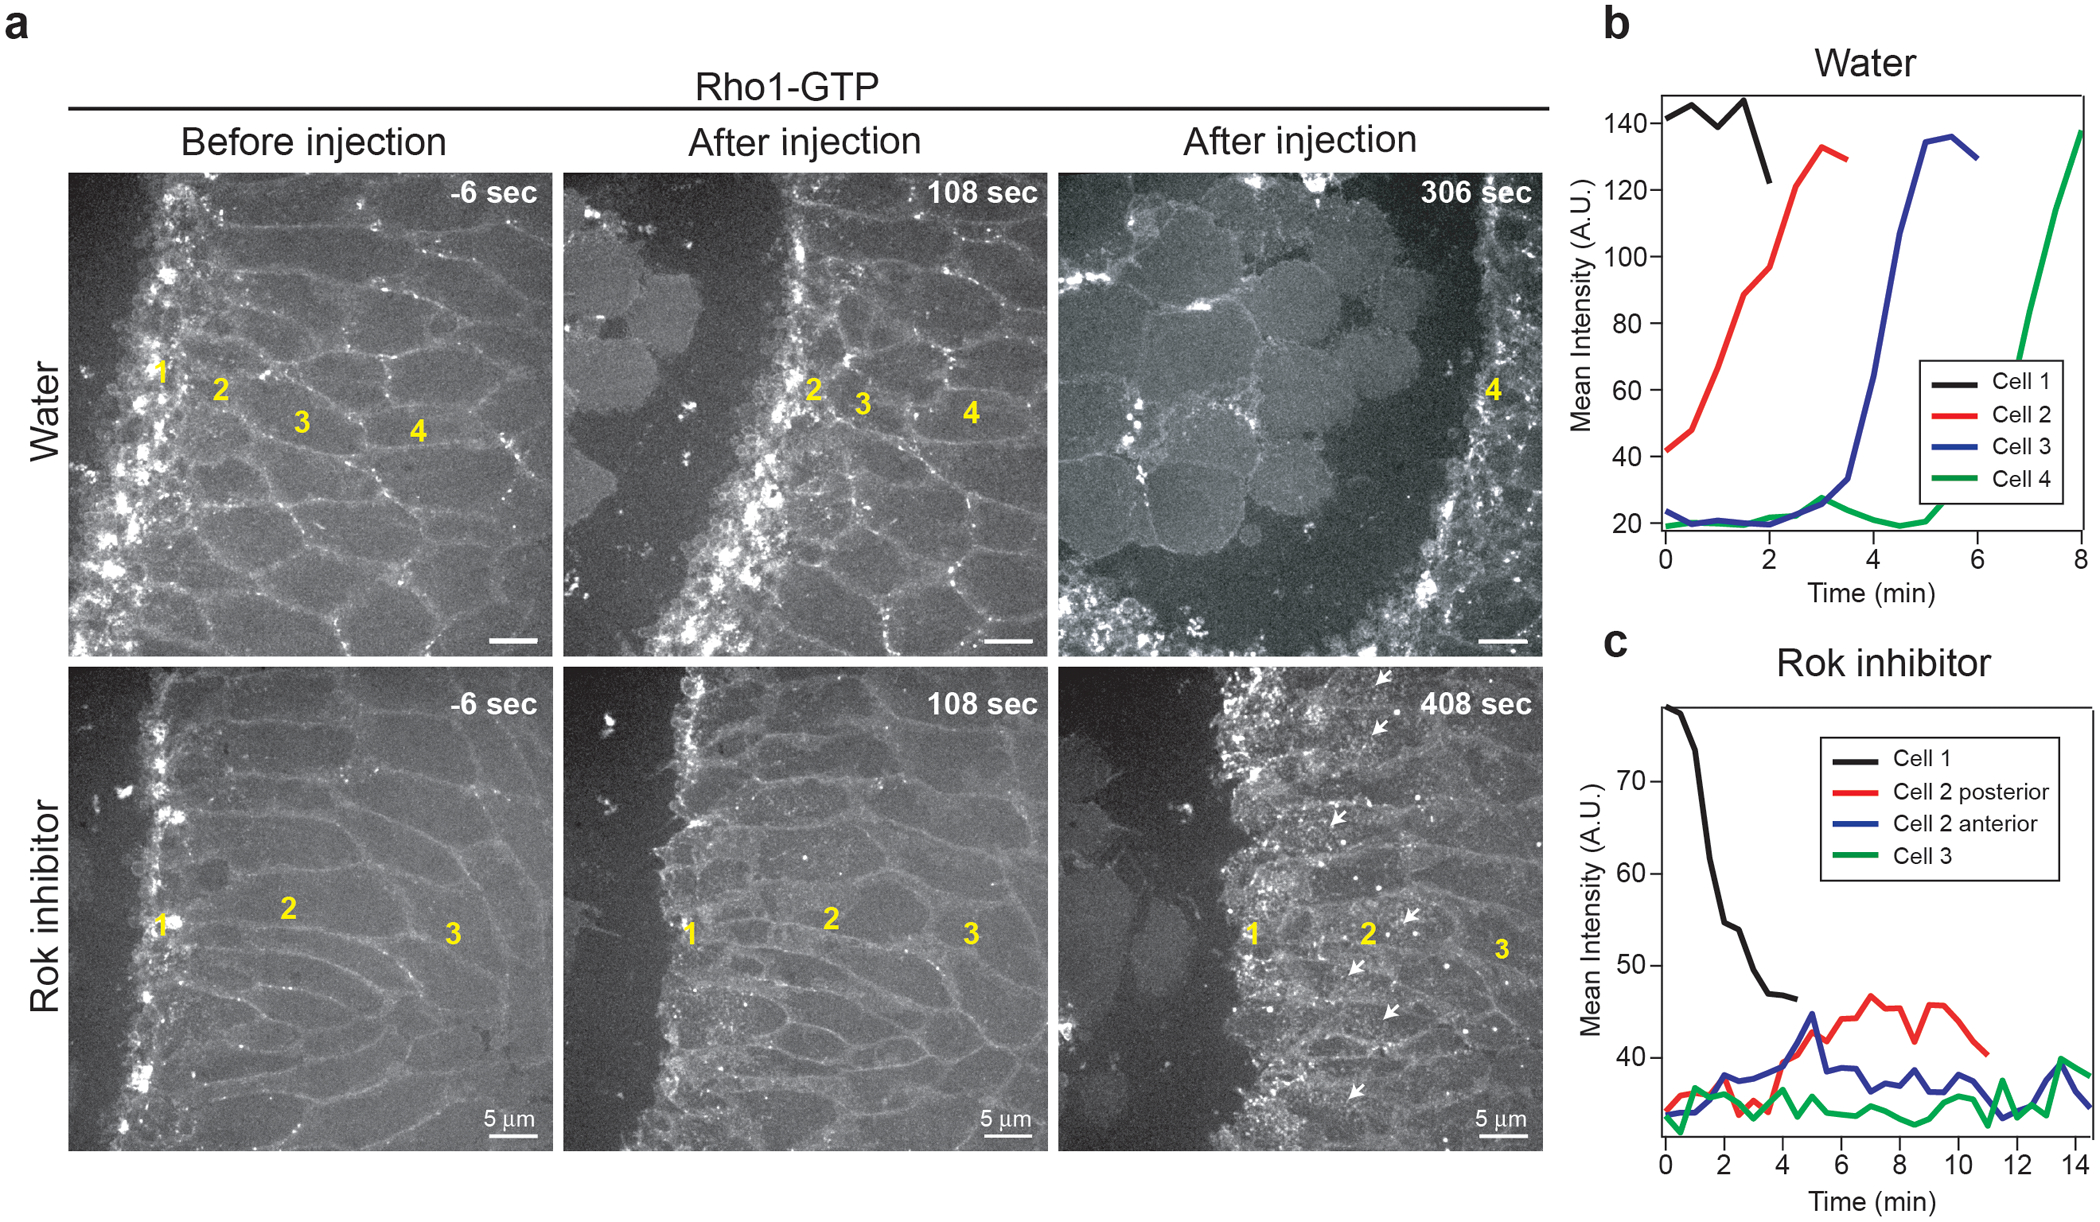
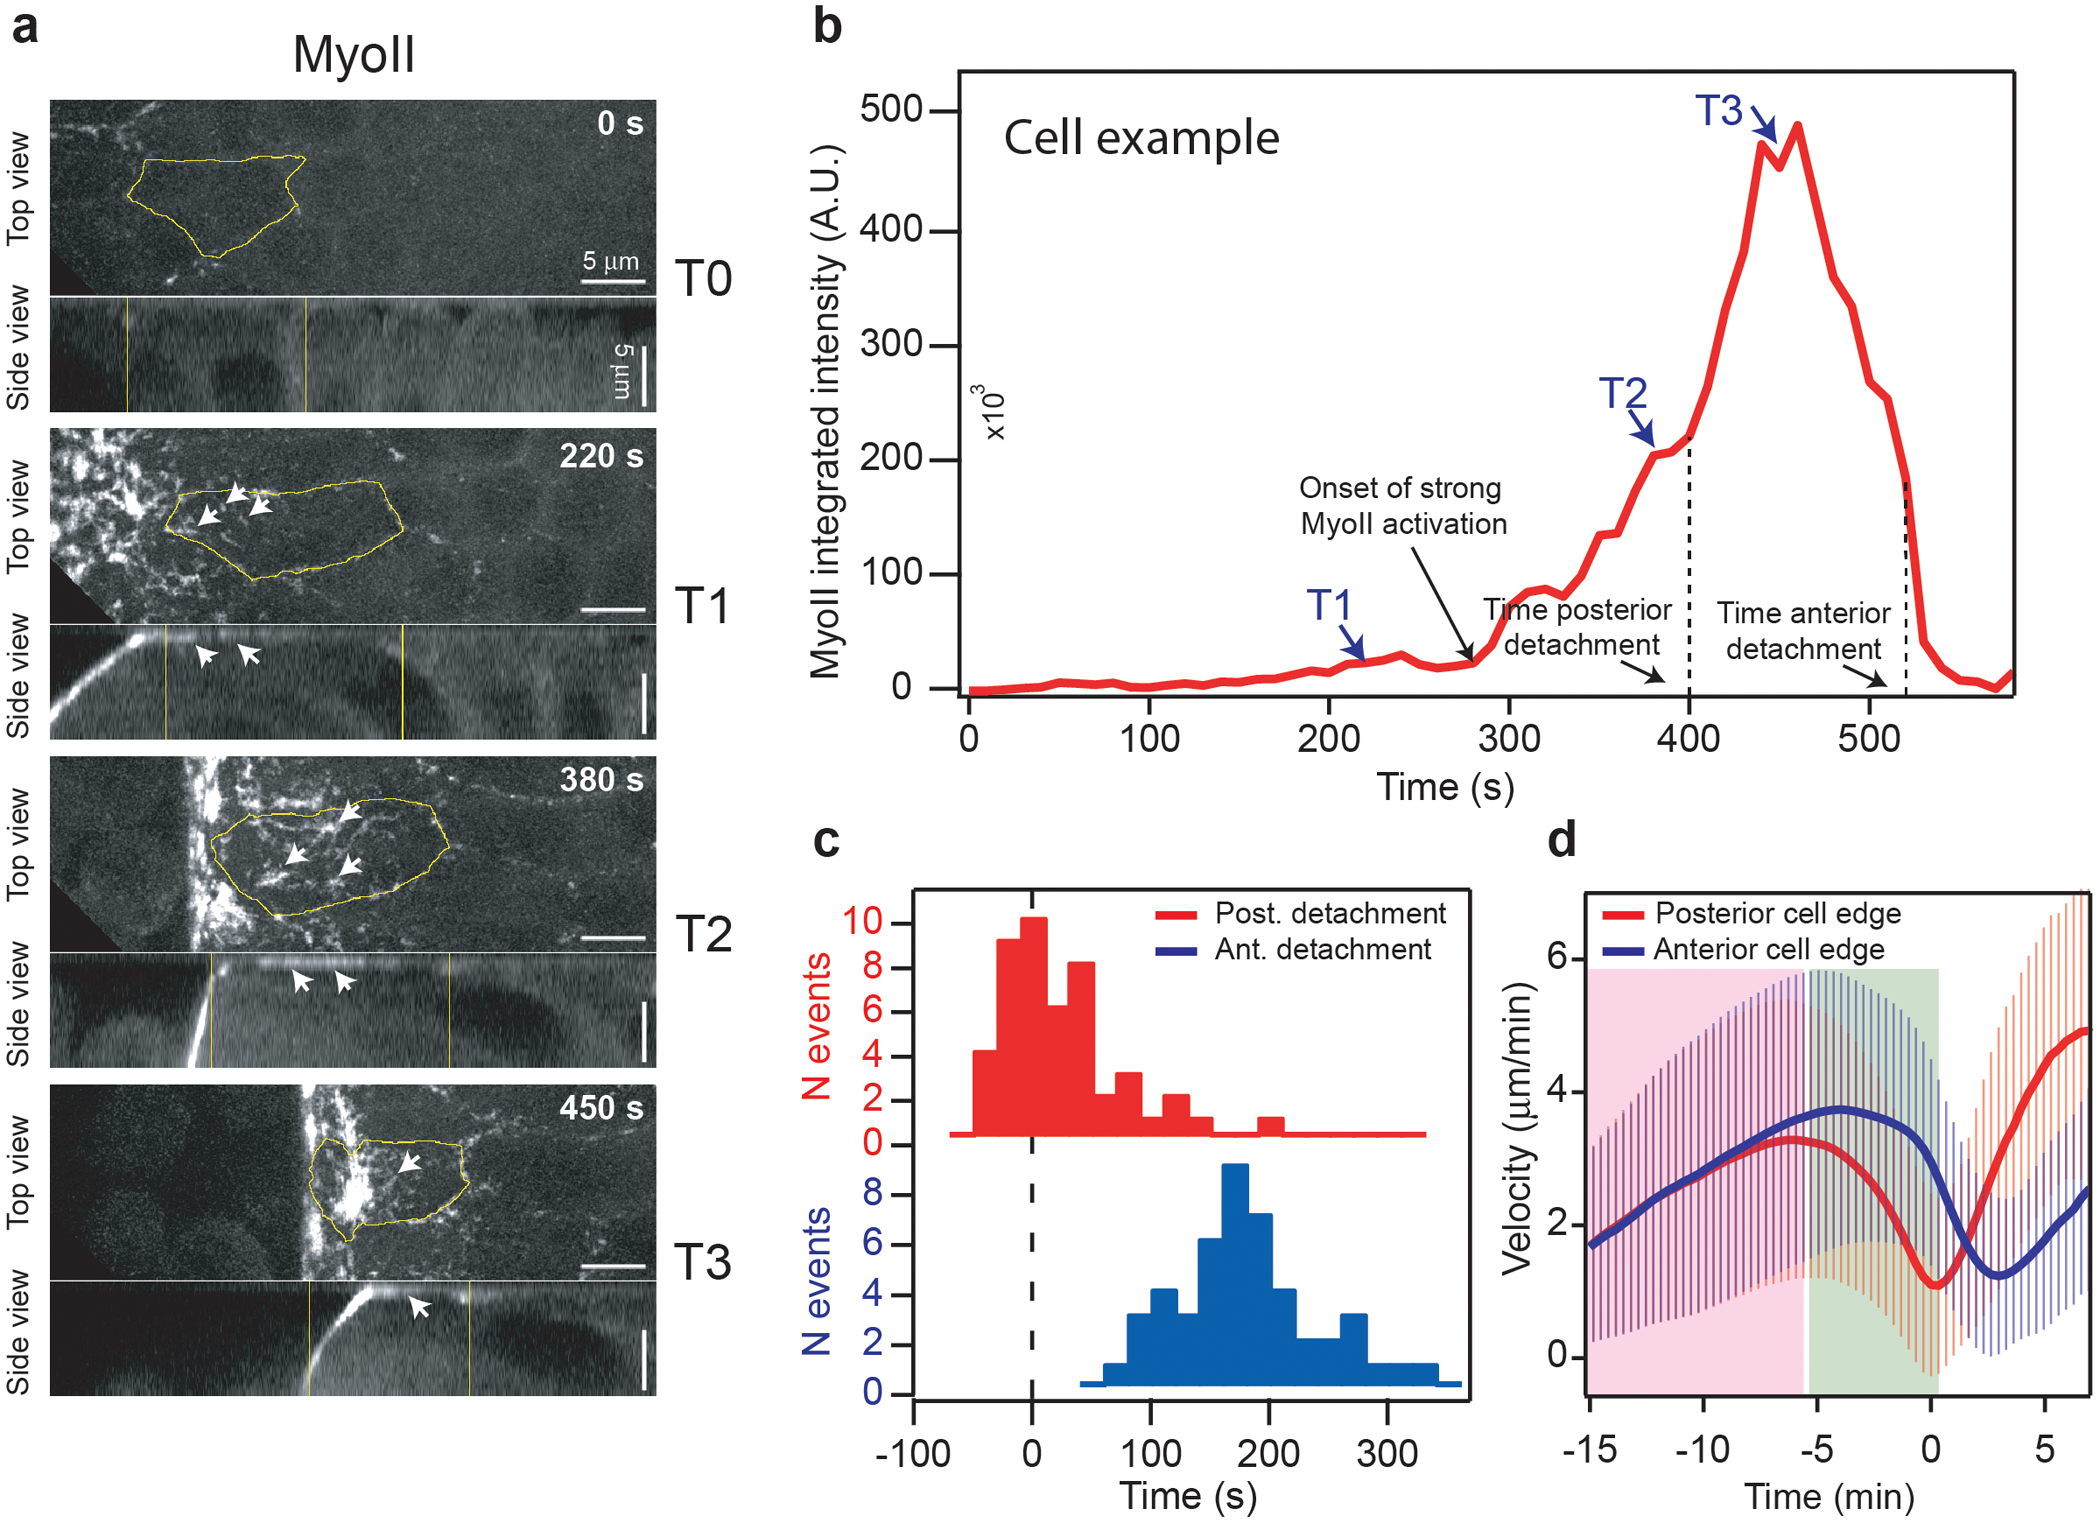
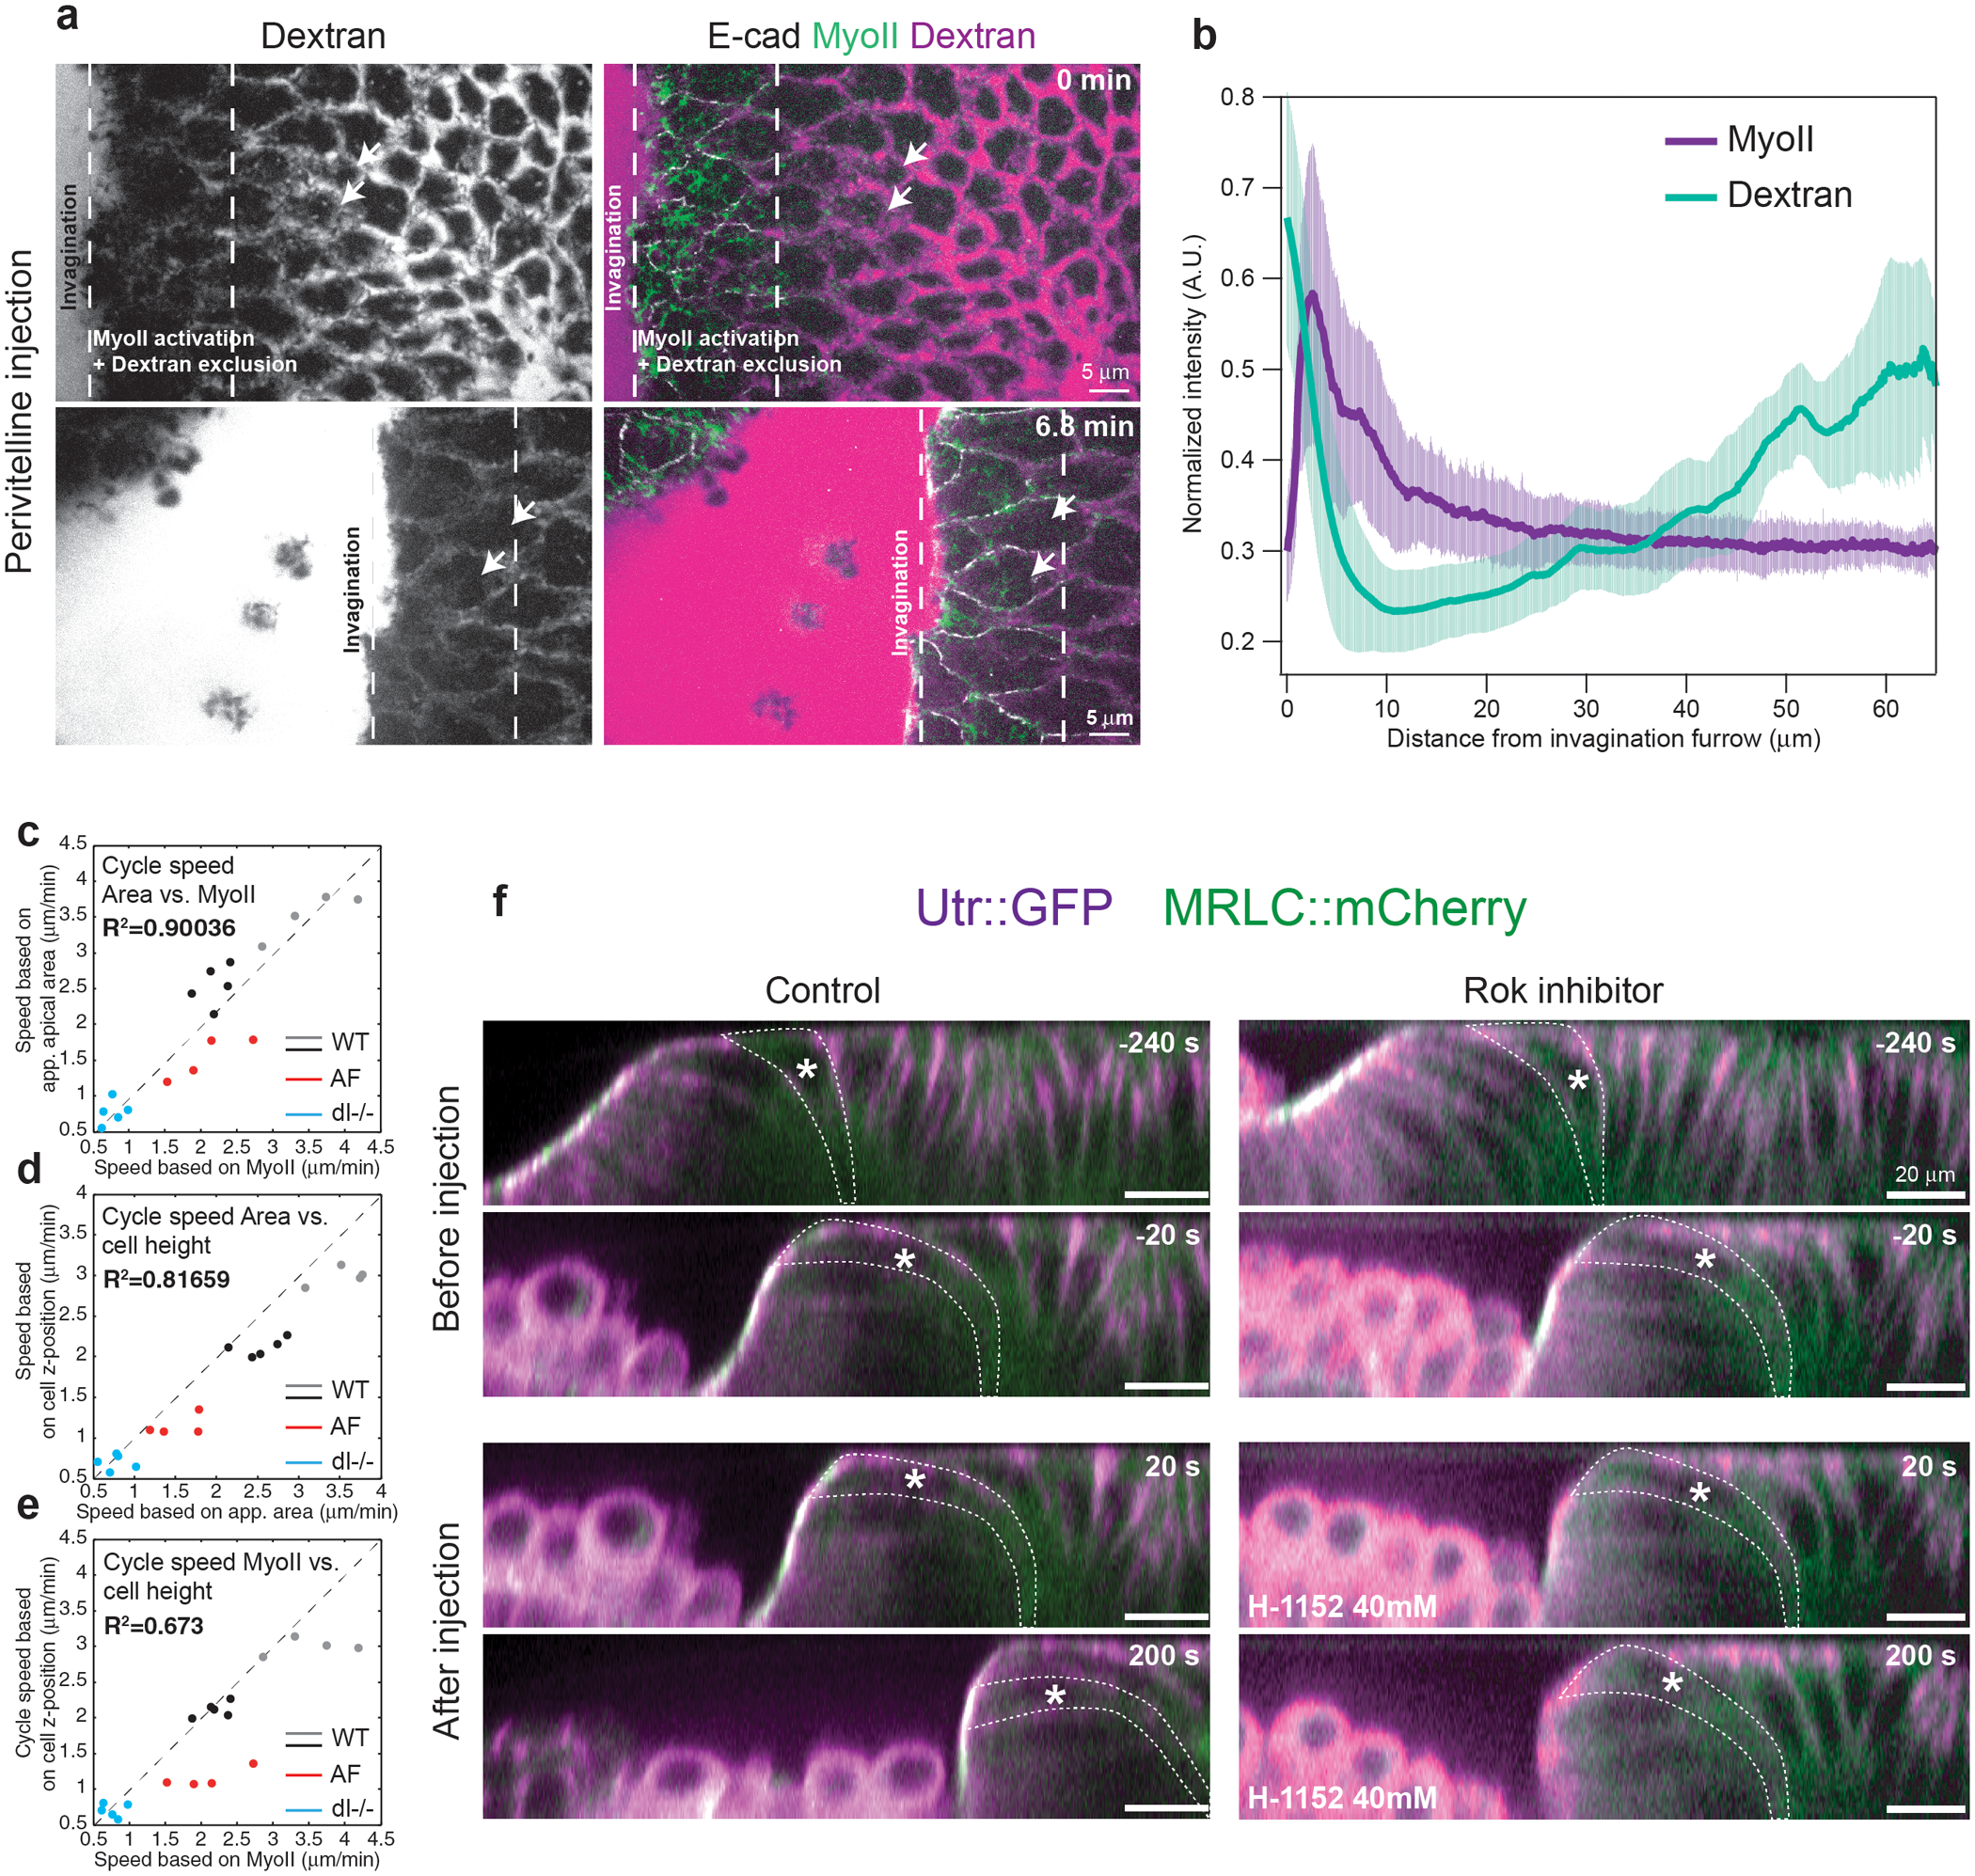
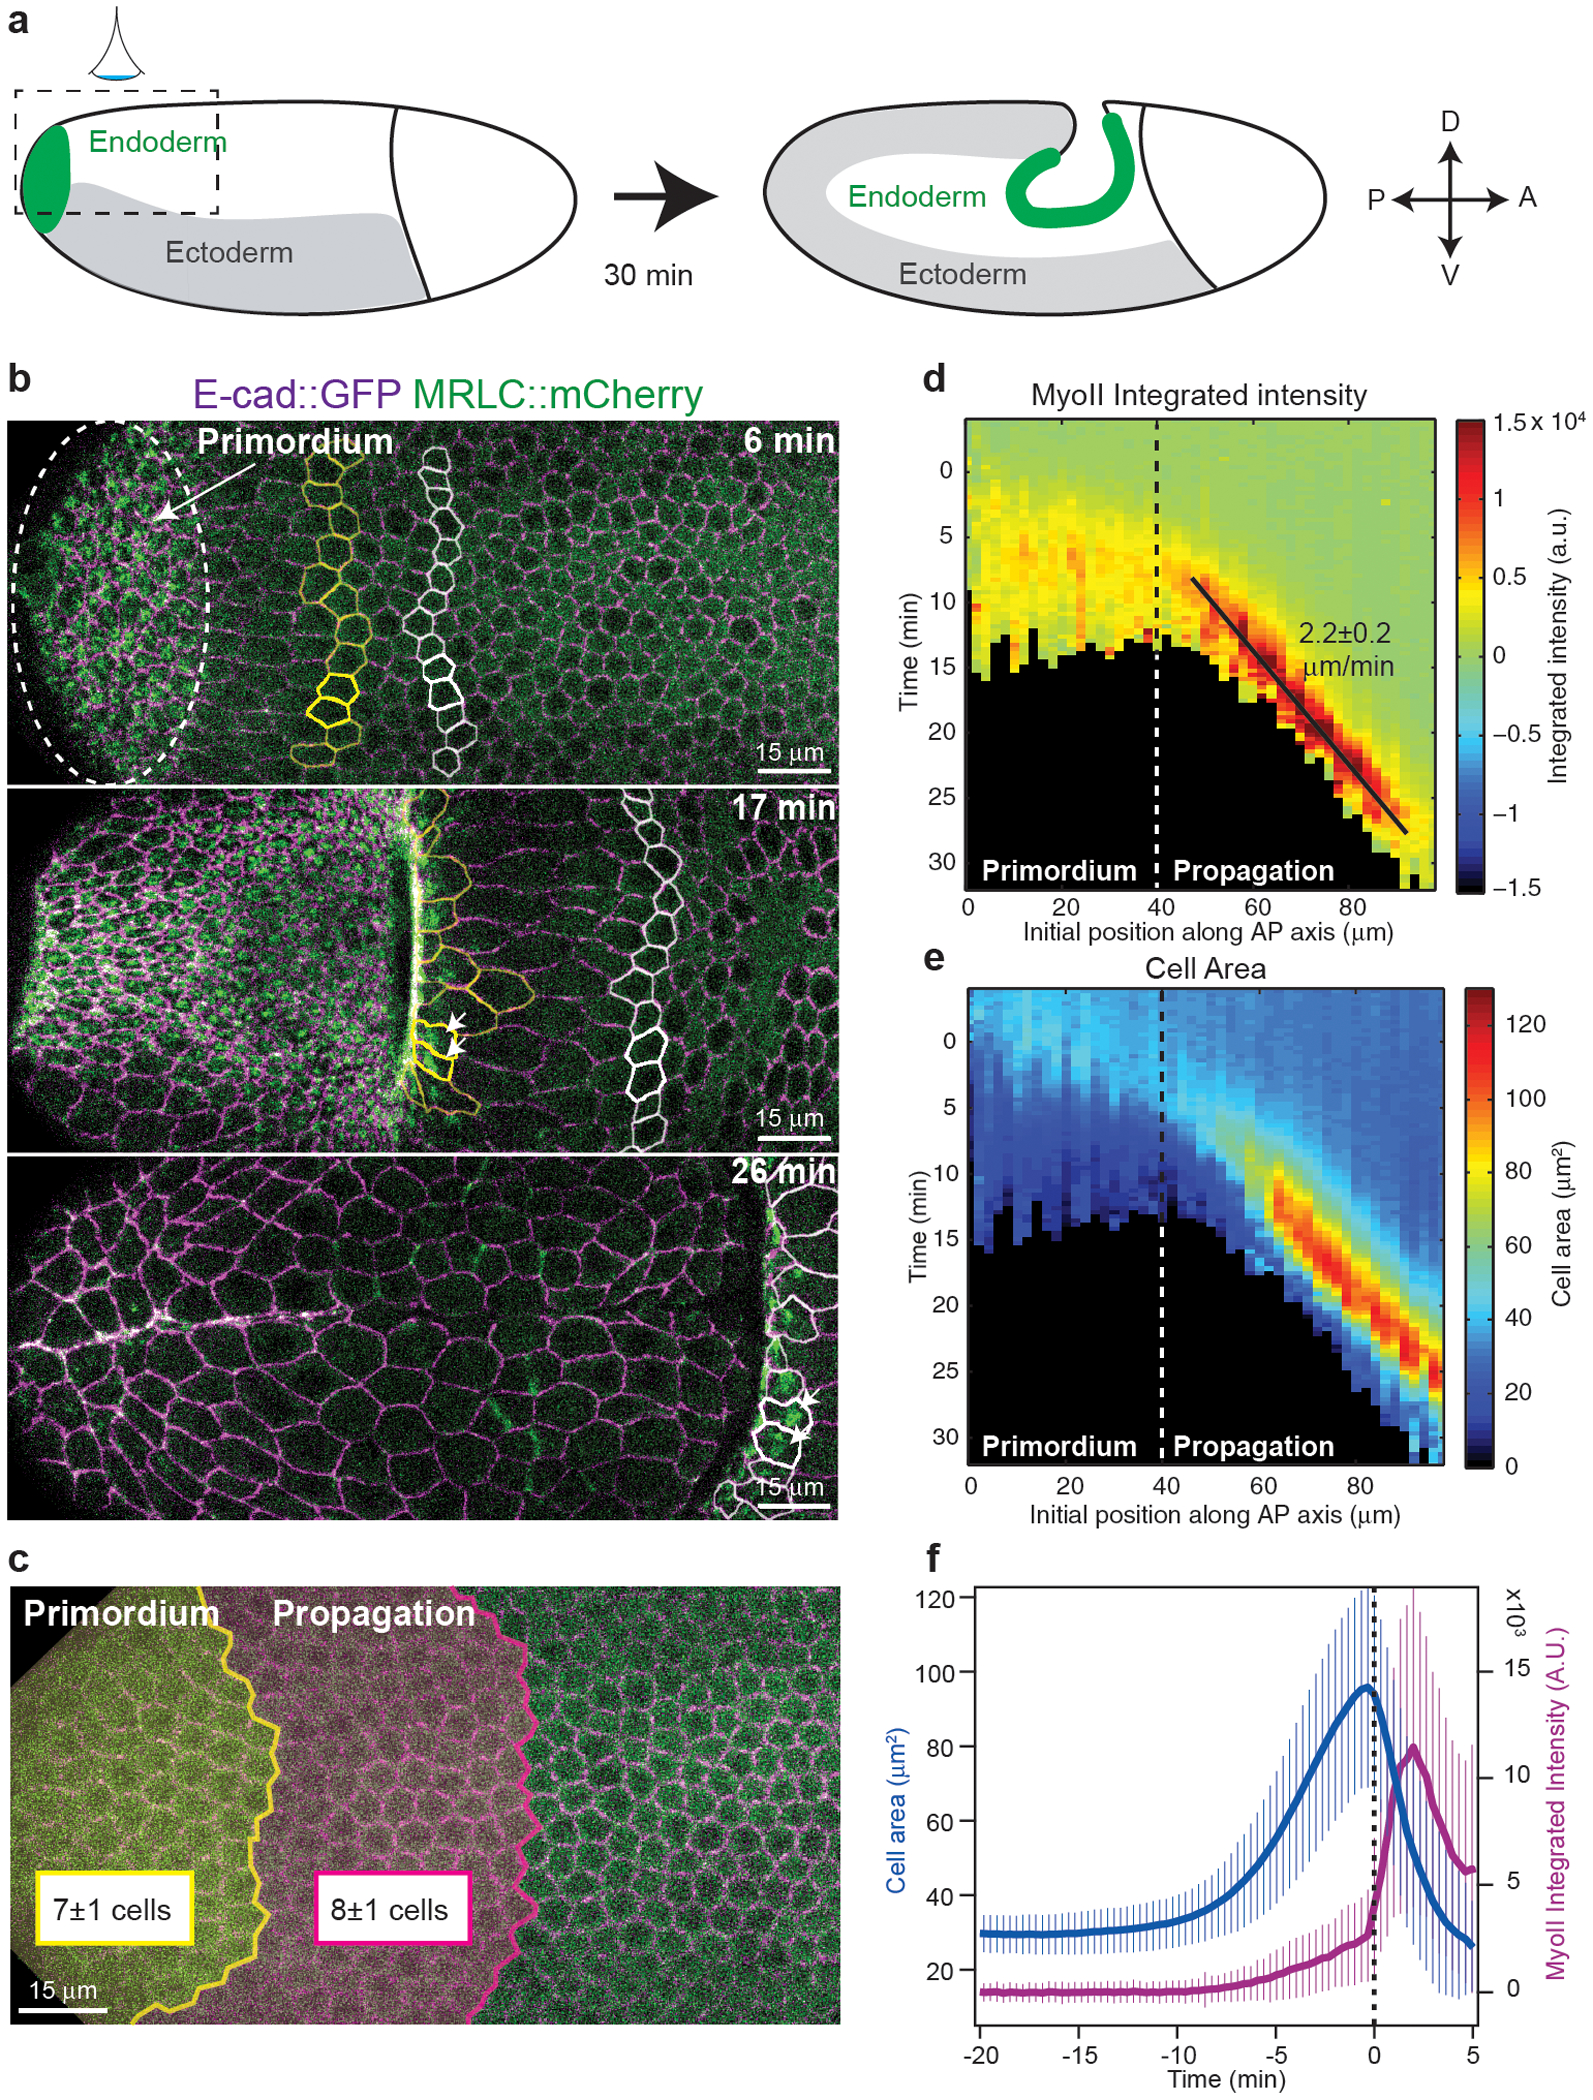
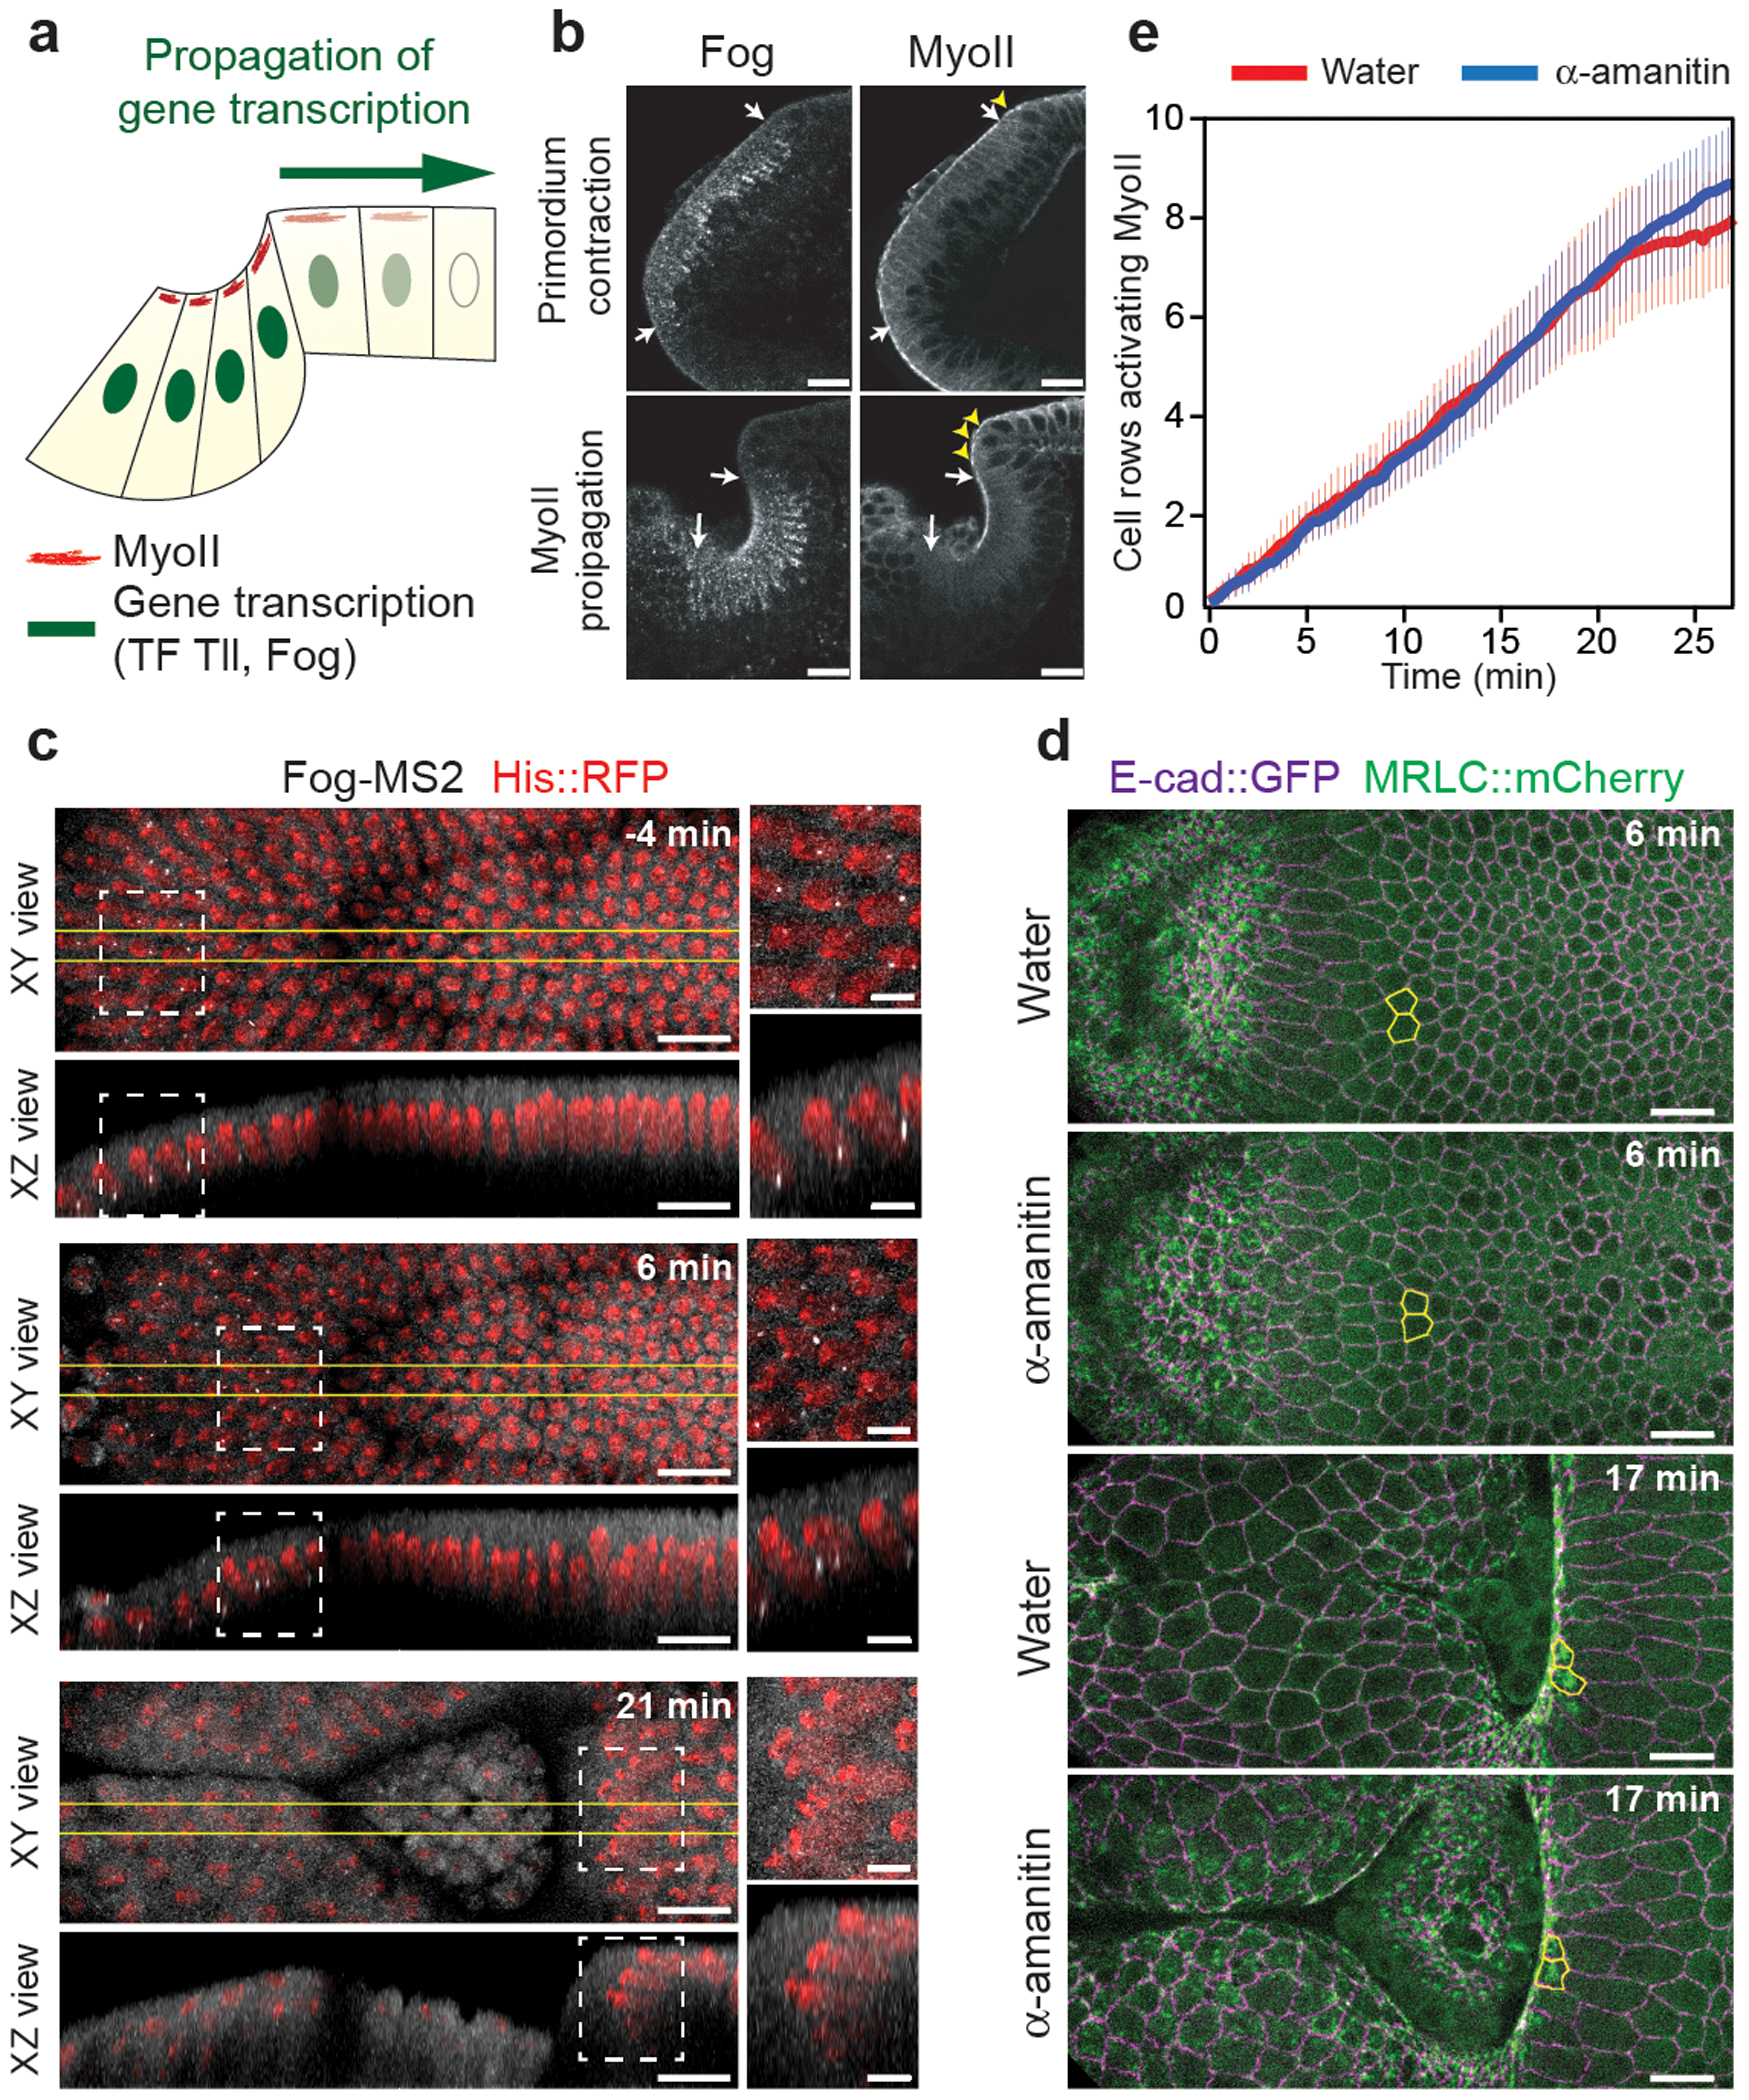
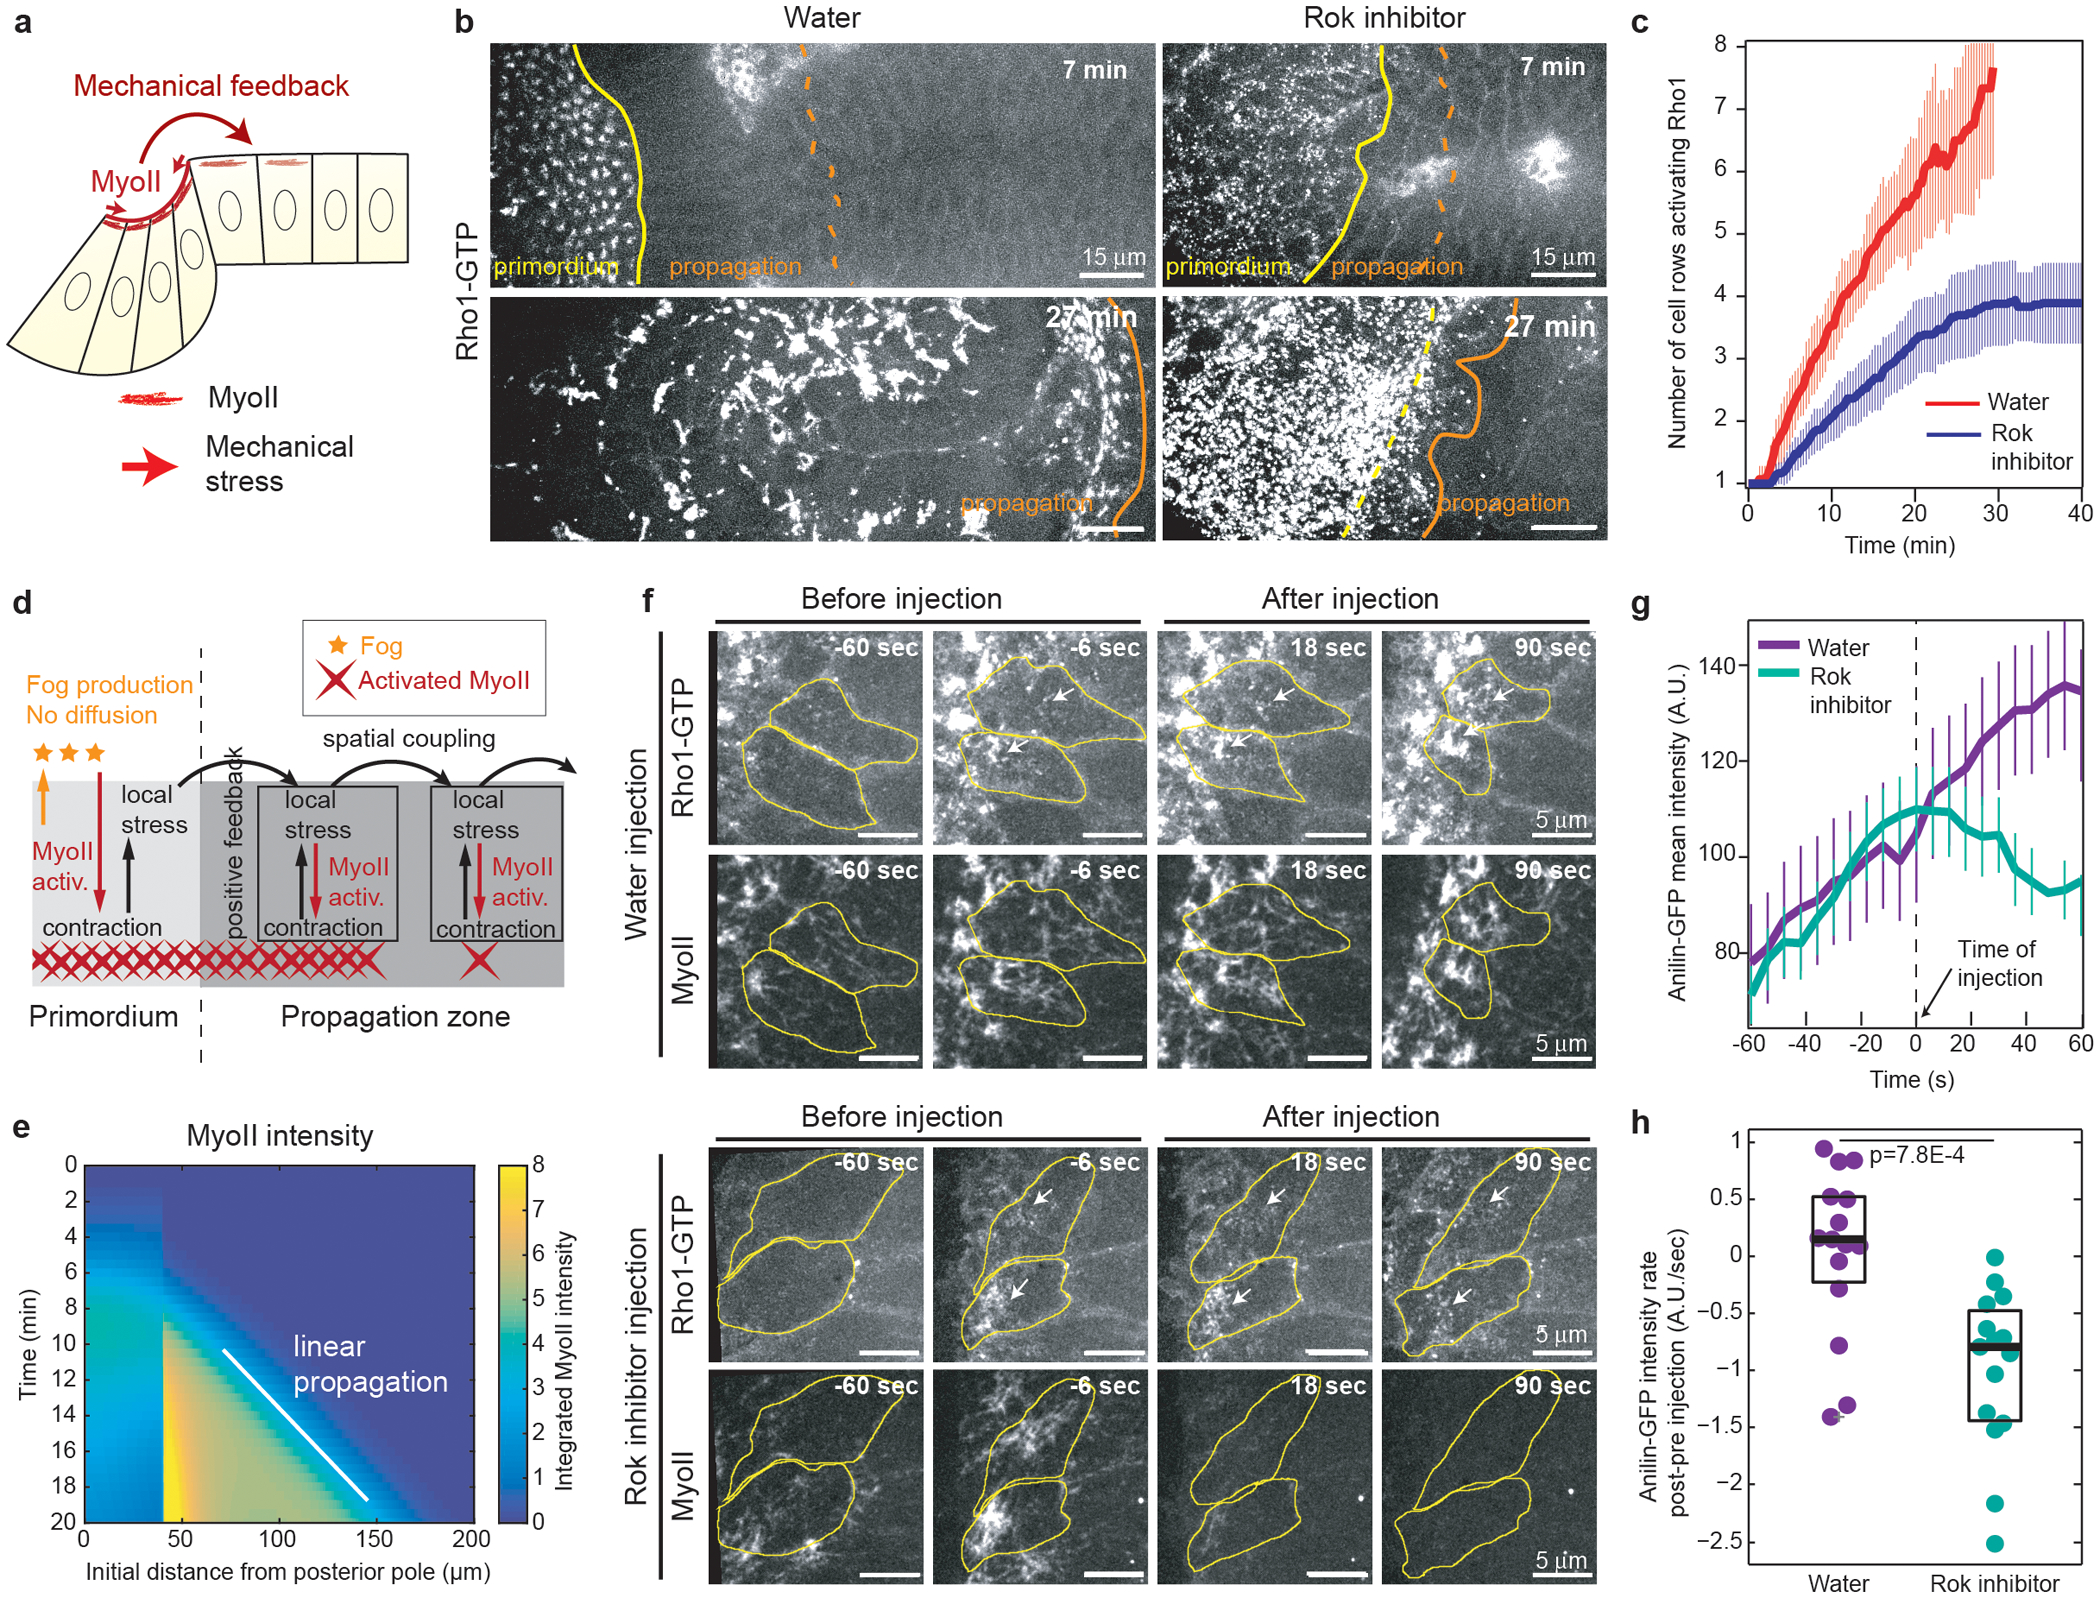
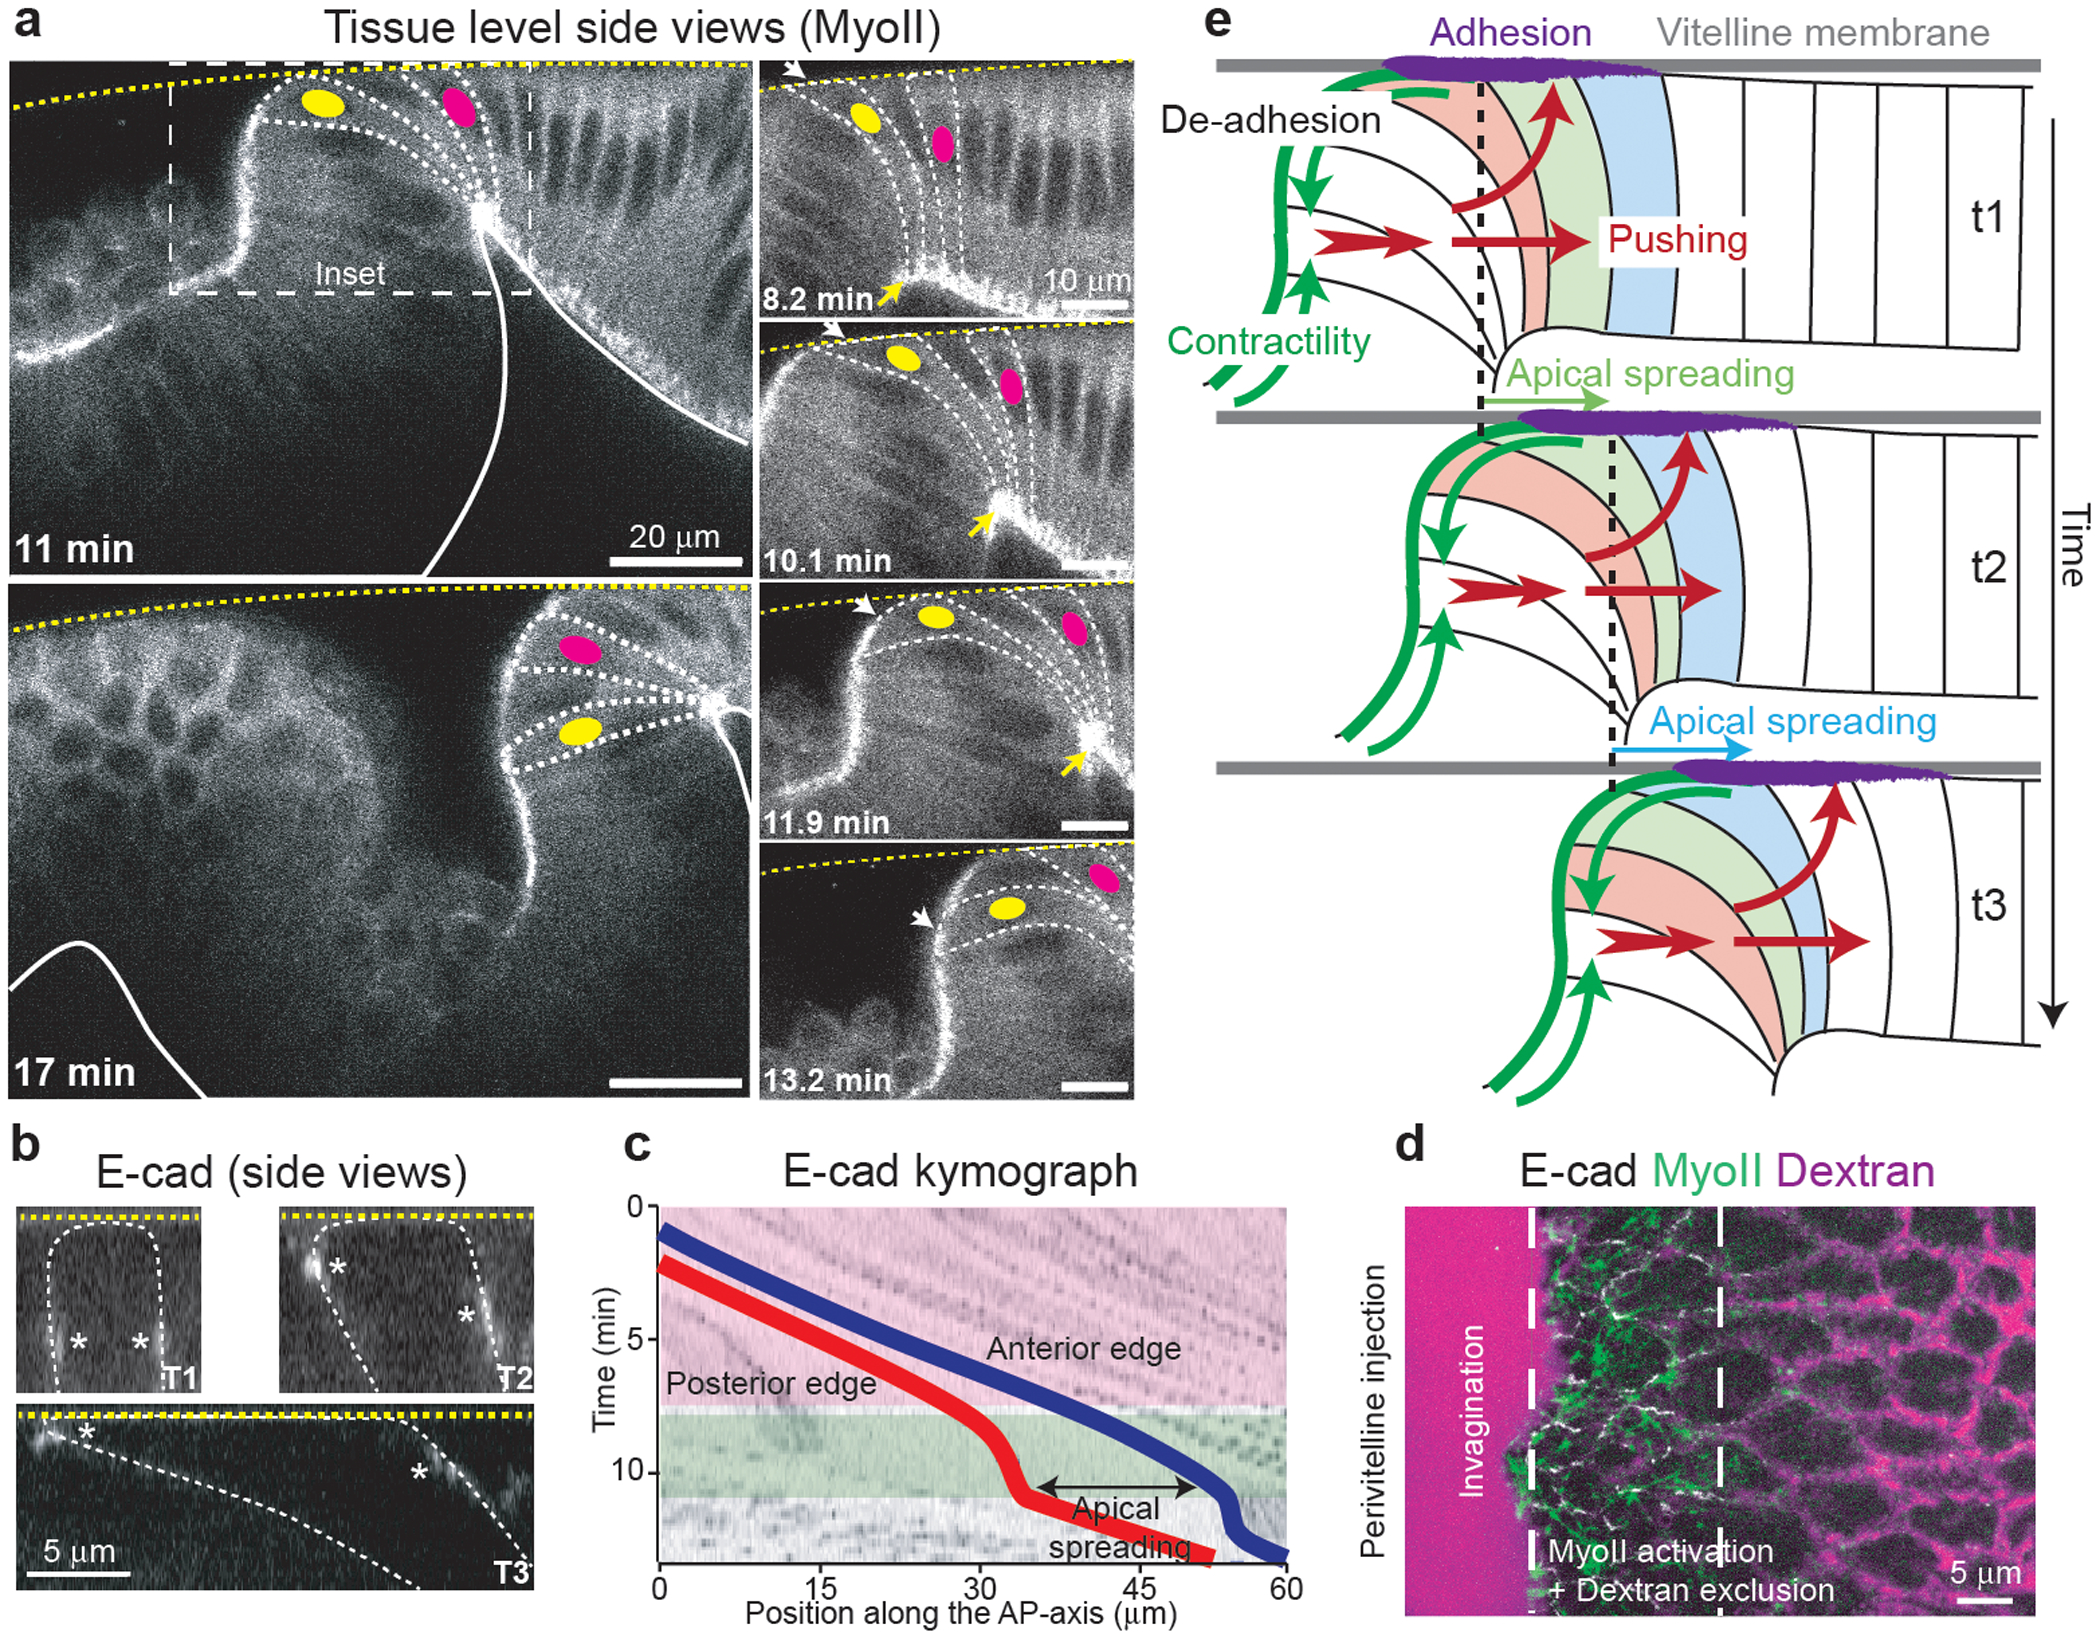
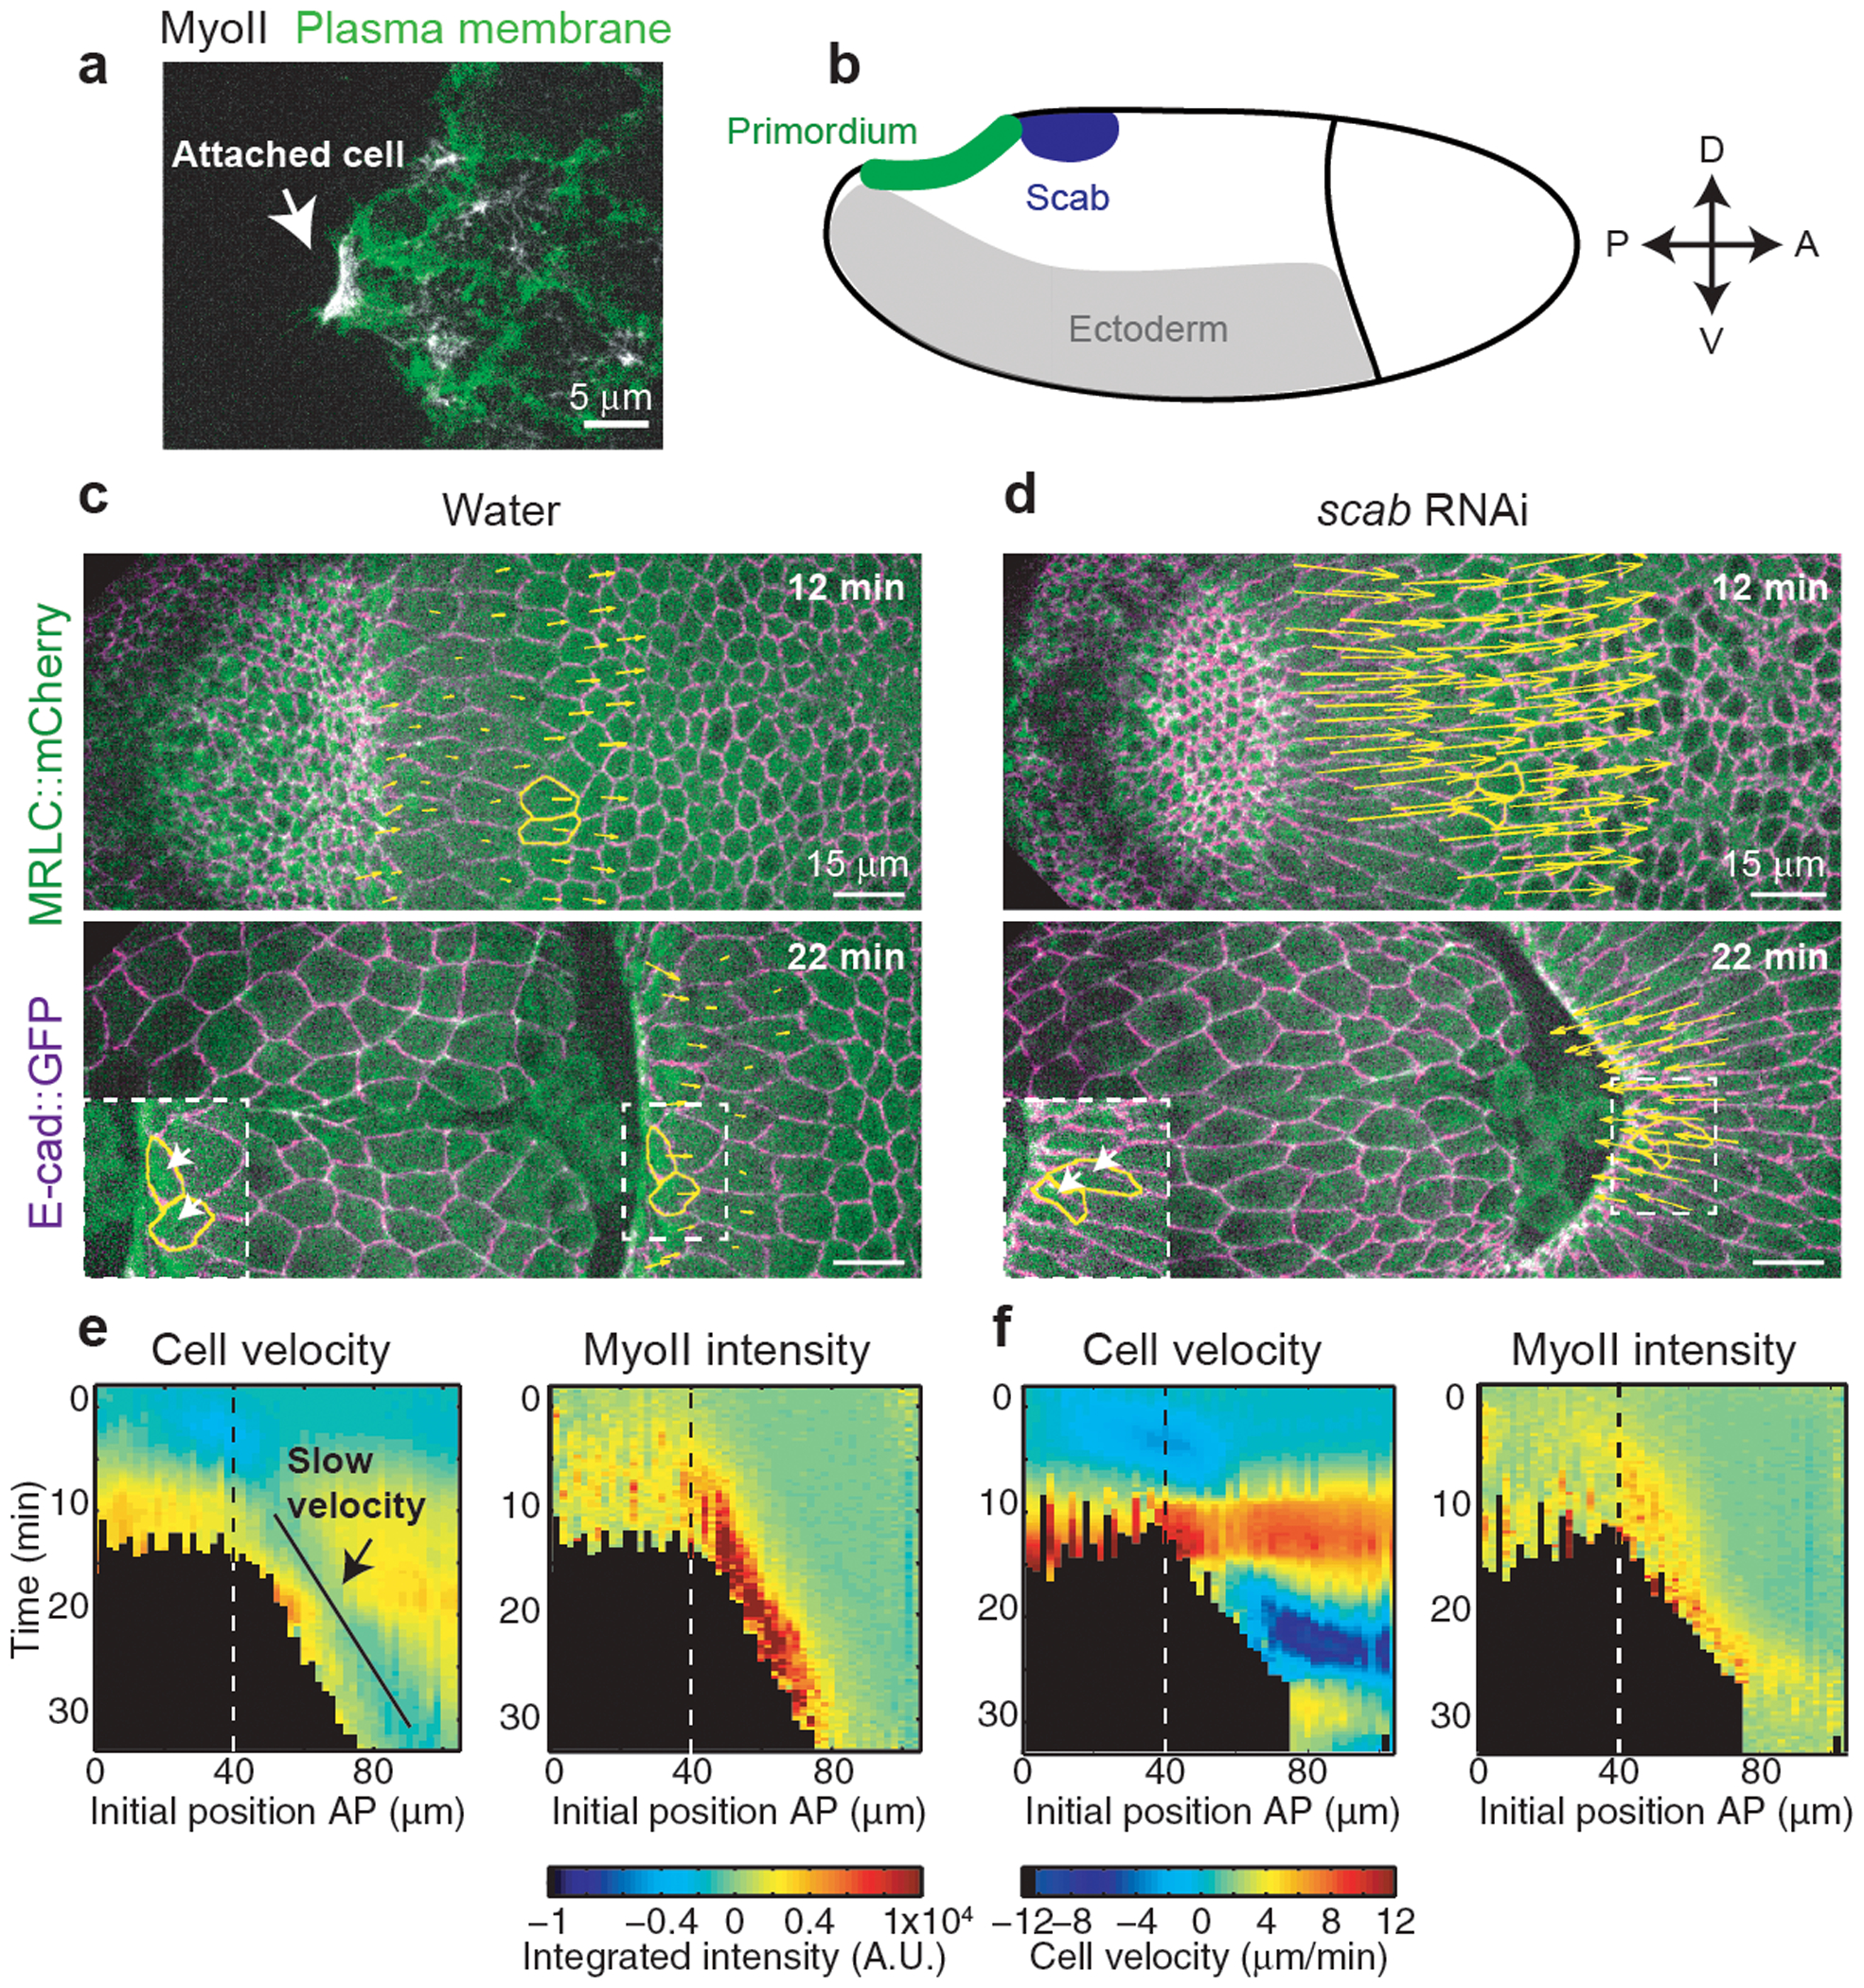
Tissue morphogenesis arises from coordinated changes in cell shape driven by actomyosin contractions. Patterns of gene expression regionalize cell behaviours by controlling actomyosin contractility. Here we report two modes of control over Rho1 and myosin II (MyoII) activation in the Drosophila endoderm. First, Rho1-MyoII are induced in a spatially restricted primordium via localized transcription of the G-protein-coupled receptor ligand Fog. Second, a tissue-scale wave of Rho1-MyoII activation and cell invagination progresses anteriorly away from the primordium. The wave does not require sustained gene transcription, and is not governed by regulated Fog delivery. Instead, MyoII inhibition blocks Rho1 activation and propagation, revealing a mechanical feedback driven by MyoII. We find that MyoII activation and invagination in each row of cells drives adhesion to the vitelline membrane mediated by integrins, apical spreading, MyoII activation and invagination in the next row. Endoderm morphogenesis thus emerges from local transcriptional initiation and a mechanically driven cycle of cell deformation.


Conflict of interest statement

The authors declare no competing financial interests.

Figures

Extended Figure 1.
Extended Figure 1.. Quantification of the morphogenetic wave within the dorsal posterior epithelium:
(a-d) Procedure to generate kymograph heat-maps from time-lapses of endoderm morphogenesis. In a stills of a dual color time-lapse, E-cad∷GFP is in magenta and MyoII is in green. (b) A kymograph generated along the yellow horizontal line in a. A single cell, highlighted in yellow, first moves towards the anterior and then increases its projected apical area before recruiting MyoII. Solid yellow lines: time of the stills in a, dashed vertical line: the position of the cell at time t0. (c) Kymograph heat-map of MyoII integrated intensity measured using cell tracking in a. Data are averaged along the ML axis within the white dashed line box in a and cell positions are the positions at time t. Note that cell tracks display movements similar to the kymograph in b. (d) Kymograph heat-map of MyoII integrated intensity registered on the cell positions at time t0 extracted from cell tracking in a. Data are averaged along the ML axis, as in c, but now each cell track is plotted according to its position along the AP axis at time t0. Cell tracks do not display any movement and appear as straight vertical lines. As a result tissue deformation is not considered and the movement of the wave across the tissue can be visualized. Time t0 is the onset of endoderm morphogenesis. (a-d) N=1 embryo for demonstration purposes. (e-f) Kymograph heat-maps of AP apical cell projected length (e) and cell aspect ratio (f). The primordium and propagation regions are indicated. N=947 cells from 5 embryos. (g) Representation of the bending angle θ in a lateral view from a tracked cell (yellow contour) (see Methods). (h) Average time traces of the corrected area (see Methods) and MyoII integrated intensity. Cells are registered on t0 the time of MyoII activation. The corrected area decreases when MyoII intensity increases indicating that cells are truly constricting. (i) Time trace of the relative error in the measurement of cell area (i.e. underestimation of the real cell area) due to the bending angle. (g-i) N=24 cells, 1 embryo, with θ measured automatically (Method 1, see Methods) on MyoII side views. Mean±SD are shown.
Extended Figure 2.
Extended Figure 2.. MyoII activation in cells of the primordium and propagation regions occurs differently:
(a) Close ups of cells in the primordium and propagation regions. (b) Projected apical cell area and MyoII integrated intensity of the cells in a. Yellow and green boxes: steps of MyoII recruitment in the primordium cell and the cell in the propagation region respectively. (c) MyoII recruitment rate in cells of the indicated regions (N=288 cells for primordium and 456 cells for propagation region, 6 embryos). Boxplots show the median, the 25th and the 75th percentiles. The grey crosses label outliers. P=5.1E-58 from a two-sided Mann-Whitney test.
Extended Figure 3.
Extended Figure 3.. Rho-GTP and Rok propagate together with MyoII during the wave:
(a and c) High resolution stills of cells in the propagation region labeled with MyoII and with the Rho1-GTP sensor, Anillin(RBD)∷GFP (N=4 embryos) (a), and RokKD∷GFP (N=4 embryos) (c). Cell contours are in yellow. (b and d) Curves of Rho1 sensor (b) and Rok (d) mean intensity over time along with MyoII in one representative cell of the propagation region. Intensity values are normalized to the max of each curve for visualization purposes. In the insets, scatter plots of MyoII mean intensity vs Rho1 sensor mean intensity (b) or Rok mean intensity (d) from ~10 cells in the embryo shown in (a) and ~7 cells in the embryo shown in (c) (see Methods). In the insets in b and d R2 is the square of the Pearson correlation coefficient. In a-d t0 is artbitrary.
Extended Figure 4.
Extended Figure 4.. Terminal patterning controls MyoII activation in the posterior endoderm:
(a) Schematics of the terminal patterning-dependent pathway controlling MyoII activation in the posterior endoderm. (b) MyoII activation in the posterior endoderm in embryos mutant for torso (mat tor−/−), depleted of maternal and zygotic fog (fog RNAi) and mutant for the Gα12/13 concertina (mat cta−/−). Yellow contours mark cells in the propagation region. N=5 embryos for WT, 4 for mat tor−/−, 5 for fog RNAi and 5 for mat cta-/−. (c) Sagittal sections of embryos immunostained for Fog and Tll (together with the membrane marker Neurotactin in the merge) at different stages of posterior endoderm morphogenesis. The white and green lines indicate the boundaries of the expression domains of fog and tll respectively. N=8 embryos for primordium contraction stages and 5 embryos for MyoII propagation stages from 1 independent experiment in this configuration.
Extended Figure 5.
Extended Figure 5.. MyoII propagation does not depend on gene transcription:
(a) fog expression in the posterior endoderm visualized with the MS2-MCP system along with MyoII in living embryos. Top and side views are shown for the indicated time points. White dashed boxes indicate the positions of the close-ups on the right and the yellow lines the region where side-views were generated. fog is expressed in the primordium but not in the propagation zone. N=4 embryos. (b) Stills of a control (water) and α-amanitin injected embryo at a late stage of invagination. Asterisks indicate dividing cells (ROI1) and arrowheads elongated cells in the posterior-ventrolateral ectoderm. Elongated cells in the ectoderm are a hallmark of cell stretching typical of conditions where cell intercalation is affected,,. N=11 for water and N=10 for α-amanitin injected embryos.
Extended Figure 6.
Extended Figure 6.. Fog diffusion does not control MyoII wave propagation:
(a) Hypothesis of secreted Fog diffusion from the primordium controlling MyoII propagation. (b) Apical views of embryos stained for Fog and MyoII at primordium contraction and late propagation stages during endoderm morphogenesis. N=7 embryos for primordium contraction from 1 independent experiment and N=17 embryos for propagation stage from 2 independent experiments. (c) Quantifications of Fog mean intensity in the propagation zone and in the dorsal epithelium. Individual embryos data points are superimposed to box plots. Box plots: black line mean, grey box s.d.. N=17 embryos. P=7.1E-7 from a two-sided Mann-Whitney test. (d) Model of Fog secretion, diffusion, receptor binding and MyoII activation (see Supplementary Information). (e) Position of MyoII activation front over time from one simulation of the model in b for the diffusion constant D, a given production rate (blue) and its double (red). (f) Time-lapse of MyoII in the indicated conditions. The boxes mark the primordium and the activated cells in the propagation region. N=4 embryos each. (g-h) MyoII integrated intensity in cells of the primordium (g, N=153 and 191 cells for WT and hkb-fog, from 4 embryos each) and in a 10μm-wide band of cells at ~30μm distance from the primordium at time 0 (h, N=69 and 67 cells for WT and hkb-fog, from 4 embryos each). Mean±SD between different embryos. (i) Maximum of MyoII integrated intensity in cells of the indicated conditions. Boxplots show median and 25th and 75th percentiles. Grey crosses label outliers. N is the number of cells from 4 embryos for each condition. P=1.2E-4 and P=0.0017 from a two-sided Mann-Whitney test. (j) Speed of MyoII propagation in the reference frame of the microscope. Box plots: black line mean, grey box s.d.. N=4 embryos each. N.S. indicates a P=1, two-sided Mann-Whitney test.
Extended Figure 7.
Extended Figure 7.. Patterned Fog signaling does not control MyoII wave propagation:
(a) MyoII pattern in embryos where Fog (UAS-Fog), a constitutively active Gα12 (UAS-Gα12[CA]) and Rho1 (UAS-Rho1[CA]) are expressed uniformly. Yellow and orange lines: the limits of the primordium and propagation regions respectively. White arrows point the same cell over time. N=5, N=8 and N=4 embryos for UAS-Fog, UAS-Gα12[CA] and UAS-Rho1[CA] respectively. (b) Left: Pathway of MyoII activation in endoderm cells. Right: Schematic of the Fog expression pattern (orange) in WT and UAS-Fog and of the observed MyoII pattern (green). The active and inactive zones used to calculate the MyoII tissue level polarity in c are indicated. (c-d) Quantifications of MyoII tissue-level polarity 10min after primordium activation (c) and of MyoII propagation (the number of cell rows of the propagation zone activated within 20min) (d) for the indicated conditions. For c, N=10 (P=4.1E-12), N=5 (P=2.9E-4), N=8 (P=0.0011), N=4 (P=0.0027) embryos for WT, UAS-Fog, UAS-Ga12[CA] and UAS-Rho1[CA] respectively with the p-values from a one-sample t-test against the hypothesis that the data are a normally distributed with mean=0. For d, N is as c except N=16 for WT, and P=0.076, P=1.8E-4 and P=0.80 from a two-sided Mann-Whitney test for the indicated comparisons. (e) Sagittal sections of a WT and an embryo ubiquitously expressing Fog (UAS-Fog). Immunolabelling for Fog is in white and for Tailless (Tll) in green. N=10 WT and 2 UAS-Fog embryos from 2 independent experiments. (f) MyoII pattern with Fog ubiquitous expression in a WT and a fog zygotic mutant embryos (imaged with 20X objective). N=3 embryos each. (g) Quantifications of MyoII patterns along the AP-axis in the posterior endoderm of the indicated conditions. N=3 embryos each, Mean±SD.
Extended Fig. 8.
Extended Fig. 8.. Cells in the propagation region are subjected to mechanical stress:
(a) Left: Regions in the dorsal epithelium (corresponding to the propagation region) where tension was probed by line cuts with different orientations (ML cut in blue and AP cut in green). Right: Examples of ML and AP line cuts in the indicated regions. Overlays of the pre-cut (in magenta) and an image 10s post-cut (in green) are shown. The yellow line indicates the line cut. N is as in b for WT. (b) Quantifications of the tissue initial recoil velocity in the regions and line orientations illustrated in WT and H-1152 (Rok inhibitor) injected embryos. N indicates the number of independent ablations extracted from 26 and 7 embryos for WT and H-1152 respectively. Boxplots show the median, the 25th and the 75th percentiles. The red crosses label outliers. P values are from a two-sided Mann-Whitney test.
Extended Fig. 9.
Extended Fig. 9.. Mechanical perturbations affect propagation speed and MyoII recruitment:
(a) Time-lapse of a WT (left), an embryo with an anterior medio-lateral fence (AF, middle) and a dorsalized embryo (dl−/−, right). Marked in yellow are representative tracked cells in the propagation region. Bottom: Schematic representations of the normal and perturbed conditions. N=9 WT embryos, 4 AF embryos and 5 dl−/− embryos. (b) Speed of MyoII propagation in the reference frame of the tissue in the indicated conditions. N=9 WT embryos, 4 AF embryos and 5 dl−/− embryos. P=0.0028 and P=1.0E-3 from a two-sided Mann-Whitney test. (c-d) Maximum MyoII integrated intensity (c) and minimum rate of apical constriction (d) in cells of the propagation region for the indicated conditions. N=663 cells from 9 WT embryos, 93 cells from 4 AF embryos and 129 cells from 5 dl−/− embryos. P values are from a two-sided Mann-Whitney test. Boxplots show median and 25th and 75th percentiles. The red crosses label outliers.
Extended Fig. 10.
Extended Fig. 10.. Rho1-GTP propagation is affected after Rok inhibitor injection:
(a) High resolution time-lapse of Rho1-GTP (Anillin(RBD)∷GFP) in a control (water) and an embryo injected with 40mM H-1152 (Rok inhibitor) during propagation. Larger views and later times after injection are shown (compared to Fig.3f). The numbers in yellow indicate cells belonging to cell rows at different distances from the invaginating furrow. N=6 embryos for H-1152 and N=3 for water injections respectively. (b-c) Measurement of Rho1-GTP (Anillin(RBD)∷GFP) mean intensity over time in cells (or regions of cells) at different distances from the invaginating furrow in water (b) and H-1152 (c) injected embryos. Representative of N=47 cells for water and 47 cells for H-1152 injected embryos.
Extended Fig. 11.
Extended Fig. 11.. MyoII activation in cells of the propagation zone:
(a) Top and side views of MyoII activation in cells of the propagation region. The cell contour is labelled in yellow. White arrows indicate bright speckles of MyoII in regions of the cell in contact with the vitelline membrane. N=50 cells from 3 embryos. (b) Time trace of MyoII integrated intensity of the cell in a. The selected stills in a are indicated along with the time of the cell posterior and anterior edge detachment. (c) Histogram of the time of cell posterior and anterior edge detachment from the vitelline membrane relatively to the time of MyoII activation (defined as time 0). N=50 cells from 3 embryos. (d) Average velocity (relative to the vitelline membrane) of the posterior and anterior edges of cells in the propagation zone. Pink and green boxes: phases of rapid cell displacement and immobilization of the posterior edge respectively. Time t0 is defined for each cell as the time of max projected area increase rate. Mean±SD. N=456 cells, 6 embryos.
Extended Fig. 12.
Extended Fig. 12.. The 3D cycle of cell deformations during wave propagation depends of sustained MyoII activity:
(a) Time-lapse of dextran injection in the perivitelline space. Dextran alone is on the left and merge images with Ecad and MyoII on the right. The arrows indicate the same two cells over time as the invaginating furrows approaches them. (b) Space-intensity plot of MyoII and dextran intensity in the propagation region. N=3 embryos, Mean±SD. (c-e) Scatter plots of the average speed of the mechanical cycle during wave propagation calculated from the MyoII activation front vs the speed calculated from the projected apical cell area or cell position along the apico-basal axis of the tissue for the indicated conditions (N=18 embryos). R2 values for a fit y=x are shown. (f) A control and an embryo injected with H-1152 (Rok inhibitor) during MyoII propagation. Reconstructed side views from confocal stacks are shown. White asterisks and dashed lines mark a single cell over time. Time t0 is the time of injection. N=2 embryos for both control (water) and H-1152 injected embryos.
Figure 1.
Figure 1.. Propagation of MyoII activation in the posterior endoderm:
(a) Endoderm morphogenesis during embryonic axis extension. Dotted box: region of imaging. (b) Time-lapse of MyoII during endoderm morphogenesis. Dashed oval: the primordium region, in yellow and white cells of different medio-lateral rows, white arrows: MyoII activation. N=13 embryos. (c) Primordium and the propagation regions mapped on the dorsal epithelium at the onset of gastrulation. The size of each domain is indicated (N=13 embryos). (d-e) Kymograph heat-maps of median MyoII integrated intensity (d) and projected apical cell area (e). Dashed line: border between the primordium and propagation regions, black line: constant speed of the MyoII wave. N=947 cells, 5 embryos. (f) Time course of projected apical area and MyoII integrated intensity in cells in the propagation zone (N=456 cells, 6 embryos). Cells are registered on t0 the time of MyoII activation. Mean±SD in c,d,f.
Figure 2.
Figure 2.. MyoII propagation does not depend on gene transcription:
(a) Illustration of the dorsal epithelium in a sagittal section describing the hypothesis of propagation in gene expression controlling MyoII propagation. (b) Sagittal sections of immunostainings for Fog and MyoII at the indicated stages. White arrows: boundaries of the fog expression domain, yellow arrowheads: cells recruiting MyoII at the anterior boundary of the furrow. N=7 embryos for primordium contraction and N=5 embryos for propagation stages from 2 independent experiments. (c) Time-lapse of fog expression in the posterior endoderm visualized with the MS2-MCP system. White dashed boxes: positions of the close-ups, yellow lines: the region where side-views were generated. N=11 embryos. (d) MyoII wave propagation in control (water) and α-amanitin injected embryos. In yellow cells in the propagation region. (e) Quantifications MyoII propagation in water and α-amanitin injected embryos. The number of cell rows activating MyoII in the propagation region over time was measured. Mean±SD. In d and e N=11 for water and N=10 for α-amanitin injected embryos. In e t0 is the beginning of MyoII propagation. Scalebar 15μm in b,c,d and 5μm in the insets in c.
Figure 3.
Figure 3.. The MyoII wave is mechanically regulated and a feedback from MyoII promotes Rho1 activation in cells:
(a) Hypothesis of mechanical feedback controlling MyoII propagation. (b) Time-lapse of Rho1-GTP (Anillin(RBD)∷GFP) in water (N=10 embryos) and H-1152 (Rok inhibitor, N=12 embryos) injected embryos at end of cellularization. Yellow and orange lines highlight the primordium and propagation regions respectively. (c) Quantifications of the Rho1-GTP wave as in Fig.2e. Mean±SD. N=10 for water and N=12 for H-1152. (d) Model used to study the effects a stress-based feedback on MyoII (see Supplementary Information). Fog produced in the primordium activates MyoII but cannot diffuse. Instead, stress locally activates MyoII and propagates within the tissue. (e) Kymograph heat-map of activated MyoII (MyoII concentration integrated over the unit volume taking into account its local deformation, see Supplementary Information) from one simulation of the model in d. (f) Time lapse of Rho1-GTP (Anillin(RBD)∷GFP) and MyoII in water and H-1152 (Rok inhibitor) injected embryos during propagation. Yellow: cell contours, white arrows: accumulations of Rho1-GTP. N=15 cells, 3 embryos each. (g-h) Quantifications of the mean intensity of Rho1-GTP before and after injections. N=15 cells, 3 embryos each. (g) Mean intensity over time (Mean±SD). (h) Recruitment rate difference (post–pre injection) following Rok inhibitor injection. P=7.8E-4 from a two-sided Mann-Whitney test. Boxplots show the median, the 25th and the 75th percentiles. Grey crosses label outliers. In c t0 is the beginning of MyoII propagation, in f and g time 0 is the time of injection.
Figure 4.
Figure 4.. 3D cycle of cell deformations accompanying and sustaining MyoII activation:
(a) Side views of MyoII recruitment and cell deformations during wave propagation. Left: larger views. Right: closeup of the boxed region. Dashed white lines: cell contours, dashed yellow line: vitelline membrane, solid white line: basal side of the epithelium. The yellow and magenta dots label 2 cells. White and yellow arrows: the apical and basal side of cells respectively. N=2 embryos. (b) Side views of E-cad during apical spreading of a cell in the propagation zone. Dashed yellow line: vitelline membrane. Dashed white line: cell outline. White asterisks: E-cad junctions. N=50 cells, 3 embryos. (c) Kymograph illustrating the movement and deformation along the AP-axis of a cell in the propagation zone. Red and blue traces: posterior and anterior edges of the cell respectively. Pink and green boxes: phases of rapid cell displacement and immobilization of the posterior edge respectively. N=456 cells, 6 embryos. (d) Dextran injection in the perivitelline space during MyoII propagation. Dashed white lines: region of MyoII activation and dextran exclusion. N=3 embryos. (e) 3D mechanical cycle associated to the MyoII wave. Green arrows: MyoII contractility, purple zone: zone of apical adhesion, red arrows: pushing forces. Three cells undergoing the cycle at consecutive time points are labelled in different colors. In d t0 is arbitrary.
Figure 5.
Figure 5.. Integrin-dependent adhesion underlies posterior endoderm movement and MyoII activation during wave propagation:
(a) Still of the apical side of cells during MyoII propagation. White arrow: cell attachment to the vitelline membrane. The plasma membrane is labelled with Gap43. N=4 embryos. (b) Schematic of scab expression in the embryo. (c-d) Time-lapse of a control (water injected) (c) and a scab RNAi embryo (d). The yellow arrows are proportional to the velocities of cells in the propagation region. Two representative cells are marked in yellow. N=4 embryos each. (e-f) Kymograph heat-maps of MyoII integrated intensity and cell velocities in control (e) and scab RNAi (f) injected embryos. Dashed line: boundary between primordium and propagation regions. N=622 cells from 4 water and 693 cells from 4 scab RNAi injected embryos.

Comment in

References

    1. Lecuit T & Lenne PF Cell surface mechanics and the control of cell shape, tissue patterns and morphogenesis. Nat Rev Mol Cell Biol 8, 633–644, doi:10.1038/nrm2222 (2007). - DOI - PubMed
    1. Gilmour D, Rembold M & Leptin M From morphogen to morphogenesis and back. Nature 541, 311–320, doi:10.1038/nature21348 (2017). - DOI - PubMed
    1. Leptin M Gastrulation in Drosophila: The logic and the cellular mechanisms. Embo Journal 18, 3187–3192, doi:DOI 10.1093/emboj/18.12.3187 (1999). - DOI - PMC - PubMed
    1. Heisenberg CP & Bellaiche Y Forces in tissue morphogenesis and patterning. Cell 153, 948–962, doi:10.1016/j.cell.2013.05.008 (2013). - DOI - PubMed
    1. Martin AC, Kaschube M & Wieschaus EF Pulsed contractions of an actin-myosin network drive apical constriction. Nature 457, 495–499, doi:10.1038/nature07522 (2009). - DOI - PMC - PubMed

Publication types

LinkOut - more resources