. 2019 Aug 2;5(8):eaax6946.
doi: 10.1126/sciadv.aax6946. eCollection 2019 Aug.

Application of hydroxyapatite nanoparticles in tumor-associated bone segmental defect

Affiliations

Application of hydroxyapatite nanoparticles in tumor-associated bone segmental defect

Kun Zhang et al. Sci Adv. .

Abstract

Hydroxyapatite (HA) has been widely applied in bone repair because of its superior biocompatibility. Recently, a proliferation-suppressive effect of HA nanoparticles (n-HA) against various cancer cells was reported. This study was aimed at assessing the translational value of n-HA both as a bone-regenerating material and as an antitumor agent. Inhibition of tumor growth, prevention of metastasis, and enhancement of the survival rate of tumor-bearing rabbits treated with n-HA were demonstrated. Activated mitochondrial-dependent apoptosis in vivo was confirmed, and we observed that a stimulated immune response was involved in the n-HA-induced antitumor effect. A porous titanium scaffold loaded with n-HA was fabricated and implanted into a critical-sized segmental bone defect in a rabbit tumor model. The n-HA-releasing scaffold not only showed a prominent effect in suppressing tumor growth and osteolytic lesion but also promoted bone regeneration. These findings provide a rationale for using n-HA in tumor-associated bone segmental defects.


Figures

Fig. 1
Fig. 1. Characterization of particles and scaffold.
(A) XRD patterns of n-HA, μ-HA, and n-TiO2 particles. The standard spectra of HA, antase TiO2, and rutile TiO2 are given below. a.u., arbitrary units. (B) Representative TEM image of n-HA, SEM image of μ-HA, and TEM image of n-TiO2. (C) SEM images of 3D-printed porous titanium scaffold subjected to acid-alkali treatment, coated with n-HA and surface/cross-sectional alignment of n-HA with EDS confirmation. The dotted yellow line indicates the interface between n-HA coating and scaffold. The yellow arrow marks the average thickness of n-HA layer. Ca/P indicates atomic molar ratio of the selected region. (D) Weight change of particles released from n-HA/scaffolds immersed in tris-HCl solution for 7 days. Error bars represent SD. n = 3 replicates. (E) Representative TEM image of the released n-HA particles. (F) XRD pattern of the released n-HA particles. The asterisk indicates characteristic peaks of HA.
Fig. 2
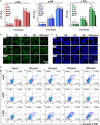
Fig. 2. In vitro tumor cell viability and apoptosis cocultured with different particles.
(A) VX2 cells viability determined by CCK-8 assay when cocultured with n-HA, μ-HA, and n-TiO2 for 1, 3, and 5 days. Error bars represent SD. *P < 0.05 compared to 0 μg/ml; †P < 0.05 compared to 1000 μg/ml; P values were calculated using one-way analysis of variance (ANOVA) followed by Tukey’s post hoc test. n = 3 biological replicates. OD, optical density. (B) Representative fluorescent images of VX2 cells stained with fluorescein diacetate (green) and (C) nucleus stained with 4′,6-diamidino-2-phenylindole (blue) treated with n-HA, μ-HA, and n-TiO2 at different concentrations for 3 days. Arrowheads indicate condensed chromatin. (D) Representative dot plots of annexin V fluorescein isothiocyanate (FITC) apoptosis detection results of VX2 cells treated with n-HA, μ-HA, and n-TiO2 at different concentrations for 3 days.
Fig. 3
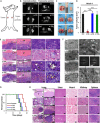
Fig. 3. n-HA inhibits the tumor growth and metastasis in rabbits.
(A) A diagram depicts the arrangement of left and right flanks of the experimental rabbits. (B) MRI of the tumor-bearing rabbits administered with n-HA, μ-HA, or n-TiO2 (right flank) for 3 weeks. Left flank served as control (Ctrl). (C) Photographs of excised tumor tissues at week 4. (D) Quantification of the excised tumor volume at week 4. Error bars represent SD. n = 4 biological replicates. **P < 0.01; P value was calculated using one-way ANOVA followed by Tukey’s post hoc test. (E) Representative hematoxylin and eosin (H&E) staining of tumor tissues treated with n-HA, μ-HA, and n-TiO2 at week 4. T, tumor tissue; M, muscle tissue adjacent to tumor; *, materials; arrow, FBGCs. Scale bars, 10 mm (column 1), 200 μm (column 2), 50 μm (column 3), and 20 μm (column 4). (F) TEM images of tumor tissues treated with n-HA, μ-HA, and n-TiO2 at week 4. Scale bars, 2 μm (column 1) and 500 nm (column 2). The SAED of the particles confirmed the existence of n-HA and n-TiO2 near cell nucleus. N, nucleus. (G) Survival rate of the rabbits upon different particles treatment. n = 4 per group. (H) H&E staining of the major organs collected from one side of tumor-bearing rabbits administered with n-HA, μ-HA, n-TiO2, or vehicle (Ctrl) at week 4. Scale bars, 500 μm (column 1) and 200 μm (other columns). Photo credit: Kun Zhang, National Engineering Research Center for Biomaterials, Sichuan University.
Fig. 4
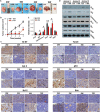
Fig. 4. Activation of mitochondrial apoptosis pathway by n-HA.
(A) Longitudinal observation of the excised tumor treated with n-HA from weeks 2 to 5 (2W to 5W). Ctrl, left flank control without any treatment. (B) Quantification of the excised tumor volume. Error bars represent SD. n = 4 per group. (C and D) Expressions of mitochondrial apoptosis-related markers in tumor tissues measured by Western blotting (WB) at week 4. VEGF, vascular endothelial growth factor; GAPDH, glyceraldehyde phosphate dehydrogenase. Error bars represent SD. n = 3 per group. (E) Immunohistochemical analyses of Ki-67, Cyt C, p53, Bcl-2, and Bax and TUNEL assay of tumor tissues treated with n-HA at week 5 in comparison with control. Scale bar, 50 μm. *P < 0.05, **P < 0.01 compared to control, two-way t test. Photo credit: Kun Zhang, National Engineering Research Center for Biomaterials, Sichuan University.
Fig. 5
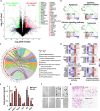
Fig. 5. n-HA regulates gene expressions related to tumor suppression, calcium homeostasis, and immune response.
(A) Volcano plot showing differentially regulated genes in the n-HA–treated tumor tissue as compared to the nontreated control. Genes with an absolute fold change of >2 and a P value of <0.05 are highlighted in green and red, denoting down- and up-regulated genes, respectively. (B) Gene set enrichment analysis of the regulated gene pathways with the Kyoto Encyclopedia of Genes and Genomes database. NES, normalized enrichment score. (C) Circular visualization of the results of gene-annotation enrichment analysis. (D) Heat map of genes that were differentially expressed in n-HA versus control tumor tissues with a fold change of >2 and a P value of <0.05. (E) Enzyme-linked immunosorbent assay of inflammatory cytokines secreted by mouse RAW 264.7 macrophages into culture medium (macrophages conditioned medium) after 3 days of coculturing with n-HA. *P < 0.05, **P < 0.01 compared to control, two-way t test. Error bars represent SD. n = 3 biological replicates. TGF-β, transforming growth factor–β; FGF, fibroblast growth factor. (F) Wound healing assay of mouse 4T1 tumor cells treated with control medium (Ctrl), n-HA, macrophages conditioned medium (CM), or macrophages conditioned medium with n-HA (CM@n-HA) for 24 hours. (G) Transwell assay after crystal violet staining showing serum-induced migration of 4T1 tumor cells treated with Ctrl, n-HA, CM, or CM@n-HA for 24 hours.
Fig. 6
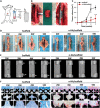
Fig. 6. Antitumor and segmental bone defect healing ability of n-HA–loaded titanium scaffold.
(A) Diagram depicting the preparation of tumor cell suspension and seeding into scaffold. (B) Implantation of tumor cell–seeded scaffold at segmental bone defect of rabbit femur. (C) Tumor volume of the rabbits implanted with empty scaffolds or n-HA/scaffolds within 5 weeks. Error bars represent SD. n = 4 per group. **P < 0.01 compared to empty scaffold, two-way t test. (D) Photographs of excised implants with tumor from weeks 2 to 5. (E) Micro-CT–reconstructed images of the implants and adjacent bone tissue. B, bone; S, scaffold; arrows show adjacent cortical bone resorption by tumor. (F) Histological observation of the implanted scaffolds. S, scaffold; T, tumor; red arrows indicate new bone formation. Photo credit: Yong Zhou, Department of Orthopaedic Surgery, West China Hospital of Sichuan University.

References

    1. Randall R. L., A promise to our patients with metastatic bone disease. Ann. Surg. Oncol. 21, 4049–4050 (2014). - PubMed
    1. Isakoff M. S., Bielack S. S., Meltzer P., Gorlick R., Osteosarcoma: Current treatment and a collaborative pathway to success. J. Clin. Oncol. 33, 3029–3035 (2015). - PMC - PubMed
    1. Qu H., Guo W., Yang R., Li D., Tang S., Yang Y., Dong S., Zang J., Reconstruction of segmental bone defect of long bones after tumor resection by devitalized tumor-bearing bone. World J. Surg. Oncol. 13, 282 (2015). - PMC - PubMed
    1. Andreou D., Bielack S. S., Carrle D., Kevric M., Kotz R., Winkelmann W., Jundt G., Werner M., Fehlberg S., Kager L., Kühne T., Lang S., Dominkus M., Exner G. U., Hardes J., Hillmann A., Ewerbeck V., Heise U., Reichardt P., Tunn P.-U., The influence of tumor- and treatment-related factors on the development of local recurrence in osteosarcoma after adequate surgery. An analysis of 1355 patients treated on neoadjuvant Cooperative Osteosarcoma Study Group protocols. Ann. Oncol. 22, 1228–1235 (2011). - PubMed
    1. Ma H., Jiang C., Zhai D., Luo Y., Chen Y., Lv F., Yi Z., Deng Y., Wang J., Chang J., Wu C., A bifunctional biomaterial with photothermal effect for tumor therapy and bone regeneration. Adv. Funct. Mater. 26, 1197–1208 (2016).

Publication types

LinkOut - more resources