. 2019 Jun 10;3(3):pkz038.
doi: 10.1093/jncics/pkz038. eCollection 2019 Sep.

40 Years of Change in Age- and Stage-Specific Cancer Incidence Rates in US Women and Men

Affiliations

40 Years of Change in Age- and Stage-Specific Cancer Incidence Rates in US Women and Men

Rebecca D Kehm et al. JNCI Cancer Spectr. .

Abstract

Background: Studies have documented a temporal increase in incidence for several cancers in US young adults aged 25 to 39-years, including noncardia gastric cancer, colorectal cancer, and distant-stage breast cancer. To further characterize trends in young adults, we assessed age-specific and stage-specific incidence trends from 1975 to 2015, overall (all malignant cancers combined), and for 18 and 16 cancer sites in women and men, respectively.

Methods: We used US population-based data from the Surveillance, Epidemiology, and End Results Program to obtain overall and site-specific cancer incidence rates by sex and age group. We individually analyzed cancer sites with an incidence rate of at least 5 per 100 000 in 2015, accounting for greater than 90% of all cancer diagnoses. We estimated annual percent changes (APCs) using segment log-linear regression performed with joinpoint software; multiple permutation testing was used to identify inflection points. We forecasted overall cancer incidence through 2030 using age-period-cohort regression models.

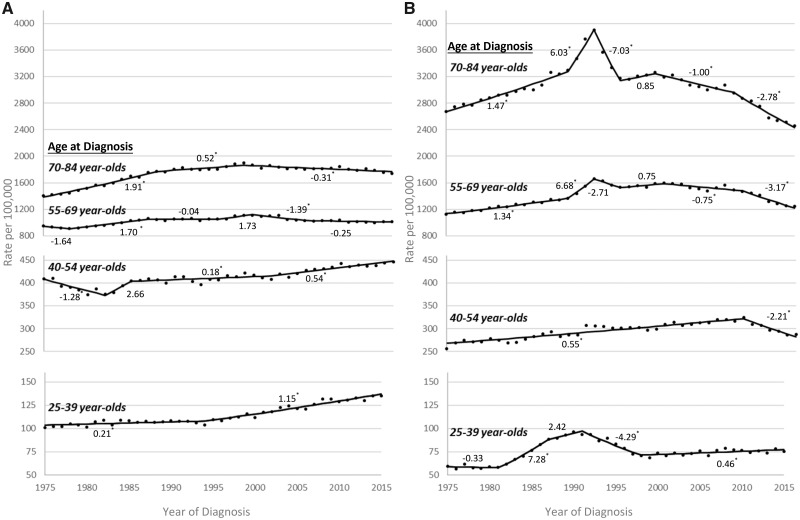
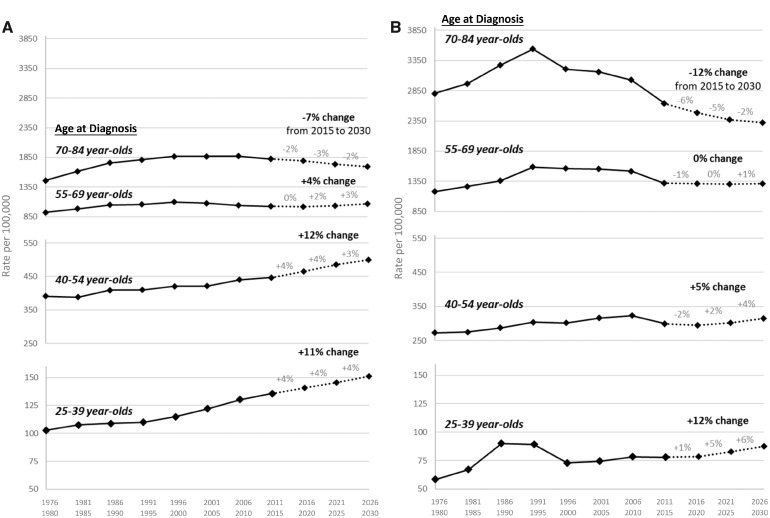
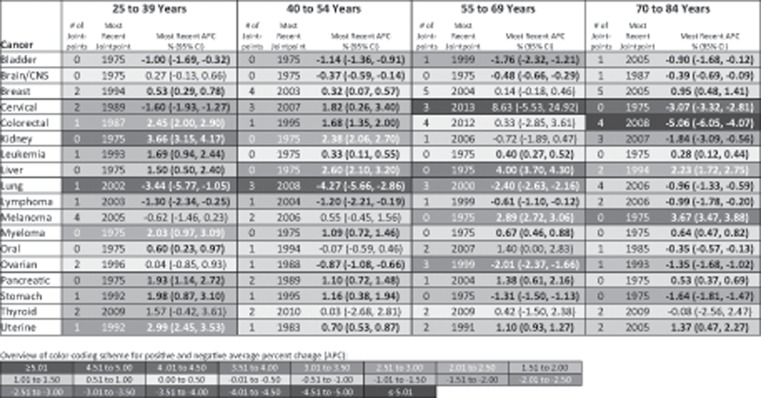
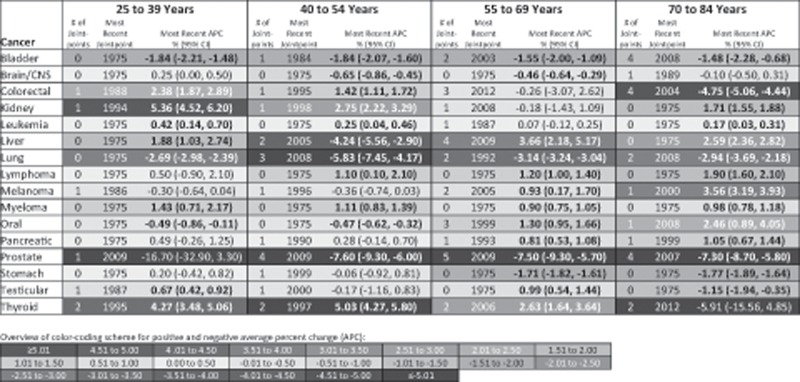
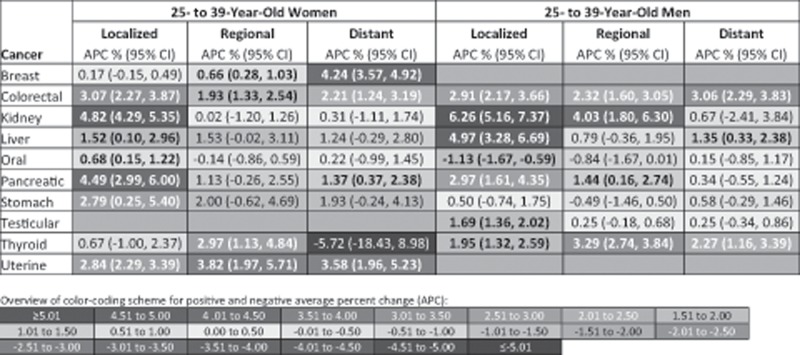
Results: Based on trends occurring after the most recent joinpoint inflection point, overall cancer incidence increased by 1.15% (95% CI = 1.01% to 1.28%) per year in 25- to 39-year-old women and by 0.46% (95% CI = 0.17% to 0.75%) per year in 25- to 39-year-old men; APCs were of much lower magnitude in the older age groups (eg, 70- to 84-year-old women APC = -0.31%, 95% CI = -0.42% to -0.20%). We forecasted that overall cancer incidence will increase by an additional 11% by 2030 in 25- to 39-year-old women, and by an additional 12% in 25- to 39-year-old men. Ten of the 18 cancers assessed in 25- to 39-year-old women and 7 of the 16 cancers in 25- to 39-year-old men have been statistically significantly increasing over time. We found that the increase in incidence for young adults is stage specific for some cancers (eg, only nonlocalized breast cancer has increased in 25- to 39-year-old women).

Conclusion: Cancer incidence is increasing in young adults, particularly in young women.


Figures

Figure 1.
Figure 1.
Trends in overall cancer incidence rates by sex, age group, and year of diagnosis, Surveillance, Epidemiology, and End Results 9 database registries, 1975–2015. A) Annual overall cancer incidence rates, age-adjusted to the 2000 US standard population, and annual percent change (APC) for each joinpoint segment for women by age group at diagnosis. B) Annual overall cancer incidence rates, age-adjusted to the 2000 US standard population, and APC for each joinpoint segment for men by age group at diagnosis. The APC for each joinpoint segment is provided above or below the trend line. *Statistically significant APCs (H0: APC = 0; P < .05 for a two-sided test based on the t distribution).
Figure 2.
Figure 2.
Projections of overall cancer incidence trends through 2030 by sex, age group, and year of diagnosis, Surveillance, Epidemiology, and End Results 9 database registries, 1975–2015. A) Overall cancer incidence rates projected through 2030 for women by age group at diagnosis. B) Overall cancer incidence rates projected through 2030 for men by age group at diagnosis. The overall percent change from 2015 to 2030 and the percent change for each 5-year interval (eg, 2016–2020) are provided above the trend line.
Figure 3.
Figure 3.
Site-specific cancer incidence trends for women by age group at diagnosis based on the annual percent change (APC) after the most recent joinpoint inflection point, Surveillance, Epidemiology, and End Results 9 database registries, 1975–2015. Incidence rates are age-adjusted to the 2000 US standard population. Cancer types are classified based on SEER’s site recode International Classification of Diseases for Oncology, third revision/World Health Organization-2008 variable: bladder = urinary bladder; brain/CNS = brain and other central nervous system; cervical = cervix uteri; kidney = kidney and renal pelvis; liver = liver and intrahepatic bile duct; lung = lung and bronchus; oral = oral cavity and pharynx; uterine = corpus and uterus, not otherwise specified. Positive APCs, which indicate increasing incidence over time, are in red (color shading darkens with increasing values); negative APCs, which indicate decreasing incidence over time, are in blue. Statistically significant APCs (H0: APC = 0; P < .05 for a two-sided test based on the t distribution) are bold. CI = confidence interval.
Figure 4.
Figure 4.
Site-specific cancer incidence trends for men by age group at diagnosis based on the (APC) annual percent change after the most recent joinpoint inflection point, Surveillance, Epidemiology, and End Results 9 database registries, 1975–2015. Incidence rates are age-adjusted to the 2000 US standard population. Cancer types are classified based on SEER’s site recode International Classification of Diseases for Oncology, third revision/World Health Organization-2008 variable: bladder = urinary bladder; brain/CNS = brain and other central nervous system; kidney = kidney and renal pelvis; liver = liver and intrahepatic bile duct; lung = lung and bronchus; oral = oral cavity and pharynx. Positive APCs, which indicate increasing incidence over time, are in red (color shading darkens with increasing values); negative APCs, which indicate decreasing incidence over time, are in blue. Statistically significant APCs (H0: APC = 0; P < .05 for a two-sided test based on the t distribution) are bold. CI = confidence interval.
Figure 5.
Figure 5.
Site- and stage-specific cancer incidence trends for 25- to 39-year-old women and men based on the annual percent change (APC) after the most recent joinpoint inflection point, Surveillance, Epidemiology, and End Results 9 database registries, 1975–2015. APCs are based on the time trend after the most recent inflection point identified by joinpoint regression using data for all stages combined. Refer to Figures 3 and 4 for the year of the most recent inflection point for each cancer. Incidence rates are age-adjusted to the 2000 US standard population. Cancer types are classified based on SEER’s site recode International Classification of Diseases for Oncology, third revision/World Health Organization-2008 variable: kidney = kidney and renal pelvis; liver = liver and intrahepatic bile duct; oral = oral cavity and pharynx; uterine = corpus and uterus, NOS. Positive APCs, which indicate increasing incidence over time, are in red (color shading darkens with increasing values); negative APCs, which indicate decreasing incidence over time, are in blue. Statistically significant APCs (H0: APC = 0; P < .05 for a two-sided test based on the t distribution) are bold. CI = confidence interval.

References

    1. Anderson WF, Camargo MC, Fraumeni JF Jr, Correa P, Rosenberg PS, Rabkin CS.. Age-specific trends in incidence of noncardia gastric cancer in US adults. JAMA. 2010;303(17):1723–1728. - PMC - PubMed
    1. Bailey CE, Hu CY, You YN.. Increasing disparities in the age-related incidences of colon and rectal cancers in the United States, 1975-2010. JAMA Surg. 2015;150(1):17–22. - PMC - PubMed
    1. Johnson RH, Chien FL, Bleyer A.. Incidence of breast cancer with distant involvement among women in the United States, 1976 to 2009. JAMA. 2013;309(8):800–805. - PubMed
    1. Sung H, Siegel RL, Rosenberg PS, Jemal A.. Emerging cancer trends among young adults in the USA: analysis of a population-based cancer registry. Lancet Public Health. 2019;4(3):e136–e147. - PubMed
    1. Surveillance, Epidemiology, and End Results (SEER) Program. SEER*Stat Database: Incidence—SEER 9 Regs Research Data, Nov 2017 Sub (1973-2015) <Katrina/Rita Population Adjustment>—Linked To County Attributes - Total U.S., 1969-2016 Counties, National Cancer Institute, DCCPS, Surveillance Research Program, released April 2018. www.seer.cancer.gov. Based on November 2017 submission.