

Bhlhe40 and Bhlhe41 transcription factors regulate alveolar macrophage self-renewal and identity
- PMID: 31414712
- PMCID: PMC6769426
- DOI: 10.15252/embj.2018101233
Bhlhe40 and Bhlhe41 transcription factors regulate alveolar macrophage self-renewal and identity
Abstract
Tissues in multicellular organisms are populated by resident macrophages, which perform both generic and tissue-specific functions. The latter are induced by signals from the microenvironment and rely on unique tissue-specific molecular programs requiring the combinatorial action of tissue-specific and broadly expressed transcriptional regulators. Here, we identify the transcription factors Bhlhe40 and Bhlhe41 as novel regulators of alveolar macrophages (AMs)-a population that provides the first line of immune defense and executes homeostatic functions in lung alveoli. In the absence of these factors, AMs exhibited decreased proliferation that resulted in a severe disadvantage of knockout AMs in a competitive setting. Gene expression analyses revealed a broad cell-intrinsic footprint of Bhlhe40/Bhlhe41 deficiency manifested by a downregulation of AM signature genes and induction of signature genes of other macrophage lineages. Genome-wide characterization of Bhlhe40 DNA binding suggested that these transcription factors directly repress the expression of lineage-inappropriate genes in AMs. Taken together, these results identify Bhlhe40 and Bhlhe41 as key regulators of AM self-renewal and guardians of their identity.
Keywords: Bhlhe40; Bhlhe41; alveolar macrophages; self-renewal; tissue-resident macrophages.
© 2019 The Authors.
Conflict of interest statement
The authors declare that they have no conflict of interest.
Figures

- A
Expression of Bhlhe40 (gray) and Bhlhe41 (orange) in the indicated cell populations, data are from the Immgen Database (microarray dataset). CMP—common myeloid progenitors. MΦ—macrophages.
- B
Flow cytometry detection of the Bhlhe40 (gray) and Bhlhe41 (orange) transcripts by the PrimeFlow RNA assay in alveolar (right) and peritoneal (left) macrophages. A probe specific for the Cd8a mRNA (black line) was used as a negative control. Results are representative of at least four independent experiments.
- C, D
Cell‐surface phenotype and numbers of alveolar (C; digested lung) and peritoneal (D) macrophages in WT and DKO mice. Additional gating for CD11b+ cells was applied for peritoneal macrophages as indicated. Levels of CD11b expression on WT and DKO AMs are shown, and median fluorescent intensity for CD11b expression was quantified (C, bottom left; three mice per genotype). Absolute numbers of CD11chiCD11bloSiglecFhi alveolar macrophages from digested lungs (C) and CD11b+F4/80hi peritoneal macrophages (D) from WT and DKO mice are shown (bottom; four mice per genotype). Representative results of two independent experiments. Horizontal lines indicate the mean and error bars represent s.d. ***P < 0.001 (Student's t‐test).

- A, B
Normal numbers and cell‐surface phenotype of tissue‐resident macrophages in DKO mice. (A) Cell‐surface phenotype and cell numbers of Kupffer cells, microglia, and splenic red pulp macrophages in WT and DKO mice. Liver (top), brain (middle), and splenic (bottom) leukocytes were isolated from WT and DKO mice as discussed in Materials and Methods, stained with the indicated antibodies and analyzed by flow cytometry. Representative plots and gating strategies (left and center) for Kupffer cells (top), microglia (middle) and red pulp macrophages (bottom) are shown together with their absolute cell numbers (right). Horizontal lines indicate the mean, error bars represent s.d. Four (Kupffer cells and red pulp macrophages) and two (microglia) mice per genotype were analyzed. (B) Numbers of large peritoneal macrophages in WT and Bhlhe40 −/− mice. Results pooled from two independent experiments; nine mice per genotype were analyzed in total.
- C, D
Bhlhe40 and Bhlhe41 have redundant functions in alveolar but not peritoneal macrophages. (C) Flow cytometric analysis of the contribution of donor and recipient cells to BM LSKs, large peritoneal macrophages and AMs in chimeras established by injection of a 1:1 mixture of lineage‐depleted BM cells from WT (CD45.1) and Bhlhe40 −/− (left), Bhlhe41 −/− (center) or DKO (right) (all CD45.2) donors into lethally irradiated CD45.1/2 recipients. (D) Quantification of donor and recipient cell contribution to the indicated compartments in Bhlhe40 −/−:WT and Bhlhe41 −/−:WT chimeras; five chimeras analyzed, error bars represent s.d. (C, D) Representative results of three independent experiments.
- E
Normal AM development in neonatal DKO mice. Flow cytometry contour plots showing CD11c and Ly6c expression on CD45+CD11b+ cells from neonatal (P2) lungs of WT and DKO mice (top) and the expression of CD11c and Siglec F on the same cells gated for the lack of Ly6c expression. Right—absolute numbers of CD45+CD11b+Ly6c−CD11c+Siglec F+ neonatal AMs in these mice. Results of a single experiment, three mice per genotype. Horizontal lines indicate the mean, error bars represent s.d.

- A
Frequency of WT donor (CD45.1), and DKO donor (CD45.2) and recipient (CD45.1/2) cells in the indicated BM (LSK, CMP), splenic (monocytes and red pulp macrophages), liver (Kupffer cells), peritoneal and alveolar macrophage populations of lethally irradiated recipients ≥ 6 weeks after transfer of a 1:1 mixture of lineage‐depleted BM cells from WT and DKO mice. P values < 0.05 (paired Student's t‐test) between LSK and other populations are shown for frequencies of WT cells. Three mixed BM chimeras were analyzed; error bars represent s.d. Representative results of three independent experiments.
- B, C
Representative flow cytometric analysis of lung (B) and peritoneal (C) macrophages as in (A) (left). The expression of CD45.1 and CD45.2 on donor and recipient cells is shown next to the indicated gates (right).
- D
Frequency of WT donor (CD45.1), and DKO donor (CD45.2) and recipient (CD45.1/2) cells among the BM LSK cells, splenic monocytes, and alveolar macrophages of the recipients that were irradiated with lung shielding, treated with one dose of busulfan as described in Materials and Methods, transferred with a 1:1 mixture of lineage‐depleted BM cells from WT and DKO mice, and analyzed ≥ 8 weeks after transfer. Representative flow cytometry results for alveolar macrophages (left) and quantification (right) is shown. Single experiment with three chimeras. Error bars represent s.d.
- E
Surface phenotype of cells from the digested lungs (right) and quantification of donor contribution to the AM compartment (left) of AM‐deficient Csf2rb −/− Csf2rb2 −/− recipients (CD45.2) that were subjected to intranasal transfer of a 1:1 mixture of sorted fetal liver monocytes from WT (CD45.1/2) and DKO (CD45.2) E18.5 embryos at days 1 or 2 after birth and analyzed ≥ 7 weeks after the transfer. Cell‐surface phenotype of lung cells from a Csf2rb −/− Csf2rb2 −/− mouse that was not subjected to the transfer is shown for comparison. Single experiment with seven recipients. **P < 0.01 (paired Student's t‐test).
- F
Frequency of donor‐ and recipient‐derived AMs in WT and DKO recipients transferred at days 1 or 2 after birth intranasally with WT CD45+ cells sorted from neonatal lungs and analyzed ≥ 7 weeks after the transfer. Results for quantification (lower panel) are pooled from three independent experiments with a total of eight WT and nine DKO recipients; various combinations of CD45.1 and CD45.2 were used to distinguish donor and recipient cells. Horizontal lines indicate the mean and error bars represent s.d. **P < 0.01 (Student's t‐test).
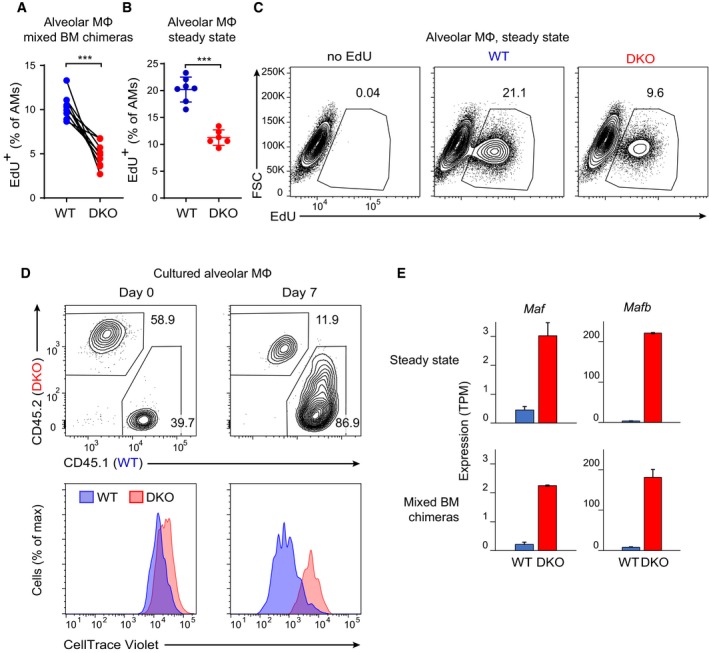
- A
Mixed WT:DKO BM chimeras established as in Fig 2A were injected with EdU on three consecutive days. EdU incorporation was analyzed 1 day after the last injection. Results pooled from two independent experiments; nine BM chimeras were analyzed in total. ***P < 0.001 (Student's t‐test).
- B, C
Steady‐state WT and DKO mice were injected with EdU and analyzed as in (A). Representative flow cytometry plots of EdU incorporation by AMs (C) and their quantification (results pooled from two independent experiments, seven WT and six DKO mice were analyzed in total) (B) are shown. Horizontal lines indicate the mean, error bars represent s.d. ***P < 0.001 (Student's t‐test).
- D
WT (CD45.1) and DKO (CD45.2) AMs were sorted, mixed in a 1:1 ratio, labeled with CellTrace Violet, and cultured in the presence of GM‐CSF. The ratio of CD45.1 and CD45.2 cells and CellTrace Violet dilution was analyzed prior to culture (day 0) and after 7 days of culture as described in Materials and Methods. Results representative of two independent experiments.
- E
RNA‐seq analysis of Maf and Mafb expression in WT and DKO AMs, which were isolated by flow cytometry from mice in steady state (top) or from mixed BM chimeras (bottom). Error bars represent s.e.m.; two biological replicates per genotype.

Lack of Bhlhe40 and Bhlhe41 does not affect in vitro survival of AMs. Frequency of dead cells, as measured by Fixable Viability Dye eFluor™780 staining (performed prior to harvesting as described in Materials and Methods), among WT and DKO AMs cultured for 5 days in the presence of GM‐CSF. Datapoints represent biological replicates; horizontal lines indicate the mean, error bars represent s.d.; cells from four WT and five DKO mice were analyzed. Results representative of two independent experiments.
Decreased expression of proliferation‐related genes by DKO AMs and peritoneal macrophages. Gene set enrichment analysis using proliferation‐related signature gene sets from MSigDB (HALLMARK_G2M_CHECKPOINT and HALLMARK_E2F_TARGETS) on dataset ranked by DKO/WT fold change in steady‐state AM (top) and peritoneal macrophage (bottom) RNA‐seq data.
DKO mice do not develop lung proteinosis. Titer of the Surfactant Pulmonary Associated Protein D (SP‐D) in BAL fluid of mice with the indicated genotypes, as measured by ELISA; BAL fluid from three WT, three DKO and one Csf2rb −/− Csf2rb2 −/− mice was analyzed.
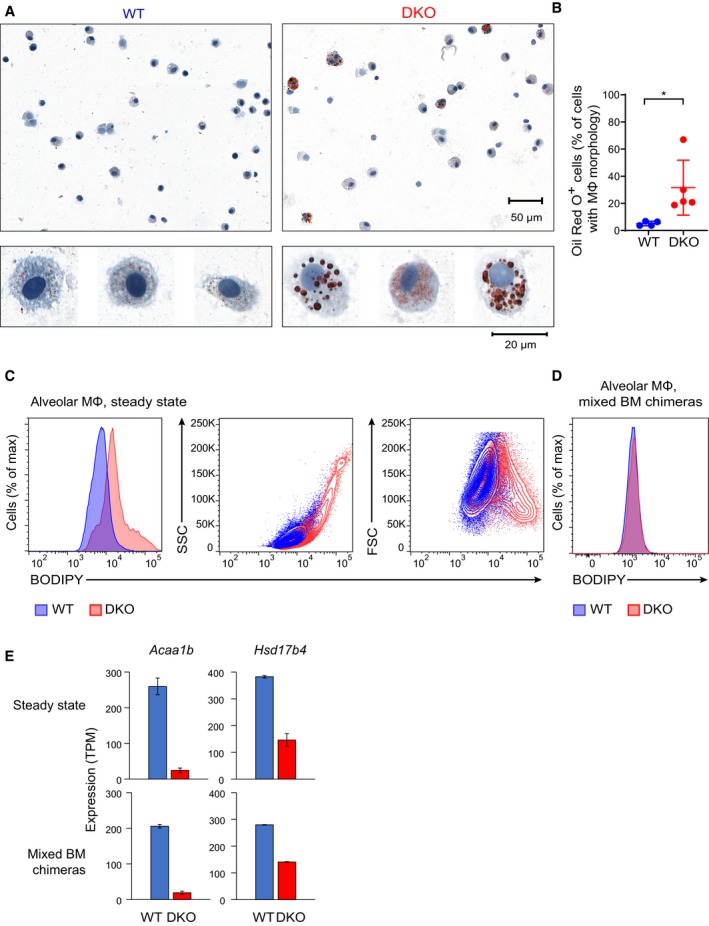
Staining of bronchoalveolar lavage cytospins from WT and DKO mice with the lipophilic dye Oil Red O. Representative results of two independent experiments.
Quantification of Oil Red O‐positive cells in WT and DKO mice for individual animals. Horizontal lines indicate the mean and error bars represent s.d. *P < 0.05 (Student's t‐test). Results pooled from two independent experiments; four WT and five DKO mice were analyzed in total.
Flow cytometric analysis of AMs from WT and DKO mice stained with the lipophilic dye BODIPY 493/503. Representative results of two independent experiments with three mice per group.
Analysis as in (C) performed with WT:DKO mixed BM chimeras. Gating on CD45.1 and CD45.2 was applied to identify cells of WT and DKO donor origin. Representative results of two independent experiments with at least three chimeras.
RNA‐seq analysis of Acaa1b and Hsd17b4 expression in WT and DKO AMs, which were isolated by flow cytometry from mice in steady state (top) or from mixed BM chimeras (bottom). Error bars represent s.e.m.; two biological replicates per genotype.

- A, B
Surface expression of CD45, CD11b, F4/80, Ly6c, CD11c, and Siglec F proteins as well as of Bhlhe40 and Bhlhe41 (in comparison with control Cd8a staining) mRNA was assessed in E17.5 liver and lung cells as well as in digested postnatal day 2 (P2) and adult (7.5 weeks) lungs. (A) Cells from digested lungs were pre‐gated for CD45 expression (not shown), gated on CD11b+F4/80int cells as indicated, and expression of Bhlhe40, Bhlhe41, and Cd8a (negative control) was plotted against the indicated myeloid markers. (B) Expression of Bhlhe40 (top) and Bhlhe41 (bottom) by E17.5 fetal liver and fetal lung CD45+CD11b+Ly6c+ monocytes and P2 alveolar macrophages (CD45+CD11b+CD11c+Siglec F+). Solid black line—staining for Cd8a in these populations (the same control staining used for top and bottom rows). (A, B) Results representative of two independent experiments.
- C
Expression of Bhlhe40 and Bhlhe41 in AMs, deficient for key regulators of their development (data from published datasets of Csf2rb −/− (GSE60528; three replicates per genotype), Itgax Cre Pparg fl/fl (GSE60249; two replicates per genotype), and Itgax Cre Tgfbr2 fl/fl (E‐MTAB‐6028; four replicates per genotype) AMs. Horizontal lines indicate the mean and error bars represent s.d.
- D
Sorted fetal liver monocytes were cultured for 24 h in the presence of recombinant TGF‐β1 or a blocking anti‐TGF‐β1 antibody, and the Bhlhe40 and Bhlhe41 expression (normalized to Pol2) was measured by RT–qPCR. Each data point represents a biological replicate; cells from five mice were analyzed. Horizontal lines indicate the mean and error bars represent s.d. **P < 0.01 (Student's t‐test). Results representative of two independent experiments.

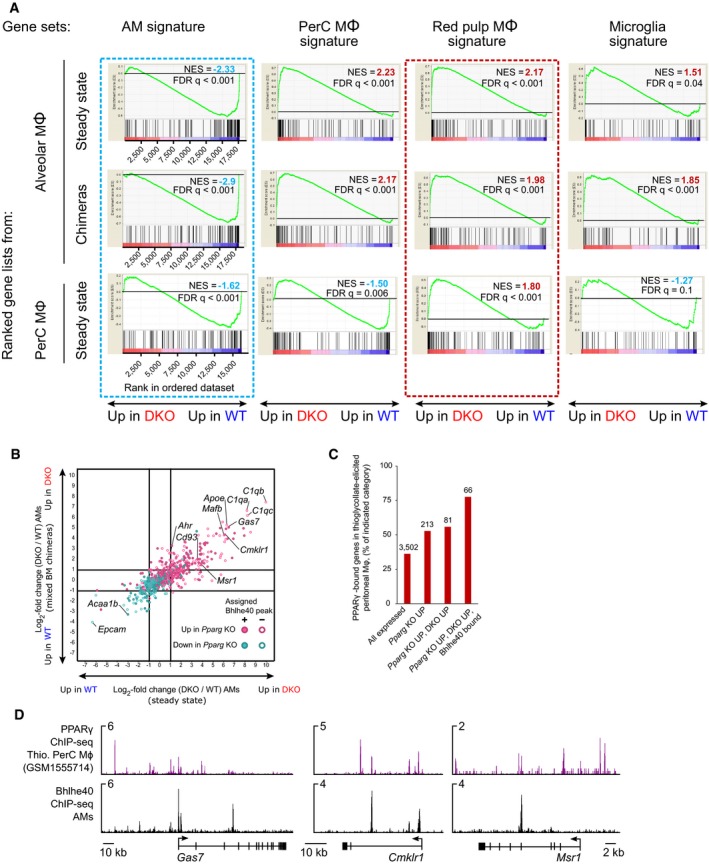
Comparison of changes in gene expression induced by Bhlhe40/Bhlhe41 deficiency in steady‐state knockout mice (horizontal axis) and in mixed BM chimeras (vertical axis). Log2‐transformed DKO/WT fold changes are plotted. Genes with expression of > 5 TPM in at least one of the samples are displayed. Genes highlighted in magenta indicate known and putative regulators of AMs. Closed symbols—Bhlhe40‐bound genes (Bhlhe40 ChIP‐seq peak assigned to the nearest gene within a 50 kb window). Open symbols—genes without Bhlhe40 binding.
Presence of RNA transcripts (RNA‐seq; top) at the Gas7 and Acaa1b genes in WT and DKO AMs; the ChIP‐seq analysis of H3K27 acetylation in WT and DKO AMs (middle) and Bhlhe40 binding in WT AMs (bottom). All analyses performed with ex vivo AMs.
Consensus Bhlhe40‐binding motif identified by de novo motif discovery (MEME‐ChIP suite; E‐value, 8.6 × 10−121).
Distribution of Bhlhe40 peaks at intergenic regions, the gene body or the promoter in AMs.
Gene set enrichment analysis (GSEA) on dataset ranked by DKO/WT fold change in steady‐state AM RNA‐seq using set of genes assigned to top 1,000 Bhlhe40 peaks (ranked by P value) (left) or a random set of 1,000 genes (right). Similar results were obtained with all three random sets tested. NES—normalized enrichment score. FDR—false discovery rate.
Pairwise comparison of H3K27 acetylation in WT and DKO AMs performed on 2‐kb regions around the Bhlhe40 peak summits [right—for all Bhlhe40 peaks called with P value of < 10−10; center—for top 3,000 Bhlhe40 peaks (ranked by P value)] and around WT AM ATAC‐seq peaks (Immgen) that did not have a Bhlhe40 peak in their close proximity (filtered as described in Materials and Methods) (left). Volcano plots show adjusted P values (vertical axes) and log2 fold change (horizontal axes) for H3K27ac pairwise comparison in WT vs. DKO AMs; genes assigned to some of the Bhlhe40‐binding regions are labeled on the left plot.

Presence of RNA transcripts (RNA‐seq; top) at Cd93 and Vcam1 genes in WT and DKO AMs and the ChIP‐seq analysis of H3K27 acetylation in WT and DKO AMs (middle) and Bhlhe40 binding in WT AMs at these loci (bottom).
Gene set enrichment analysis (GSEA) on dataset ranked by DKO/WT fold change in steady‐state AM RNA‐seq using set of genes assigned to all Bhlhe40 peaks called with P value of < 10−10 (left) or the 1,000 lowest‐ranking Bhlhe40 peaks (ranked by P value) (right). NES—normalized enrichment score. FDR False Discovery Rate.
Frequency of genes up‐ (red; DKO/WT log2 fold change > 1; adjusted P value < 0.05) or downregulated (blue; DKO/WT log2 fold change < −1; adjusted P value < 0.05) among genes assigned to all Bhlhe40 peaks called with P value of < 10−10, assigned to Bhlhe40 peaks binned as indicated by peak P value, all expressed genes, or expressed genes without assigned Bhlhe40 peaks. Only genes expressed by AMs (TPM > 5 at least in one AM sample) were included for all the categories. For genes assigned to multiple Bhlhe40 peaks, only the assignment to the highest‐ranking peak was taken into consideration. P values—Fisher's exact test, comparison of each category with genes without assigned Bhlhe40 peak. N.S.—not significant (P > 0.05).
Frequency of regions (±1 Kb of Bhlhe40 or ATAC‐seq peak center) with DKO‐increased (red; DKO/WT log2 fold change > 0.5; adjusted P value < 0.05) or DKO‐decreased (blue; DKO/WT log2 fold change < −0.5; adjusted P value < 0.05) H3K27ac as determined by pairwise comparison for all Bhlhe40 peaks called with P value of < 10−10, Bhlhe40 peaks binned as indicated by peak P value, all ATAC‐seq peaks (Immgen) or ATAC‐seq peaks without Bhlhe40 peaks in their close proximity.
Presence of RNA transcripts (RNA‐seq; top) at Maf and Mafb genes in WT and DKO AMs and the ChIP‐seq analysis of H3K27 acetylation in WT and DKO AMs (middle) and Bhlhe40 binding in WT AMs at these loci (bottom). Red boxes indicate distant enhancers that show Bhlhe40 binding and increased H3K27ac in DKO cells.

Comparison of changes in gene expression induced by Bhlhe40/Bhlhe41 deficiency in steady‐state knockout mice (horizontal axis) and in mixed BM chimeras (vertical axis) as shown in Fig 5A, but filtered for the indicated signatures (no TPM filter applied). Closed symbols—genes with associated Bhlhe40 binding (as in Fig 5A) revealed by ChIP‐seq. Open symbols—genes without Bhlhe40 binding. Insets show Bhlhe40 ChIP‐seq track for selected dysregulated genes.
Flow cytometric comparison of expression of the indicated cell‐surface markers (identified in panel A) on WT and DKO AMs. A narrow forward/side scatter gate was applied to correct for possible differences in autofluorescence. Representative results of two independent experiments with three and four mice per group.
Gene set enrichment analysis using signatures of the indicated tissue‐resident macrophage populations as gene sets on RNA‐seq datasets ranked by DKO/WT fold change in steady‐state AM (top), mixed BM chimeras (middle) and steady‐state peritoneal macrophage (bottom).
Fold change/fold change plot as shown in Fig 5A. Genes that changed their expression in Cd11c‐Cre Pparg fl/fl AMs compared to their control counterparts (GSE60249) are shown. The direction of the change and Bhlhe40 binding in AMs is shown as described in the inset.
Frequency of genes with PPARγ binding in thioglycollate‐elicited peritoneal macrophages (GSM1555714) within a ± 50 kb window of the gene from all genes in the indicated category. The number of genes is shown above the bars.
Comparison of binding of PPARγ in thioglycollate‐elicited peritoneal macrophages (GSM1555714) and Bhlhe40 in AMs (this study) at selected co‐repressed target genes.
Comment in
-
Transcriptional repressors as guardians of tissue macrophage identity.EMBO J. 2019 Oct 1;38(19):e103271. doi: 10.15252/embj.2019103271. Epub 2019 Sep 17. EMBO J. 2019. PMID: 31529710 Free PMC article.
References
-
- Amit I, Winter DR, Jung S (2015) The role of the local environment and epigenetics in shaping macrophage identity and their effect on tissue homeostasis. Nat Immunol 17: 18 - PubMed
-
- Aziz A, Soucie E, Sarrazin S, Sieweke MH (2009) MafB/c‐Maf deficiency enables self‐renewal of differentiated functional macrophages. Science 326: 867–871 - PubMed
Publication types
MeSH terms
Substances
Associated data
- Actions
- Actions
- Actions
- Actions
- Actions
Grants and funding
- P28841/Austrian Science Fund (FWF)/International
- 2017-01118/Vetenskapsrådet (VR)/International
- FFG-852936/Österreichische Forschungsförderungsgesellschaft (FFG)/International
- ANR-11-BSV3-0026/Agence Nationale de la Recherche (ANR)/International
- DEQ. 20110421320/Fondation pour la Recherche Médicale (FRM)/International
LinkOut - more resources
Full Text Sources
Other Literature Sources
Molecular Biology Databases
