Clinical Trial
. 2019 Nov 1;129(11):5020-5032.
doi: 10.1172/JCI128323.

T cell repertoire remodeling following post-transplant T cell therapy coincides with clinical response

Affiliations
Clinical Trial

T cell repertoire remodeling following post-transplant T cell therapy coincides with clinical response

Corey Smith et al. J Clin Invest. .

Abstract

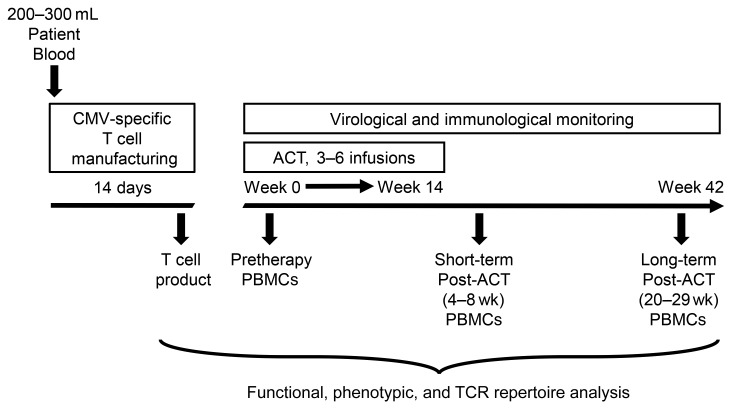
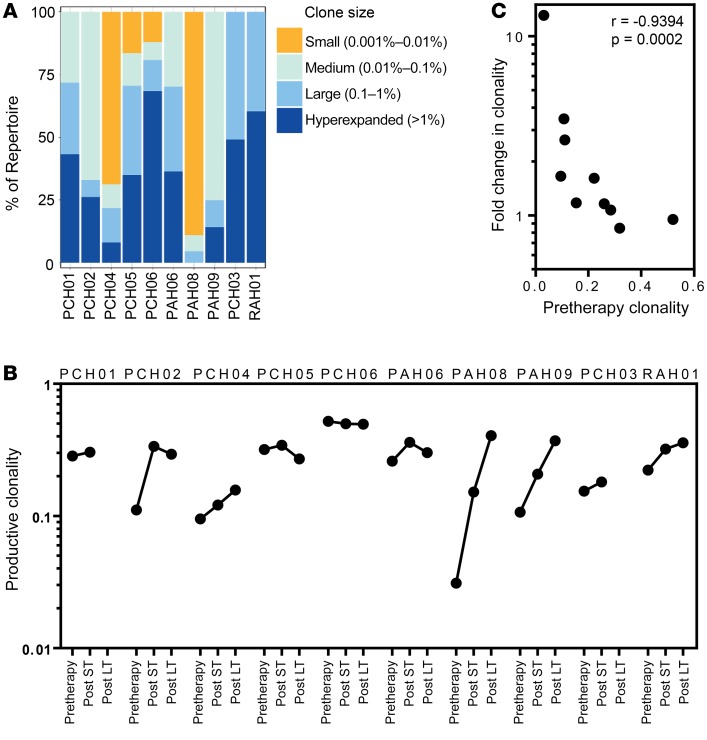
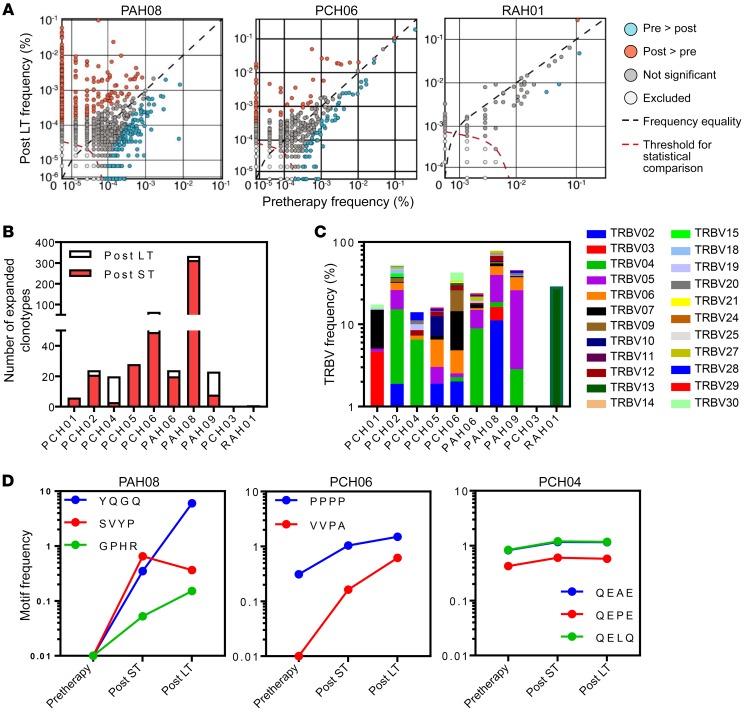
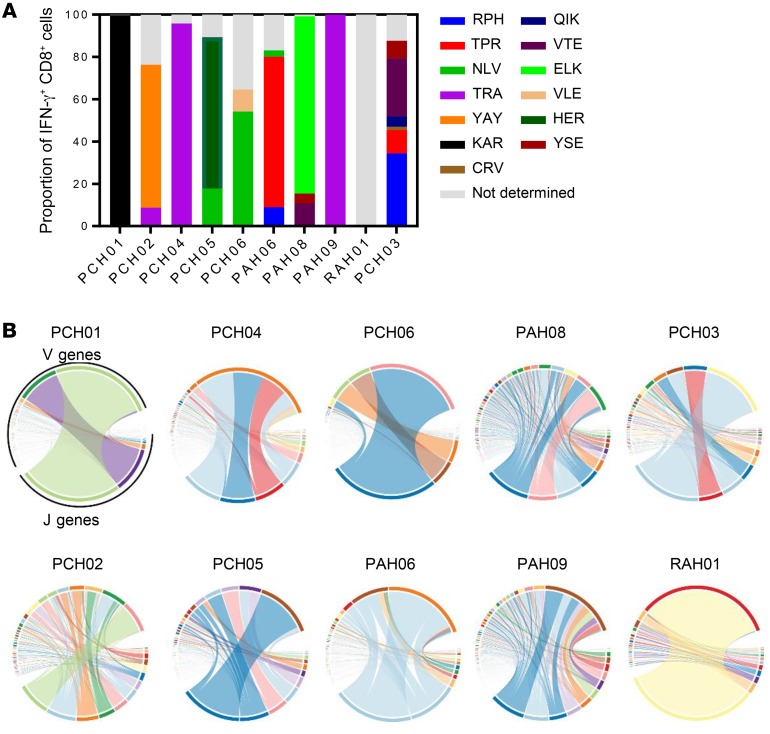
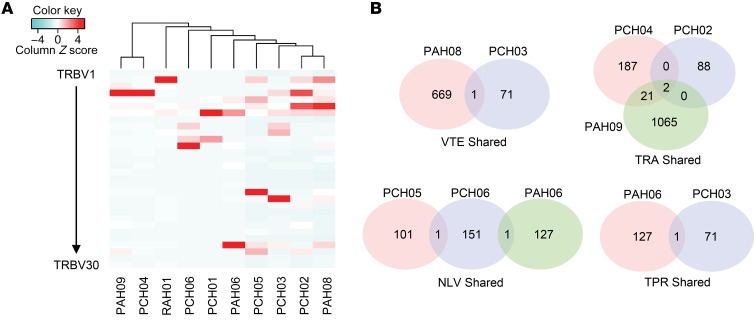
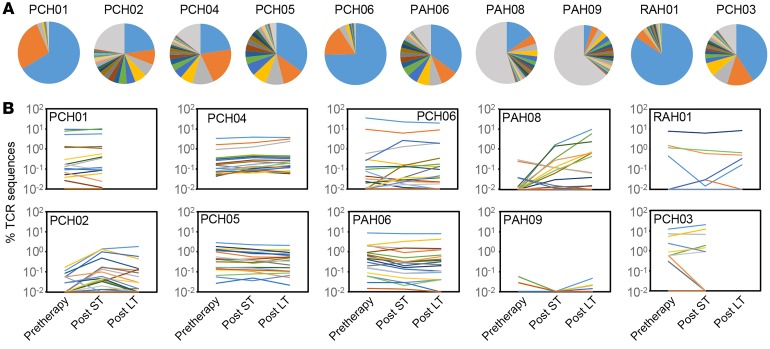
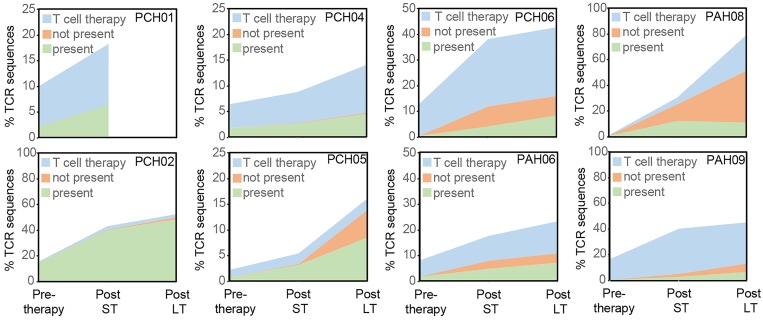
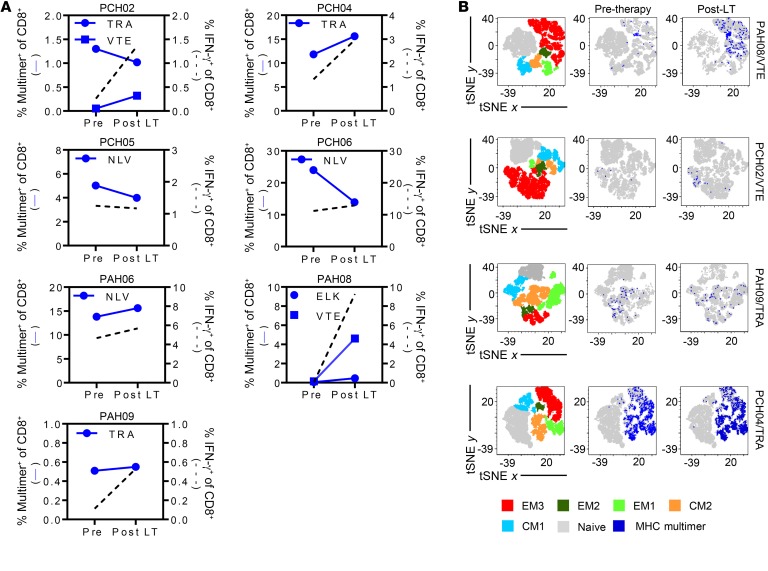
BACKGROUNDImpaired T cell immunity in transplant recipients is associated with infection-related morbidity and mortality. We recently reported the successful use of adoptive T cell therapy (ACT) against drug-resistant/recurrent cytomegalovirus in solid-organ transplant recipients.METHODSIn the present study, we used high-throughput T cell receptor Vβ sequencing and T cell functional profiling to delineate the impact of ACT on T cell repertoire remodeling in the context of pretherapy immunity and ACT products.RESULTSThese analyses indicated that a clinical response was coincident with significant changes in the T cell receptor Vβ landscape after therapy. This restructuring was associated with the emergence of effector memory T cells in responding patients, while nonresponders displayed dramatic pretherapy T cell expansions with minimal change following ACT. Furthermore, immune reconstitution included both adoptively transferred clonotypes and endogenous clonotypes not detected in the ACT products.CONCLUSIONThese observations demonstrate that immune control following ACT requires significant repertoire remodeling, which may be impaired in nonresponders because of the preexisting immune environment. Immunological interventions that can modulate this environment may improve clinical outcomes.TRIAL REGISTRATIONAustralian New Zealand Clinical Trial Registry, ACTRN12613000981729.FUNDINGThis study was supported by funding from the National Health and Medical Research Council, Australia (APP1132519 and APP1062074).

Keywords: Immunology; Immunotherapy; T cells; T-cell receptor; Transplantation.


Conflict of interest statement

Conflict of interest: CS and RK receive research and consultancy funding from Atara Biotherapeutics Inc. RK is also appointed as an advisor on the Atara Biotherapeutics Scientific Advisory Board. CS and RK hold international patents (US patent 2002312654) or patent applications (US provisional 62/340223) that cover CMV epitope sequences and their use in adoptive immunotherapy. RF has received non-financial support from Amgen Pharmaceuticals and Novartis Pharmaceuticals. SC has received non-financial support from Astellas, Merck Sharp & Dohme, Shire, and Novartis, as well as personal fees from Novartis.

Figures

Figure 1
Figure 1. Schematic representation of the study.
Autologous CMV-specific T cells were expanded in vitro for 2 weeks. Patients received up to 6 doses of autologous CMV-specific T cells over a period of 14 weeks. Patients were monitored for up to 29 weeks following the final infusion. PBMC samples preinfusion, short-term post-ACT (4–8 weeks), and long-term post-ACT (20–29 weeks) were used to assess CD8+ T cell characteristics.
Figure 2
Figure 2. CD8+ T cell clonality in SOT recipients following adoptive immunotherapy.
(A) Data represent the proportion of productive rearrangements when clones are grouped by frequency into small, medium, large, or hyperexpanded. (B) Data represent the productive clonality in SOT recipients before and after immunotherapy. (C) Data show a correlation between fold change in productive clonality long-term post-therapy and T cell clonality prior to the commencement of ACT. Significance was determined using a 2-tailed nonparametric Spearman’s correlation.
Figure 3
Figure 3. Changes in the clonotypic composition of the peripheral blood CD8+ T cell repertoire following adoptive immunotherapy.
Significant changes in the frequency of patient CD8+ T cell clonotypes following adoptive cellular therapy were determined using the immunoSEQ platform. Significance was assessed in CDR3 sequences with a minimum of 5 reads. Significance was determined using a 2-sided binomial test with Benjamini-Hochberg multiple-comparisons correction, where α = 0.01. (A) Representative analyses from 3 patients comparing the frequency of T cell clonotypes in preinfusion and long-term post-therapy blood samples. Significantly expanded clonotypes post-therapy are shown in red. Clonotypes that show a significant reduction post-therapy are shown in blue. (B) Data represent the number of clonotypes in each patient that displayed significant expansion post-therapy. (C) The frequencies of TRBV families detected in significantly expanded clonotypes from each patient, represented as a proportion of the total CD8+ T cell population. (D) GLIPH analysis was performed to determine the relationship between expanded clonotypes. Data represent CDR3 motifs enriched after immunotherapy in 3 responding patients.
Figure 4
Figure 4. Characterization of the clonotypic composition of cell therapy products.
(A) The frequency of CD8+ T cells recognizing CMV-encoded HLA-matched peptide epitopes was determined using a standard intracellular IFN-γ assay. Data represent IFN-γ–producing CD8+ T cells responding to individual peptide epitopes as a proportion of the response detected with the CMV peptide pool containing all peptide epitopes. (B) Circos plots showing the V and J gene pairings for T cell receptor β chain sequencing of therapy products. Ribbon thickness indicates number of pairings. Each color represents an individual TRBV or TRBJ family.
Figure 5
Figure 5. TRBV and CDR3 clonotypic overlap between ACT products.
(A) Heatmap showing the productive frequency of TRBV gene usage in cell therapy products. (B) The immunoSEQ platform was used to determine overlap in CDR3 sequences between patient cell therapy products that shared HLA-restricted peptide epitope responses. Venn diagrams represent the overlap between patients with an HLA-A*01:01–restricted VTE-specific response, an HLA-A*02:01–restricted NLV-specific response, an HLA-B*07:02–restricted TPR-specific response, and an HLA-C*06:02–restricted TRA-specific response.
Figure 6
Figure 6. Reconstitution of cell therapy–associated clonotypes following adoptive immunotherapy.
The 20 most prevalent CDR3 sequences in the cell therapy product from each patient were determined. (A) Colored slices in each pie chart represent the proportion of the top 20 clonotypes relative to productive clonotypes isolated from each cell therapy product. Gray slices represent CDR3 sequences that are not in the top 20 clonotypes. (B) The top 20 clonotypes from patient-specific cell therapy products were tracked over time in the corresponding patients. Colors match the CDR3 sequences in the pie charts in A.
Figure 7
Figure 7. Tracking the association between significant clonotypic expansions and presence in the cell therapy products.
The significantly expanded clonotypes from each patient (as outlined in Figure 1) were assessed for their presence in the T cell therapy products. Data represent the frequency of significantly expanded clonotypes associated with the T cell therapy (T cell therapy), present pretherapy but not detected in the cell therapy (Present), and not present pretherapy and not detected in the cell therapy (Not present).
Figure 8
Figure 8. CMV-specific T cell frequency and phenotype following ACT.
The frequency and phenotype of CMV-specific T cells pretherapy and at long-term follow-up were assessed using HLA-matched MHC multimer analysis and the expression of CD27, CD28, CD45RA, CD57, CCR7, and CD95. (A) Data represent the frequency of HLA-matched MHC multimer–specific T cells (left axis) overlaid with the frequency of CMV-specific IFN-γ–producing CD8+ T cells (right axis). (B) Concatenated files were prepared from patient samples at each time point and tSNE analysis used to establish phenotypic populations in CD8+ T cells, including naive, central memory (CM1 and CM2), and effector memory (EM1, EM2, and EM3). The gating strategy for each population and fluorescence intensity for each surface marker are shown in Supplemental Figure 3. Left panels represent the CD8+ T cell populations in 4 responding patients. Data in the middle and right panels are overlaid with the corresponding MHC multimer–specific population.
Figure 9
Figure 9. T cell phenotypic changes in SOT recipients following ACT.
Concatenated files were prepared from patient samples at each time point and tSNE analysis used to establish phenotypic populations in CD8+ T cells. (A) Data represent the proportion of memory CD8+ T cell populations in total CD8+ T cells following ACT. (B) T cell polyfunctionality was assessed following stimulation with the CMV peptide pool used to generate the cell therapy. Polyfunctional cells were defined as those T cells exhibiting 2 or more functions (typically IFN-γ+CD107a+TNF+/–). Monofunctional cells were those capable of producing only 1 function (typically IFN-γ+). Data represent the proportion of polyfunctional or monofunctional CD8+ T cells.

Similar articles

Cited by

References

    1. Crough T, Khanna R. Immunobiology of human cytomegalovirus: from bench to bedside. Clin Microbiol Rev. 2009;22(1):76–98. doi: 10.1128/CMR.00034-08. - DOI - PMC - PubMed
    1. Cannon MJ, Schmid DS, Hyde TB. Review of cytomegalovirus seroprevalence and demographic characteristics associated with infection. Rev Med Virol. 2010;20(4):202–213. doi: 10.1002/rmv.655. - DOI - PubMed
    1. Wang EC, Moss PA, Frodsham P, Lehner PJ, Bell JI, Borysiewicz LK. CD8highCD57+ T lymphocytes in normal, healthy individuals are oligoclonal and respond to human cytomegalovirus. J Immunol. 1995;155(10):5046–5056. - PubMed
    1. Bitmansour AD, et al. Clonotypic structure of the human CD4+ memory T cell response to cytomegalovirus. J Immunol. 2001;167(3):1151–1163. doi: 10.4049/jimmunol.167.3.1151. - DOI - PubMed
    1. Casazza JP, et al. Acquisition of direct antiviral effector functions by CMV-specific CD4+ T lymphocytes with cellular maturation. J Exp Med. 2006;203(13):2865–2877. doi: 10.1084/jem.20052246. - DOI - PMC - PubMed

Publication types

Substances