. 2019 Sep 19;4(18):e126345.
doi: 10.1172/jci.insight.126345.

ROR1-CAR T cells are effective against lung and breast cancer in advanced microphysiologic 3D tumor models

Affiliations

ROR1-CAR T cells are effective against lung and breast cancer in advanced microphysiologic 3D tumor models

Lars Wallstabe et al. JCI Insight. .

Abstract

Solid tumors impose immunologic and physical barriers to the efficacy of chimeric antigen receptor (CAR) T cell therapy that are not reflected in conventional preclinical testing against singularized tumor cells in 2-dimensional culture. Here, we established microphysiologic three-dimensional (3D) lung and breast cancer models that resemble architectural and phenotypical features of primary tumors and evaluated the antitumor function of receptor tyrosine kinase-like orphan receptor 1-specific (ROR1-specific) CAR T cells. 3D tumors were established from A549 (non-small cell lung cancer) and MDA-MB-231 (triple-negative breast cancer) cell lines on a biological scaffold with intact basement membrane (BM) under static and dynamic culture conditions, which resulted in progressively increasing cell mass and invasive growth phenotype (dynamic > static; MDA-MB-231 > A549). Treatment with ROR1-CAR T cells conferred potent antitumor effects. In dynamic culture, CAR T cells actively entered arterial medium flow and adhered to and infiltrated the tumor mass. ROR1-CAR T cells penetrated deep into tumor tissue and eliminated multiple layers of tumor cells located above and below the BM. The microphysiologic 3D tumor models developed in this study are standardized, scalable test systems that can be used either in conjunction with or in lieu of animal testing to interrogate the antitumor function of CAR T cells and to obtain proof of concept for their safety and efficacy before clinical application.

Keywords: Breast cancer; Immunology; Immunotherapy; Lung cancer; Oncology.


Conflict of interest statement

Conflict of interest: MH is an inventor on patents related to chimeric antigen receptor technologies that have been filed by the Fred Hutchinson Cancer Research Center (Seattle, Washington, USA) and the Julius Maximilians University Würzburg (Würzburg, Germany).

Figures

Figure 1
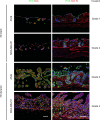
Figure 1. Invasive growth of A549 lung cancer and MDA-MB-231 breast cancer in 3D culture.
The tumor cell lines A549 (lung cancer) and MDA-MB-231 (breast cancer) were cultured on SISmuc scaffolds under static and dynamic culture conditions. Tumor composition and architecture were evaluated by immunofluorescence staining Left column: pan-cytokeratin (PCK, shown in green) and vimentin (Vim, shown in red). Nuclei are counterstained with DAPI (blue). Right column: PCK (green) and collagen IV (Col IV, red). Nuclei are counterstained with DAPI (blue). Scale bars: 100 μm (lower images, representative for all images of a column). Grading was performed according to the scheme presented in Table 1.
Figure 2
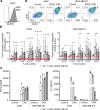
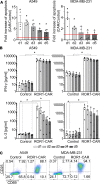
Figure 2. ROR1-CAR T cells induce apoptosis of 3D lung cancer and breast cancer in static culture.
(A) Expression of truncated epidermal growth factor receptor (EGFRt) transduction marker on CD8+ ROR1-CAR T cells before functional testing. ΔMFI depicts the difference in geometric mean fluorescence intensity between ROR1-CAR T cells and unmodified control T cells. (B) Quantification of apoptosis induced by ROR1-CAR T cell treatment with increasing CD8+ T cell numbers for 72 hours. Apoptosis was measured with M30 ELISA from supernatants collected at the indicated time points and is presented as fold change compared with the respective control T cell treatment (red line). n = 4. Data are presented as arithmetic mean ± SD, Wilcoxon’s rank-sum test: *P < 0.05. (C) ELISA-based quantification of IFN-γ and IL-2 from supernatants collected at the indicated time points from static tumor models treated with 1 × 10⁶ T cells for 72 hours. Data are presented as arithmetic mean of 3 cell crowns ± SD. n = 1 experiment. (D) Expression of CD25 and CD69 on CD8+ ROR1-CAR T cells and unmodified control T cells at the end of the 72-hour analysis period in the static tumor model. One representative plot of n = 3 experiments is shown.
Figure 3
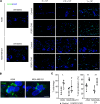
Figure 3. ROR1-CAR T cells migrate into tumor tissue and proliferate in static 3D culture.
(A) Immunofluorescence staining of lymphocyte marker CD45 (green) on paraffin sections of untreated tumor models (Untreated) or tumor models treated with increasing doses (5 × 10⁴, 2.5 × 10⁵, 1 × 10⁶ cells) of unmodified CD8+ control T cells (Control) or CD8+ ROR1-CAR T cells (ROR1-CAR). Nuclei are counterstained with DAPI (blue). Scale bar: 50 μm. (B) Close-up of CD45 immunofluorescence staining (green) on paraffin sections of CD8+ ROR1-CAR T cell–treated 3D tumor models. Nuclei are counterstained with DAPI (blue). Scale bar: 10 μm. (C) Mean number of T cells per image and proliferation of T cells in static 3D tumor models treated with 5 × 10⁴ unmodified CD8+ control T cells (Control) or CD8+ ROR1-CAR T cells (ROR1-CAR) assessed by quantification of Ki67/CD45 immunofluorescence double staining. CD45+ and Ki67+CD45+ cells were counted in 10 images per condition. n = 4. Data are presented as arithmetic mean ± SD, 2-tailed Student’s t test: *P < 0.05; **P < 0.01.
Figure 4
Figure 4. Variations in ROR1-CAR targeting domain affect antitumor function in 3D lung cancer models.
(A) Quantification of apoptosis induced by ROR1-CAR T cells with either 2A2 or R12 targeting domains during 72-hour treatment with increasing CD8+ T cell dose (5 × 10⁴, 2.5 × 10⁵, 1 × 10⁶). Apoptosis was measured with M30 ELISA from supernatants collected at the indicated time points and is presented as fold change compared with the same dose of control T cells (red line). Data are presented as arithmetic mean of 3 cell crowns ± SD. n = 1 experiment. (B) ELISA-based quantification of IFN-γ and IL-2 from supernatants collected at the indicated time points from static tumor models treated with increasing CD8+ T cell numbers for 72 hours. Data are presented as arithmetic mean of 3 cell crowns ± SD. n = 1 experiment. (C) Expression of CD25 and CD69 on CD8+ ROR1-CAR T cells and unmodified control T cells at the end of the 72-hour analysis period in the static tumor model. One representative plot of 3 cell crowns from n = 1 experiment is shown.
Figure 5
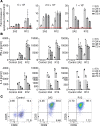
Figure 5. ROR1-CAR T cells induce tumor cell apoptosis of 3D lung and breast cancer in dynamic culture.
(A) Quantification of apoptosis induced by ROR1-CAR T cells during 5 days of treatment. Apoptosis was measured with M30 ELISA from supernatants collected at the indicated time points and is presented as fold change compared with the respective control T cell treatment (red line). n = 4. Data are presented as arithmetic mean ± SD, Wilcoxon’s rank-sum test: *P < 0.05. (B) ELISA-based quantification of IFN-γ and IL-2 from supernatants collected over time from dynamic tumor models treated with T cells for 5 days. n = 4. Data are presented as arithmetic mean ± SD, Wilcoxon’s rank-sum test: *P < 0.05. (C) After 5 days of treatment, CD8+ T cells were analyzed for expression of CD25 and CD69 by flow cytometry. One representative plot of n = 4 experiments is shown.
Figure 6
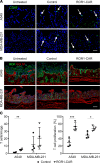
Figure 6. ROR1-CAR T cells migrate into tumor tissue and induce tumor cell lysis in a dynamic 3D culture.
(A) Immunofluorescence staining of CD45 (green) on paraffin sections of dynamic tumor models treated with control or ROR1-CAR T cells. White arrows mark T cells that had migrated into the tissue matrix. Nuclei are counterstained with DAPI (blue). Scale bar: 100 μm. (B) Immunofluorescence double staining of PCK (green) and Col IV (red) on paraffin sections of untreated dynamic tumor models as well as tumor models treated with CD4+ and CD8+ untransduced control T cells or CD4+ and CD8+ ROR1-CAR T cells with a total T cell number of 1 × 10⁷ per condition. Scale bar: 100 μm. (C) Mean number of T cells per image and T cell proliferation assessed by quantification of Ki67/CD45 immunofluorescence double staining. CD45+ and Ki67+CD45+ cells were counted in 10 images per condition. n = 4. Data are presented as arithmetic mean ± SD, 2-tailed Student’s t test: *P < 0.05; **P < 0.01; ***P < 0.001.

Similar articles

Cited by

References

    1. Turtle CJ, et al. CD19 CAR-T cells of defined CD4+:CD8+ composition in adult B cell ALL patients. J Clin Invest. 2016;126(6):2123–2138. doi: 10.1172/JCI85309. - DOI - PMC - PubMed
    1. Neelapu SS, et al. Axicabtagene ciloleucel CAR T-cell therapy in refractory large B-cell lymphoma. N Engl J Med. 2017;377(26):2531–2544. doi: 10.1056/NEJMoa1707447. - DOI - PMC - PubMed
    1. Maude SL, et al. Tisagenlecleucel in children and young adults with B-cell lymphoblastic leukemia. N Engl J Med. 2018;378(5):439–448. doi: 10.1056/NEJMoa1709866. - DOI - PMC - PubMed
    1. Hudecek M, et al. The B-cell tumor-associated antigen ROR1 can be targeted with T cells modified to express a ROR1-specific chimeric antigen receptor. Blood. 2010;116(22):4532–4541. doi: 10.1182/blood-2010-05-283309. - DOI - PMC - PubMed
    1. Hudecek M, et al. Receptor affinity and extracellular domain modifications affect tumor recognition by ROR1-specific chimeric antigen receptor T cells. Clin Cancer Res. 2013;19(12):3153–3164. doi: 10.1158/1078-0432.CCR-13-0330. - DOI - PMC - PubMed

Publication types

MeSH terms

Substances