

Pulse transit time estimation of aortic pulse wave velocity and blood pressure using machine learning and simulated training data
- PMID: 31415554
- PMCID: PMC6711549
- DOI: 10.1371/journal.pcbi.1007259
Pulse transit time estimation of aortic pulse wave velocity and blood pressure using machine learning and simulated training data
Abstract
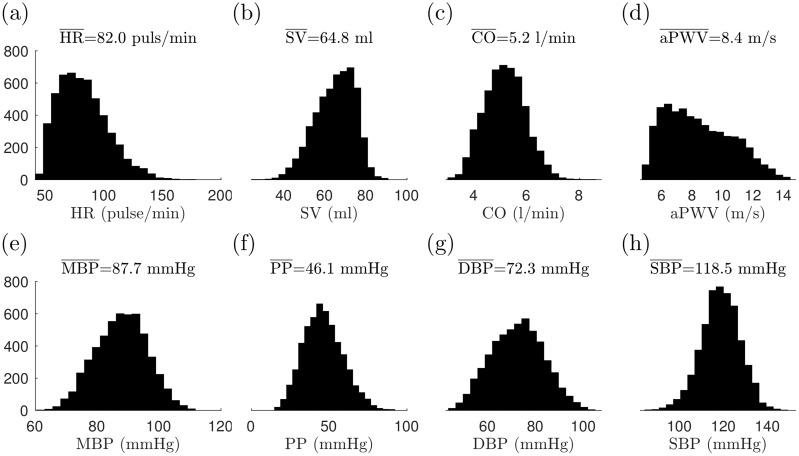
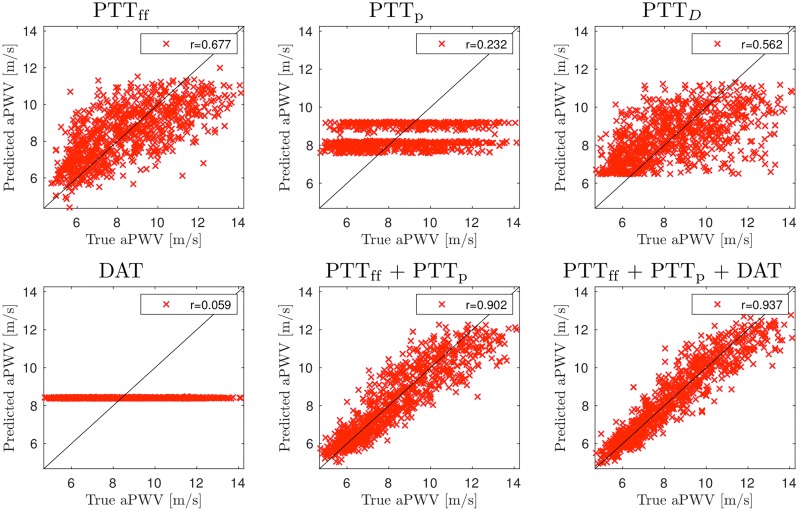
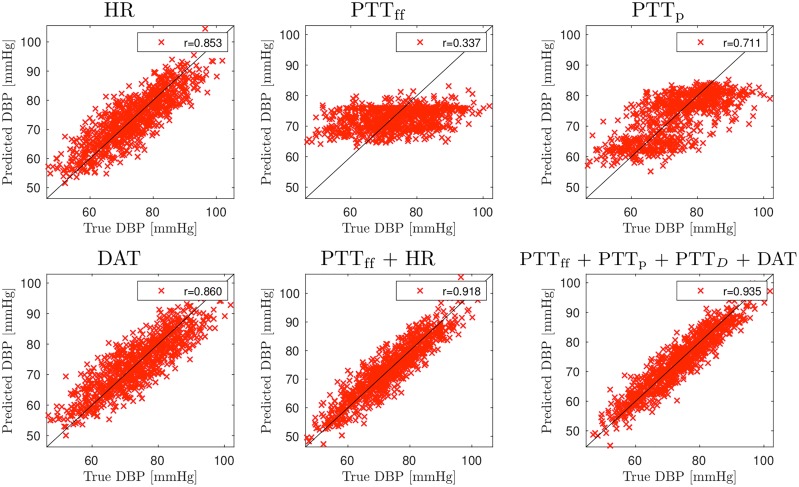
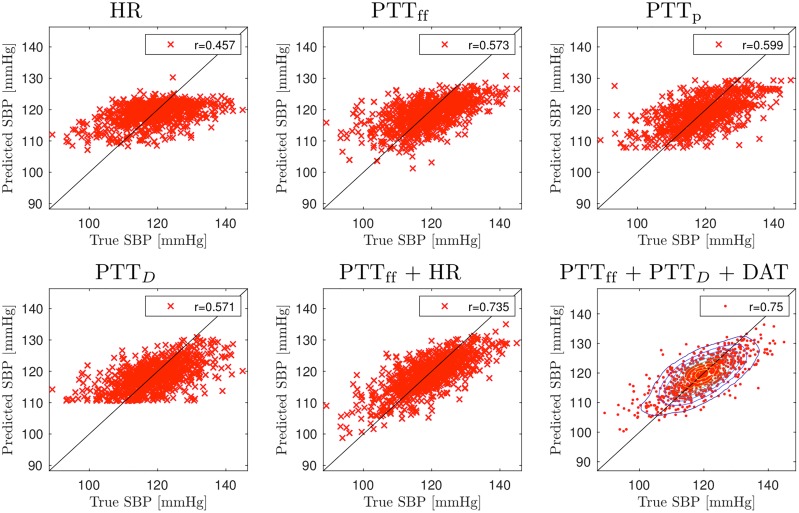
Recent developments in cardiovascular modelling allow us to simulate blood flow in an entire human body. Such model can also be used to create databases of virtual subjects, with sizes limited only by computational resources. In this work, we study if it is possible to estimate cardiovascular health indices using machine learning approaches. In particular, we carry out theoretical assessment of estimating aortic pulse wave velocity, diastolic and systolic blood pressure and stroke volume using pulse transit/arrival timings derived from photopletyshmography signals. For predictions, we train Gaussian process regression using a database of virtual subjects generated with a cardiovascular simulator. Simulated results provides theoretical assessment of accuracy for predictions of the health indices. For instance, aortic pulse wave velocity can be estimated with a high accuracy (r > 0.9) when photopletyshmography is measured from left carotid artery using a combination of foot-to-foot pulse transmit time and peak location derived for the predictions. Similar accuracy can be reached for diastolic blood pressure, but predictions of systolic blood pressure are less accurate (r > 0.75) and the stroke volume predictions are mostly contributed by heart rate.
Conflict of interest statement
Authors are employed by Nokia Bell Labs. No related patent applications have been submitted by authors. Nokia can have commercial interest in possible applications of the methods in future.
Figures
Similar articles
-
Improved pressure contour analysis for estimating cardiac stroke volume using pulse wave velocity measurement.Biomed Eng Online. 2017 Apr 24;16(1):51. doi: 10.1186/s12938-017-0341-z. Biomed Eng Online. 2017. PMID: 28438216 Free PMC article.
-
Differential impact of local and regional aortic stiffness on left ventricular remodeling: a cardiovascular magnetic resonance study.J Hypertens. 2018 Mar;36(3):552-559. doi: 10.1097/HJH.0000000000001597. J Hypertens. 2018. PMID: 29334490
-
Volume status and arterial blood pressures are associated with arterial stiffness in hemodialysis patients.Int J Artif Organs. 2018 Jul;41(7):378-384. doi: 10.1177/0391398818778212. Epub 2018 May 28. Int J Artif Organs. 2018. PMID: 29806514
-
Arterial functions: how to interpret the complex physiology.Nephrol Dial Transplant. 2010 Dec;25(12):3815-23. doi: 10.1093/ndt/gfq614. Epub 2010 Oct 14. Nephrol Dial Transplant. 2010. PMID: 20947536 Review.
-
Elastic properties and Windkessel function of the human aorta.Cardiovasc Drugs Ther. 1995 Feb;9(1):73-83. doi: 10.1007/BF00877747. Cardiovasc Drugs Ther. 1995. PMID: 7786838 Review.
Cited by
-
Mechanistic insights on age-related changes in heart-aorta-brain hemodynamic coupling using a pulse wave model of the entire circulatory system.Am J Physiol Heart Circ Physiol. 2023 Nov 1;325(5):H1193-H1209. doi: 10.1152/ajpheart.00314.2023. Epub 2023 Sep 15. Am J Physiol Heart Circ Physiol. 2023. PMID: 37712923 Free PMC article.
-
Comparison of Machine Learning Algorithms for Structure State Prediction in Operational Load Monitoring.Sensors (Basel). 2020 Dec 10;20(24):7087. doi: 10.3390/s20247087. Sensors (Basel). 2020. PMID: 33321996 Free PMC article.
-
Noninvasive estimation of aortic hemodynamics and cardiac contractility using machine learning.Sci Rep. 2020 Sep 14;10(1):15015. doi: 10.1038/s41598-020-72147-8. Sci Rep. 2020. PMID: 32929108 Free PMC article.
-
Machine-Learning Classification of Pulse Waveform Quality.Sensors (Basel). 2022 Nov 8;22(22):8607. doi: 10.3390/s22228607. Sensors (Basel). 2022. PMID: 36433203 Free PMC article.
-
Survey and Evaluation of Hypertension Machine Learning Research.J Am Heart Assoc. 2023 May 2;12(9):e027896. doi: 10.1161/JAHA.122.027896. Epub 2023 Apr 29. J Am Heart Assoc. 2023. PMID: 37119074 Free PMC article.
References
Publication types
MeSH terms
LinkOut - more resources
Full Text Sources
Other Literature Sources
