

The seasonality of diarrheal pathogens: A retrospective study of seven sites over three years
- PMID: 31415558
- PMCID: PMC6711541
- DOI: 10.1371/journal.pntd.0007211
The seasonality of diarrheal pathogens: A retrospective study of seven sites over three years
Abstract
Background: Pediatric diarrhea can be caused by a wide variety of pathogens, from bacteria to viruses to protozoa. Pathogen prevalence is often described as seasonal, peaking annually and associated with specific weather conditions. Although many studies have described the seasonality of diarrheal disease, these studies have occurred predominantly in temperate regions. In tropical and resource-constrained settings, where nearly all diarrhea-associated mortality occurs, the seasonality of many diarrheal pathogens has not been well characterized. As a retrospective study, we analyze the seasonal prevalence of diarrheal pathogens among children with moderate-to-severe diarrhea (MSD) over three years from the seven sites of the Global Enteric Multicenter Study (GEMS), a case-control study. Using data from this expansive study on diarrheal disease, we characterize the seasonality of different pathogens, their association with site-specific weather patterns, and consistency across study sites.
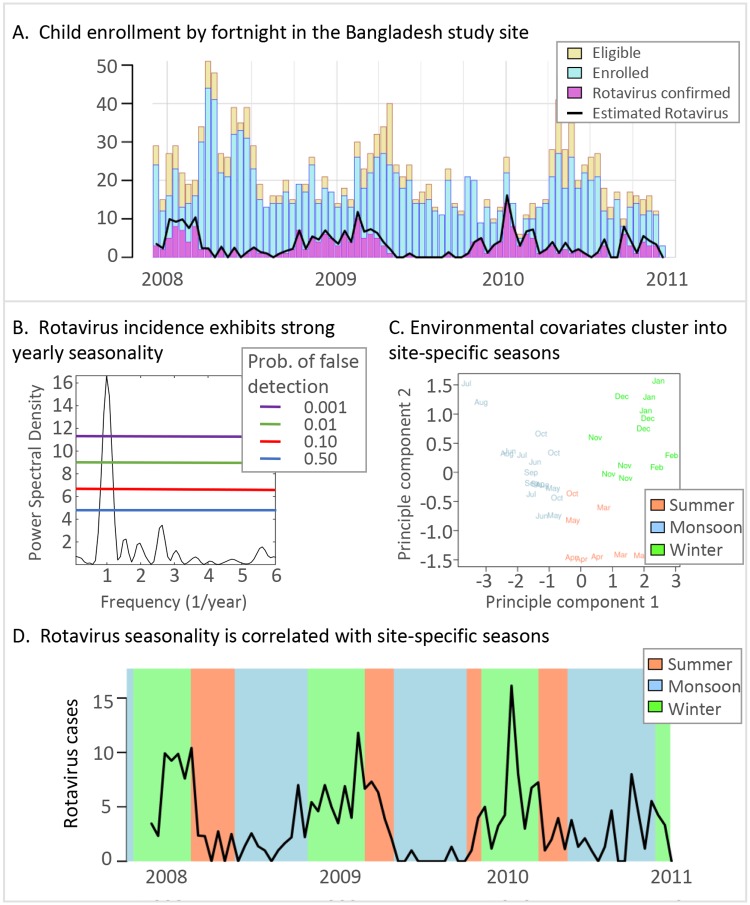
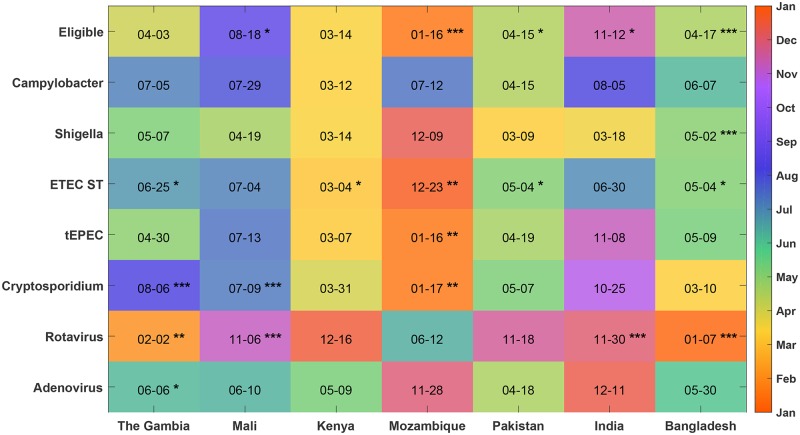
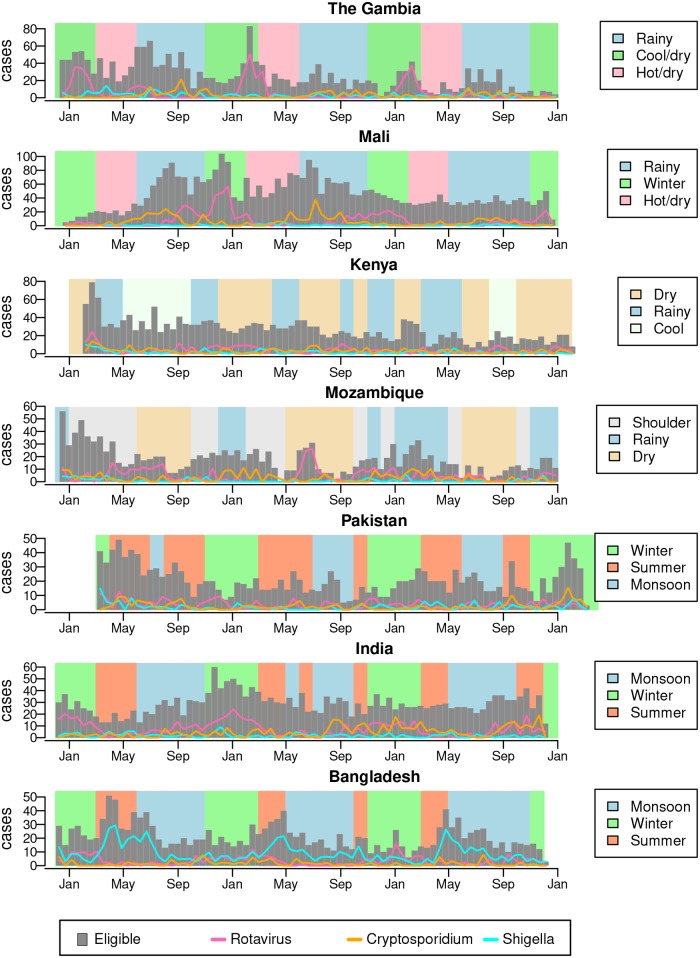
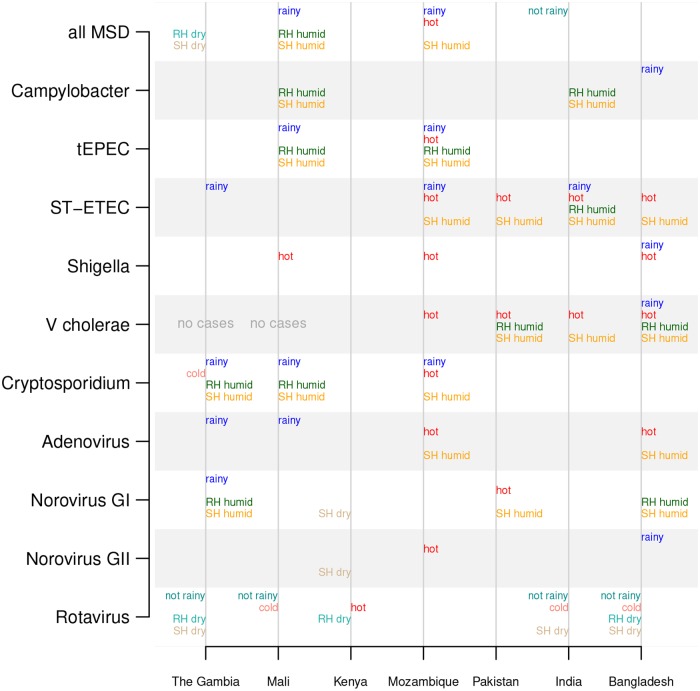
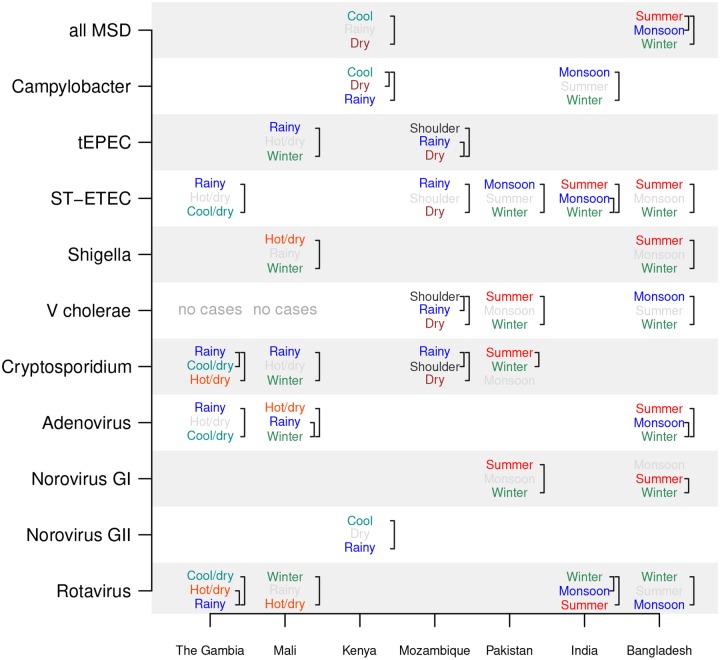
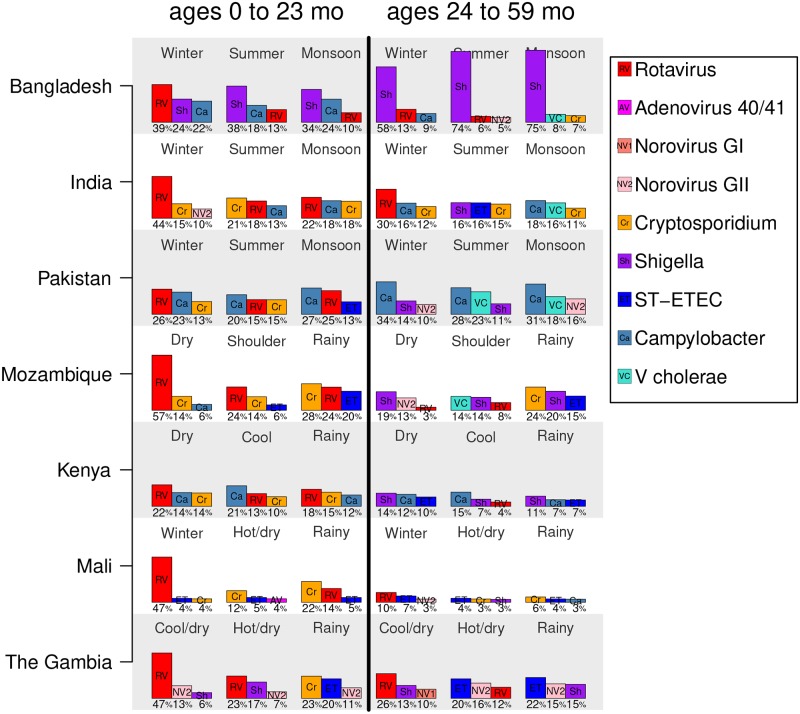
Methodology/principal findings: Using traditional methodologies from signal processing, we found that certain pathogens peaked at the same time every year, but not at all sites. We also found associations between pathogen prevalence and weather or "seasons," which are defined by applying modern machine-learning methodologies to site-specific weather data. In general, rotavirus was most prevalent during the drier "winter" months and out of phase with bacterial pathogens, which peaked during hotter and rainier times of year corresponding to "monsoon," "rainy," or "summer" seasons.
Conclusions/significance: Identifying the seasonally-dependent prevalence for diarrheal pathogens helps characterize the local epidemiology and inform the clinical diagnosis of symptomatic children. Our multi-site, multi-continent study indicates a complex epidemiology of pathogens that does not reveal an easy generalization that is consistent across all sites. Instead, our study indicates the necessity of local data to characterizing the epidemiology of diarrheal disease. Recognition of the local associations between weather conditions and pathogen prevalence suggests transmission pathways and could inform control strategies in these settings.
Conflict of interest statement
The authors have declared that no competing interests exist.
Figures
Similar articles
-
The Global Enteric Multicenter Study (GEMS) of diarrheal disease in infants and young children in developing countries: epidemiologic and clinical methods of the case/control study.Clin Infect Dis. 2012 Dec;55 Suppl 4(Suppl 4):S232-45. doi: 10.1093/cid/cis753. Clin Infect Dis. 2012. PMID: 23169936 Free PMC article.
-
Epidemiological study on infectious diarrheal diseases in children in a coastal rural area of Kenya.Microbiol Immunol. 1997;41(10):773-8. doi: 10.1111/j.1348-0421.1997.tb01925.x. Microbiol Immunol. 1997. PMID: 9403500
-
Some epidemiologic, clinical, microbiologic, and organizational assumptions that influenced the design and performance of the Global Enteric Multicenter Study (GEMS).Clin Infect Dis. 2012 Dec;55 Suppl 4(Suppl 4):S225-31. doi: 10.1093/cid/cis787. Clin Infect Dis. 2012. PMID: 23169935 Free PMC article.
-
Etiology and mechanisms of acute infectious diarrhea in infants in the United States.J Pediatr. 1991 Apr;118(4 Pt 2):S34-9. doi: 10.1016/s0022-3476(05)81423-4. J Pediatr. 1991. PMID: 2007955 Review.
-
Approach to the pediatric patient with diarrhea.Gastroenterol Clin North Am. 1993 Sep;22(3):499-516. Gastroenterol Clin North Am. 1993. PMID: 8406727 Review.
Cited by
-
Seasonal variation and etiologic inferences of childhood pneumonia and diarrhea mortality in India.Elife. 2019 Aug 27;8:e46202. doi: 10.7554/eLife.46202. Elife. 2019. PMID: 31453804 Free PMC article.
-
Can Simple Psychological Interventions Increase Preventive Health Investment?J Eur Econ Assoc. 2021 Nov 30;20(3):1001-1047. doi: 10.1093/jeea/jvab052. eCollection 2022 Jun. J Eur Econ Assoc. 2021. PMID: 35721005 Free PMC article.
-
Lactoferrin and lysozyme to promote nutritional, clinical and enteric recovery: a protocol for a factorial, blinded, placebo-controlled randomised trial among children with diarrhoea and malnutrition (the Boresha Afya trial).BMJ Open. 2024 Aug 9;14(8):e079448. doi: 10.1136/bmjopen-2023-079448. BMJ Open. 2024. PMID: 39122384 Free PMC article.
-
Environmental Exposures Associated with Enteropathogen Infection in Six-Month-Old Children Enrolled in the ECoMiD Cohort along a Rural-Urban Gradient in Northern Ecuador†.Environ Sci Technol. 2025 Jan 14;59(1):103-118. doi: 10.1021/acs.est.4c07753. Epub 2024 Dec 30. Environ Sci Technol. 2025. PMID: 39807583
-
Clinical predictors for etiology of acute diarrhea in children in resource-limited settings.PLoS Negl Trop Dis. 2020 Oct 9;14(10):e0008677. doi: 10.1371/journal.pntd.0008677. eCollection 2020 Oct. PLoS Negl Trop Dis. 2020. PMID: 33035209 Free PMC article.
References
-
- Kotloff KL, Nataro JP, Blackwelder WC, Nasrin D, Farag TH, Panchalingam S, et al. Burden and aetiology of diarrhoeal disease in infants and young children in developing countries (the Global Enteric Multicenter Study, GEMS): a prospective, case–control study. The Lancet. 2013;382(9888):209–222. 10.1016/S0140-6736(13)60844-2 - DOI - PubMed
Publication types
MeSH terms
LinkOut - more resources
Full Text Sources
Medical
Research Materials
