

Changes in visual function and retinal structure in the progression of Alzheimer's disease
- PMID: 31415594
- PMCID: PMC6695171
- DOI: 10.1371/journal.pone.0220535
Changes in visual function and retinal structure in the progression of Alzheimer's disease
Abstract
Background: Alzheimer's Disease (AD) can cause degeneration in the retina and optic nerve either directly, as a result of amyloid beta deposits, or secondarily, as a result of the degradation of the visual cortex. These effects raise the possibility that tracking ophthalmologic changes in the retina can be used to assess neurodegeneration in AD. This study aimed to detect retinal changes and associated functional changes in three groups of patients consisting of AD patients with mild disease, AD patients with moderate disease and healthy controls by using non-invasive psychophysical ophthalmological tests and optical coherence tomography (OCT).
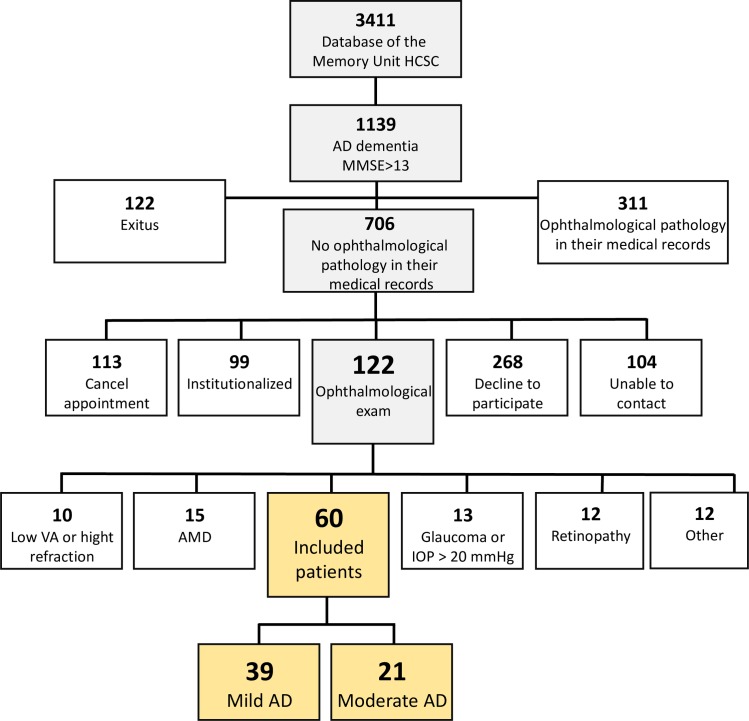
Methods: We included 39 patients with mild AD, 21 patients with moderate AD and 40 age-matched healthy controls. Both patients and controls were ophthalmologically healthy. Visual acuity, contrast sensitivity, colour perception, visual integration, and choroidal thicknesses were measured. In addition, OCT and OCT angiography (OCTA) were applied.
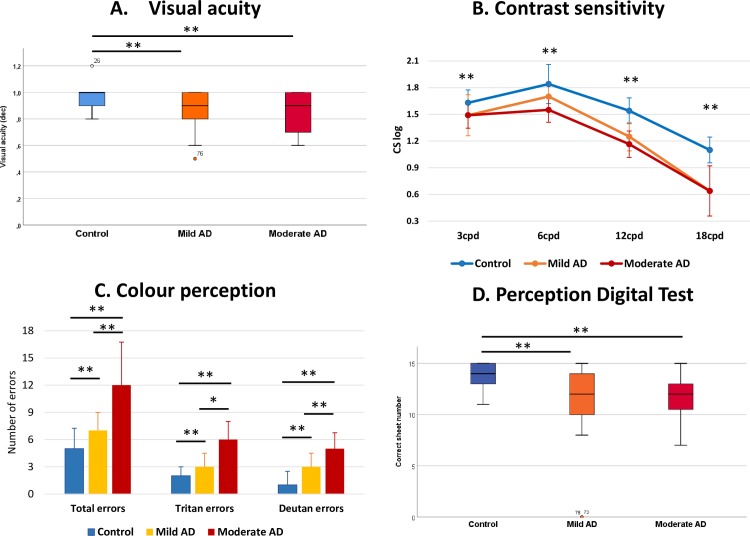
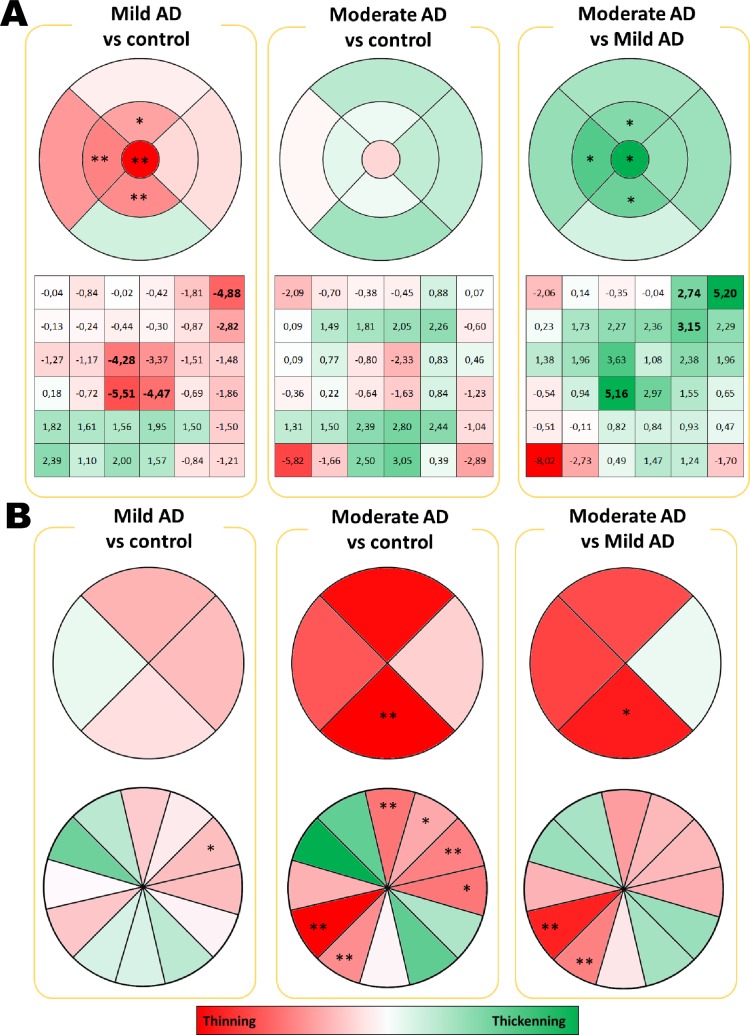
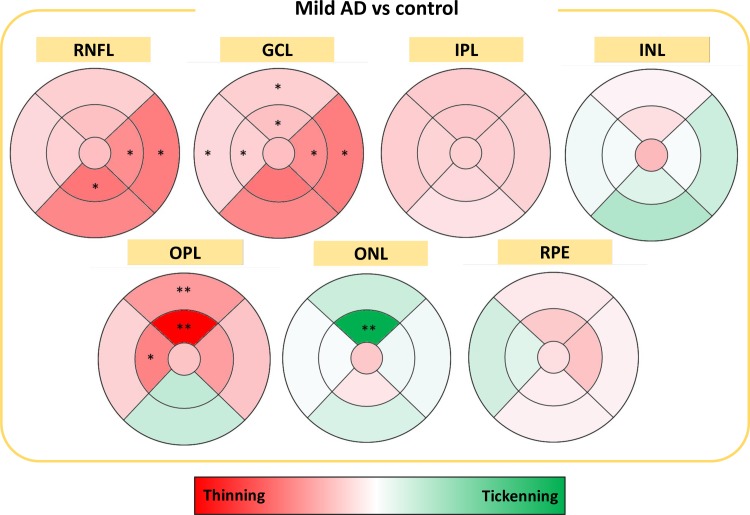
Findings: Visual acuity, contrast sensitivity, colour perception, and visual integration were significantly lower in AD patients than in healthy controls. Compared to healthy controls, macular thinning in the central region was significant in the mild AD patients, while macular thickening in the central region was found in the moderate AD group. The analysis of macular layers revealed significant thinning of the retinal nerve fibre layer, the ganglion cell layer and the outer plexiform layer in AD patients relative to controls. Conversely, significant thickening was observed in the outer nuclear layer of the patients. However, mild AD was associated with significant thinning of the subfovea and the nasal and inferior sectors of the choroid. Significant superonasal and inferotemporal peripapillary thinning was observed in patients with moderate disease.
Conclusions: The first changes in the mild AD patients appear in the psychophysical tests and in the central macula with a decrease in the central retinal thickness. When there was a disease progression to moderate AD, psychophysical tests remained stable with respect to the decrease in mild AD, but significant thinning in the peripapillary retina and thickening in the central retina appeared. The presence of AD is best indicated based on contrast sensitivity.
Conflict of interest statement
The authors have declared that no competing interests exist.
Figures
Similar articles
-
OCT in Alzheimer's disease: thinning of the RNFL and superior hemiretina.Graefes Arch Clin Exp Ophthalmol. 2017 Sep;255(9):1827-1835. doi: 10.1007/s00417-017-3715-9. Epub 2017 Jun 22. Graefes Arch Clin Exp Ophthalmol. 2017. PMID: 28643042
-
Visualization of Focal Thinning of the Ganglion Cell-Inner Plexiform Layer in Patients with Mild Cognitive Impairment and Alzheimer's Disease.J Alzheimers Dis. 2018;64(4):1261-1273. doi: 10.3233/JAD-180070. J Alzheimers Dis. 2018. PMID: 30040712
-
Choroidal thinning as a new finding in Alzheimer's disease: evidence from enhanced depth imaging spectral domain optical coherence tomography.J Alzheimers Dis. 2014;40(4):907-17. doi: 10.3233/JAD-132039. J Alzheimers Dis. 2014. PMID: 24577467
-
Spectral-Domain OCT Measurements in Alzheimer's Disease: A Systematic Review and Meta-analysis.Ophthalmology. 2019 Apr;126(4):497-510. doi: 10.1016/j.ophtha.2018.08.009. Epub 2018 Aug 13. Ophthalmology. 2019. PMID: 30114417 Free PMC article.
-
Optical coherence tomography in mild cognitive impairment - Systematic review and meta-analysis.Clin Neurol Neurosurg. 2020 Sep;196:106036. doi: 10.1016/j.clineuro.2020.106036. Epub 2020 Jun 22. Clin Neurol Neurosurg. 2020. PMID: 32623211
Cited by
-
Alzheimer's Retinopathy: Seeing Disease in the Eyes.Front Neurosci. 2020 Sep 8;14:921. doi: 10.3389/fnins.2020.00921. eCollection 2020. Front Neurosci. 2020. PMID: 33041751 Free PMC article. Review.
-
Retinal and Choroidal Changes in Men Compared with Women with Alzheimer's Disease: A Case-Control Study.Ophthalmol Sci. 2021 Dec 20;2(1):100098. doi: 10.1016/j.xops.2021.100098. eCollection 2022 Mar. Ophthalmol Sci. 2021. PMID: 36246183 Free PMC article.
-
Association between retinal markers and cognition in older adults: a systematic review.BMJ Open. 2022 Jun 21;12(6):e054657. doi: 10.1136/bmjopen-2021-054657. BMJ Open. 2022. PMID: 35728906 Free PMC article.
-
Characteristics of Normal-tension Glaucoma Patients with Temporal Retinal Nerve Fibre Defects.Sci Rep. 2020 Apr 14;10(1):6362. doi: 10.1038/s41598-020-63486-7. Sci Rep. 2020. PMID: 32286476 Free PMC article.
-
OCT Imaging in Murine Models of Alzheimer's Disease in a Systematic Review: Findings, Methodology and Future Perspectives.Biomedicines. 2024 Feb 27;12(3):528. doi: 10.3390/biomedicines12030528. Biomedicines. 2024. PMID: 38540142 Free PMC article. Review.
References
-
- Ghiso JA, Doudevski I, Ritch R, Rostagno AA. Alzheimer’s disease and glaucoma: mechanistic similarities and differences. J Glaucoma. Department of Pathology, New York University Langone Medical Center, New York, NY, USA.; 2013;22 Suppl 5: S36–8. 10.1097/IJG.0b013e3182934af6 [doi] - DOI - PMC - PubMed
-
- Calabrese V, Scapagnini G, Giuffrida Stella AM, Bates TE, Clark JB. Mitochondrial involvement in brain function and dysfunction: relevance to aging, neurodegenerative disorders and longevity. Neurochem Res. Department of Chemistry, Faculty of Medicine, University of Catania, Italy. calabres@mbox.unict.it; 2001;26: 739–764. - PubMed
-
- Martínez-Lazcano JC, Boll-Woehrlen MC, Hernández-Melesio MA, Rubio-Osornio M, Sánchez-Mendoza MA, Ríos C. Radicales libres y estrés oxidativo en las enfermedades neurodegenerativas. Mensaje Bioquim. 2010;34: 43–59.
Publication types
MeSH terms
LinkOut - more resources
Full Text Sources
Other Literature Sources
Medical
