. 2019 Aug 15;14(8):e0221372.
doi: 10.1371/journal.pone.0221372. eCollection 2019.

Universal principles of membrane protein assembly, composition and evolution

Affiliations

Universal principles of membrane protein assembly, composition and evolution

Alan J Situ et al. PLoS One. .

Abstract

Structural diversity in α-helical membrane proteins (MP) arises from variations in helix-helix crossings and contacts that may bias amino acid usage. Here, we reveal systematic changes in transmembrane amino acid frequencies (f) as a function of the number of helices (n). For eukarya, breaks in f(n) trends of packing (Ala, Gly and Pro), polar, and hydrophobic residues identify different MP assembly principles for 2≤n≤7, 8≤n≤12 and n≥13. In bacteria, the first f break already occurs after n = 6 in correlation to an earlier n peak in MP size distribution and dominance of packing over polar interactions. In contrast to the later n brackets, the integration levels of helix bundles continuously increased in the first, most populous brackets indicating the formation of single structural units (domains). The larger first bracket of eukarya relates to a balance of polar and packing interactions that enlarges helix-helix combinatorial possibilities (MP diversity). Between the evolutionary old, packing and new, polar residues f anti-correlations extend over all biological taxa, broadly ordering them according to evolutionary history and allowing f estimates for the earliest forms of life. Next to evolutionary history, the amino acid composition of MP is determined by size (n), proteome diversity, and effective amino acid cost.


Conflict of interest statement

The authors have declared that no competing interests exist.

Figures

Fig 1
Fig 1. Select membrane protein parameter as a function of n in eukarya and bacteria.
(a) Size distribution of MP. The protein count and the count of the total number of TM helices are depicted as a function of n for n≤23. (b-d) AA diversity quantified by the Shannon equitability index (EH), TM helix length (Σf, i.e., sum of f over all AA), and AA cost per TM helix in terms of high-energy phosphate bonds (ATP) are shown as a function of n for n≤19. Solid lines depict running averages calculated with a window size of two. The n range was limited because of the scarcity of MP for very large n.
Fig 2
Fig 2. Amino acid frequencies relative to the center of the membrane.
f(n,m) profiles of Asn, Trp, Tyr and Phe for eukarya and Pro for bacteria for n = 1, 2, 7 and 12. m denotes the residue number relative to the predicted TM helix center. Negative and positive m values indicate orientations toward the N- and C-terminus, respectively, and do not relate to extra- and intracellular orientations. Fixed UniRef50/Uniprot TM helix borders were used and extended by four residues on either helix side.
Fig 3
Fig 3. Illustration of uncertainties and ambiguities in transmembrane helix definitions.
(a) Comparison of TM helix predictions between UniRef50/UniProt and TMHMM 2.0 for the human free fatty acid receptor 1 (FFAR1; PDB entry 4phu). Helix 5 is shown in red and the other TM helices in blue. UniProt and TMHMM predictions of helix 5 encompass residues 179–200 and 188–210, respectively. (b) For the depicted AA, f(n) was calculated using UniProt TM borders plus Monte Carlo simulations (black), UniProt TM borders (red), and UniProt TM borders shrunk by four residues on each side (green), respectively. Solid lines show running averages calculated with a window size of two. The n range was limited to ≤19 because of the scarcity of MP for large n (Fig 1A). (c) Structure of Aquaporin from Methanothermobacter marburgensis (AqpM; PDB entry 2f2b). The intramembranous helices are colored in green and TM helices in blue. AqpM is annotated as n = 6 but its structure reveals that two short intramembrane helices combine to form the functional equivalent of a seventh TM helix. (d) Structure of the C-terminal membrane domain of the human erythrocyte anion exchanger 1 (Band 3; PDB entry 4yzf). The intramembranous helices are colored in green, discontinuous TM helices in red and regular TM helices in blue. In addition to its 12 TM helices and UniRef50/UniProt n = 12 annotation, Band 3 contains two relatively long intramembraneous helices and has been considered to have the equivalent of 14 TM helices [24]. Moreover, Band 3 exhibits two unusual, discontinuous TM helices, where helical conformation breaks down near the center of the membrane, which is then traversed in extended conformations.
Fig 4
Fig 4. Transmembrane amino acid frequencies as a function of n for eukarya and bacteria.
To illustrate f(n) trends, solid lines depict either linear fits or running averages calculated with a window size of two. The n range was limited to ≤19 because of the scarcity of MP for large n (Fig 1A). Additional taxon-specific plots are provided in S3–S7 Figs.
Fig 5
Fig 5. Transmembrane amino acid frequencies as a function of n for functional amino acid groupings.
f(n) of hydrophobic (Leu, Met, Ile, Val and Phe), polar (Cys, His, Asn, Gln, Ser and Thr), packing (Ala, Gly and Pro), anchoring (Trp, Tyr and Arg), and charged (Asp, Glu and Lys) residues were combined for each of the depicted biological taxon. Solid lines show running f(n) averages calculated with a window size of two. The n range was limited to ≤19 because of the scarcity of MP for large n (Fig 1A).
Fig 6
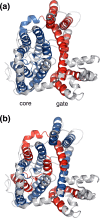
Fig 6. Domain definition in the C-terminal membrane domain of the human erythrocyte anion exchanger 1 (Band3).
Band 3 carries out chloride/bicarbonate anion exchange across the plasma membrane of erythocytes [24]. (a) A core (helices 1, 2, 3, 4, 8, 9, 10, and 11) and a gate (helices 5, 6, 7, 12, 13, and 14) domain were differentiated in Band3 [24]. (b) Nonetheless, enzymatic activity of Band3 can be reconstituted by fragments encompassing helices 1–8 and 9–14, shown in blue and red, respectively [34].
Fig 7
Fig 7. Taxa-specific correlations between pairwise amino acid frequencies (universal ratios).
The frequencies of most AA are correlated with each other and with taxonomic association. (a) In the 2≤n≤7 range, fPhe and fAla of the nine taxonomic groups shown were averaged and correlated using linear equations (S1 Table). (b) The magnitudes of the correlation coefficient, termed R, of analogous linear fX-fPhe fits are shown (S8 Fig). (c) While it is difficult to ascertain fX-fPhe non-linearity for fPhe≥1.5, differences between linear and exponential fits become pronounced for fPhe<1.5 as illustrated (see also S8 and S9 Figs and S1 and S2 Tables).
Fig 8
Fig 8. Correlation of membrane protein and evolutionary parameters with taxa-specific polar AA frequencies.
To gain insight into MP structural parameter, AA composition, and evolution, fpolar was correlated with fpacking, node number, AA diversity (EH), and AA cost for the nine taxonomic groups shown. Additionally, AA cost was correlated with TM helix length (Σf). If applicable, the examined parameters were averaged in the 2≤n≤7 range. Node numbers of taxa refer to the node numbers (number of speciation events) of corresponding model organisms shown in Table 1 and were taken from ref. [44]. AA cost refers to the AA cost per TM helix in terms of high-energy phosphate bonds (ATP) [45]. AA diversity is quantified by the Shannon equitability index (EH). TM helix length is the sum of f over all TM AA.

References

    1. Overington JP, Al-Lazikani B, Hopkins AL. Opinion—How many drug targets are there? Nat Rev Drug Discov. 2006;5(12):993–6. WOS:000242478300012. 10.1038/nrd2199 - DOI - PubMed
    1. Krogh A, Larsson B, von Heijne G, Sonnhammer ELL. Predicting transmembrane protein topology with a hidden Markov model: Application to complete genomes. J Mol Biol. 2001;305(3):567–80. WOS:000167760800017. 10.1006/jmbi.2000.4315 - DOI - PubMed
    1. Wiener MC, White SH. Structure Of A Fluid Dioleoylphosphatidylcholine Bilayer Determined By Joint Refinement Of X-Ray And Neutron-Diffraction Data.3. Complete Structure. Biophys J. 1992;61(2):434–47. ISI:A1992HC77800014. 10.1016/S0006-3495(92)81849-0 - DOI - PMC - PubMed
    1. van Meer G. Cellular lipidomics. EMBO J. 2005;24(18):3159–65. WOS:000232551600001. 10.1038/sj.emboj.7600798 - DOI - PMC - PubMed
    1. Rothman JE, Lenard J. Membrane Asymmetry. Science. 1977;195(4280):743–53. WOS:A1977CV55700006. 10.1126/science.402030 - DOI - PubMed

Publication types

MeSH terms

Substances