. 2019 Aug 15;15(8):e1007892.
doi: 10.1371/journal.ppat.1007892. eCollection 2019 Aug.

Dysregulation of M segment gene expression contributes to influenza A virus host restriction

Affiliations

Dysregulation of M segment gene expression contributes to influenza A virus host restriction

Brenda M Calderon et al. PLoS Pathog. .

Abstract

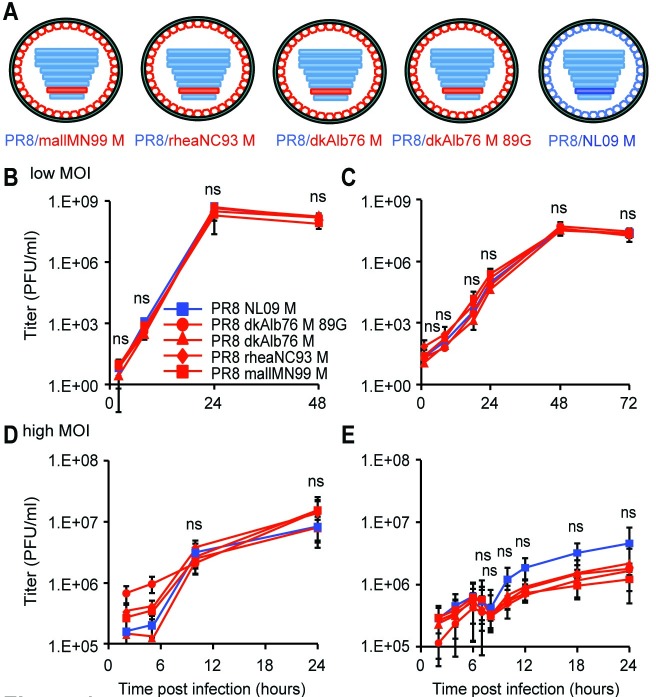
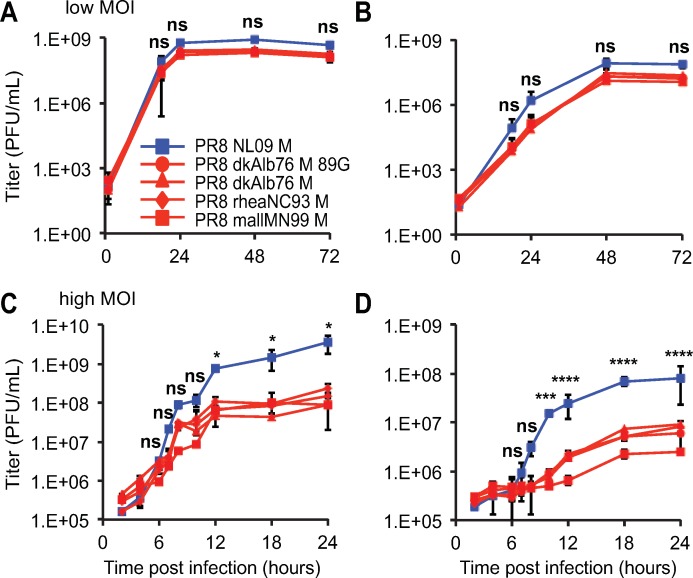
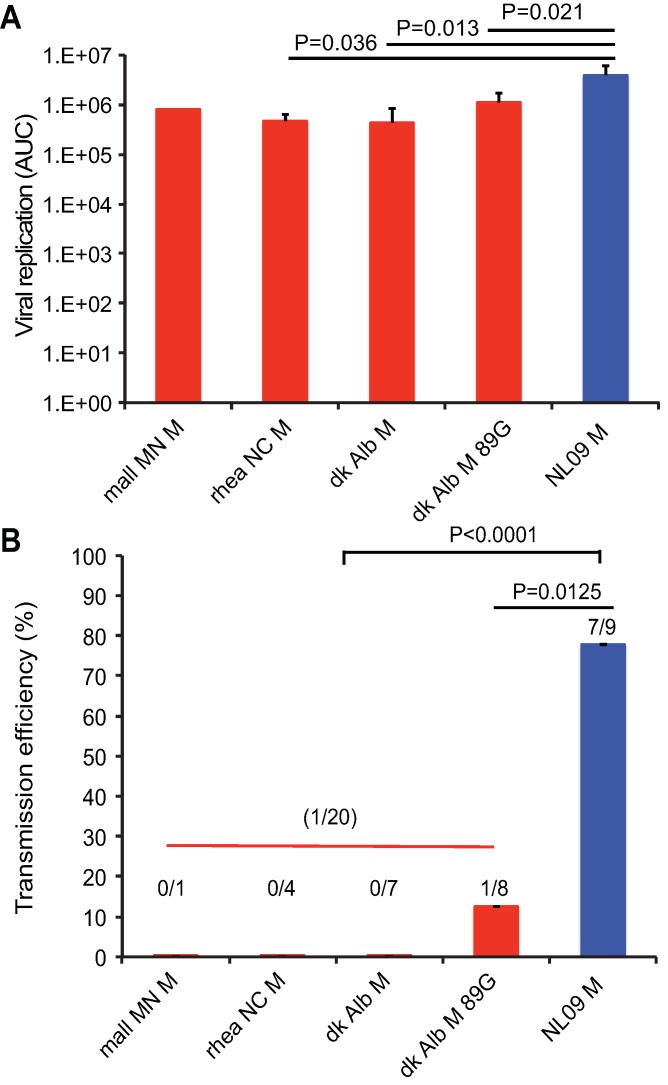
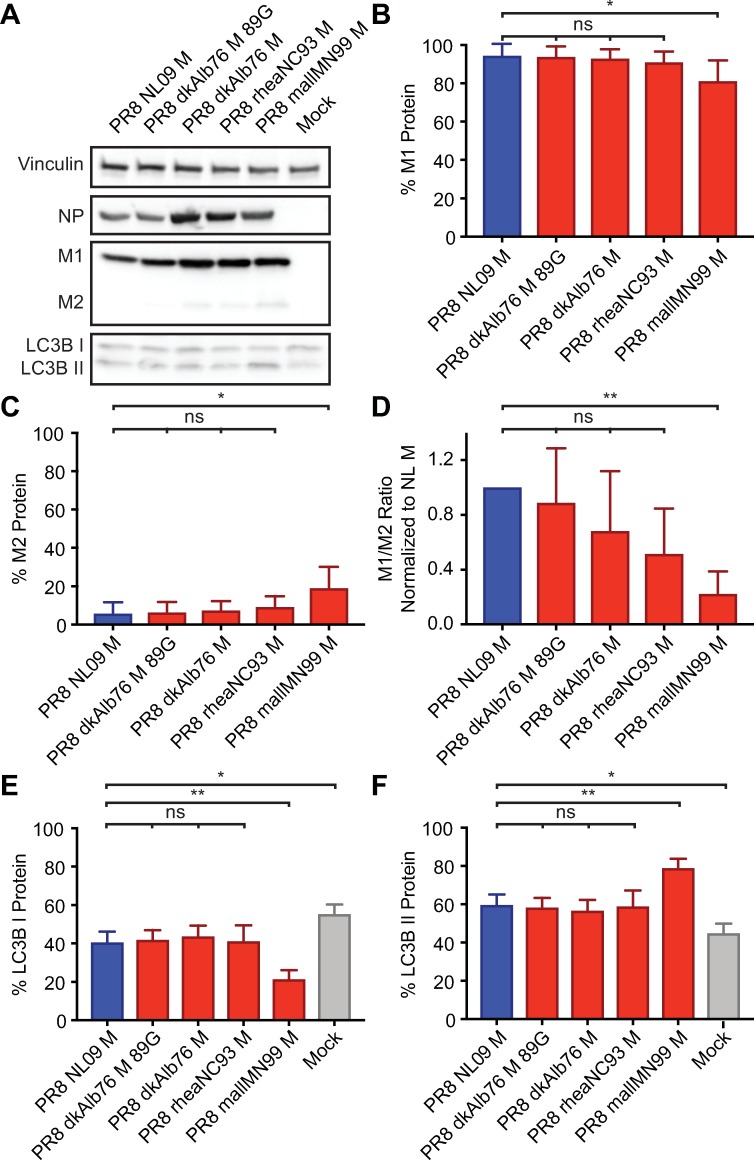
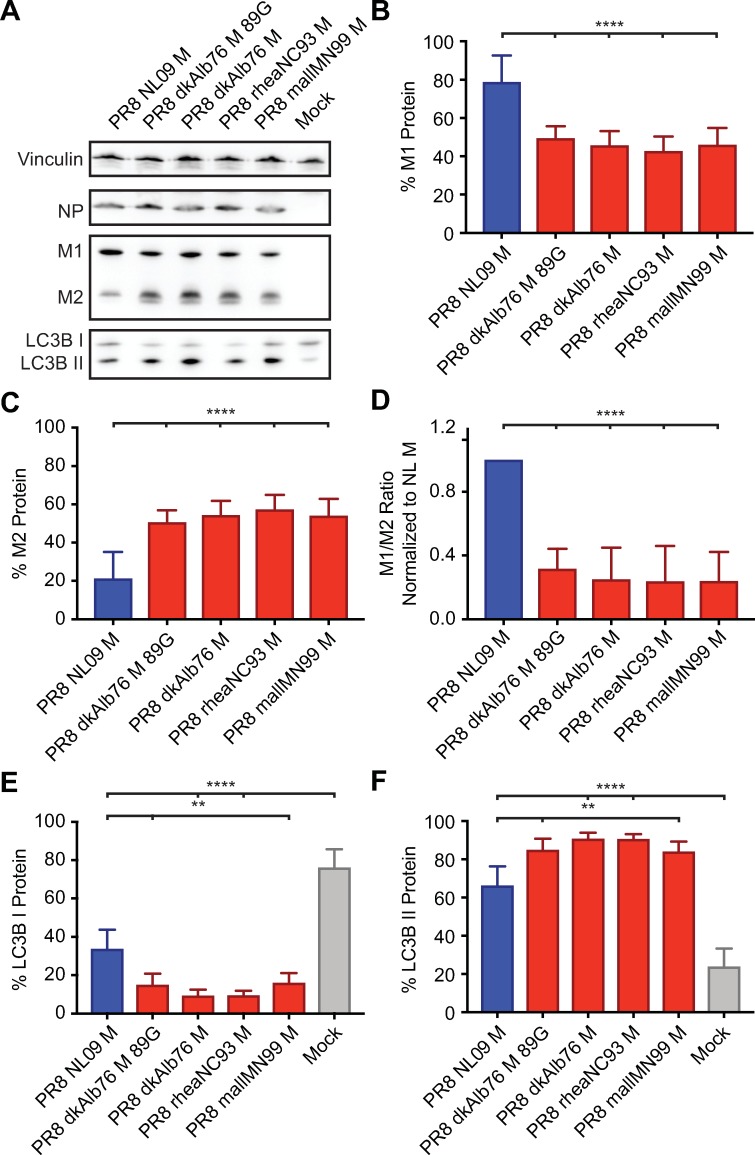
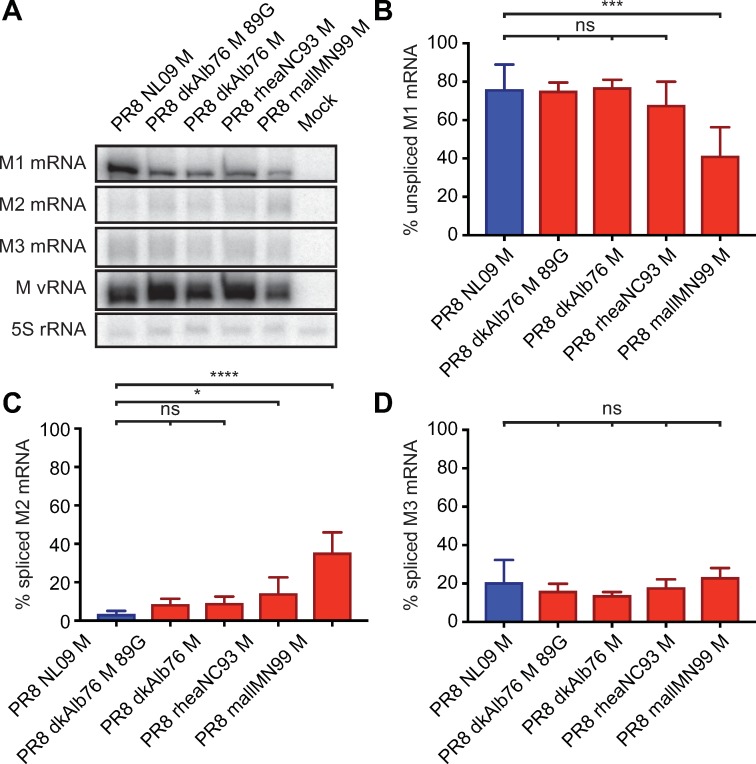
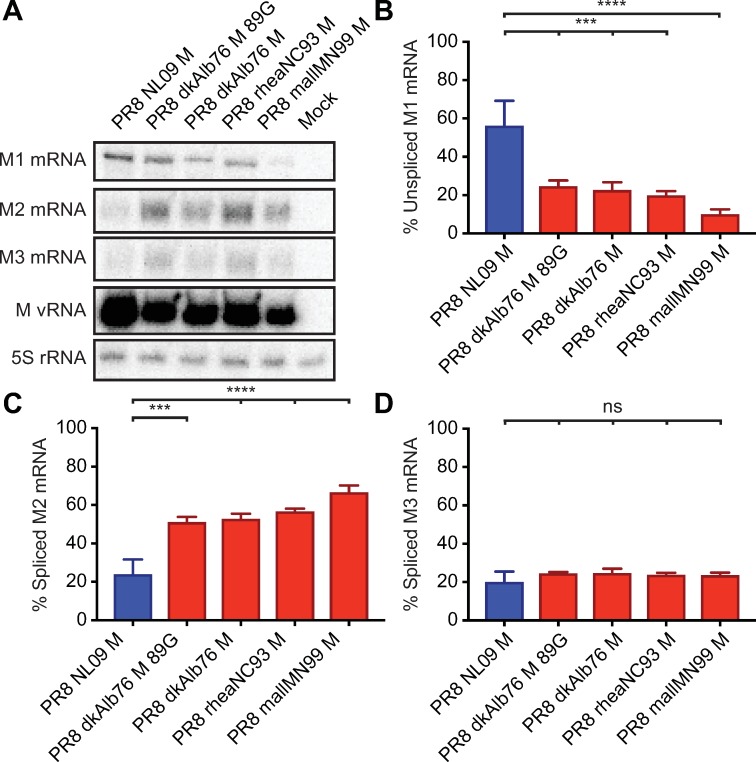
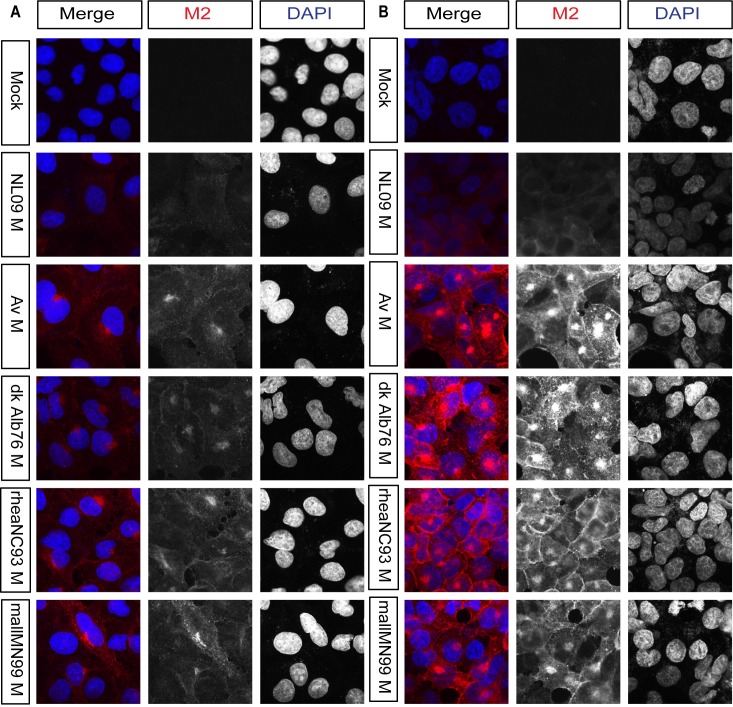
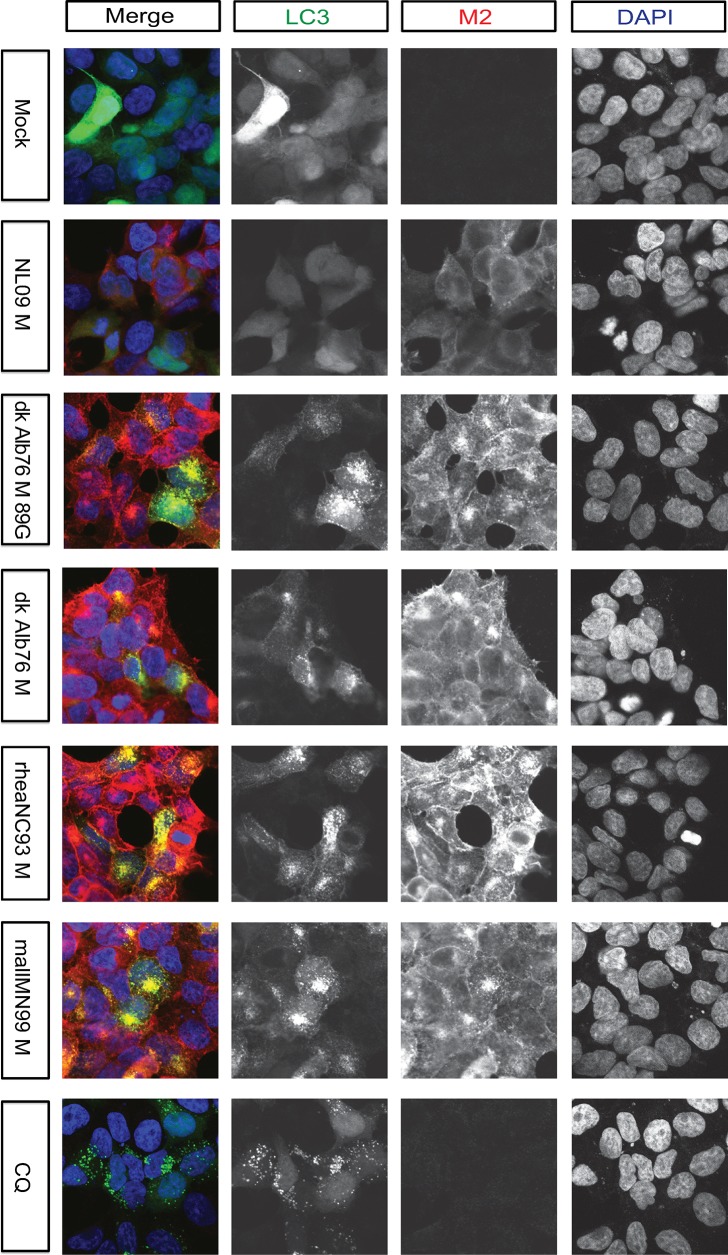
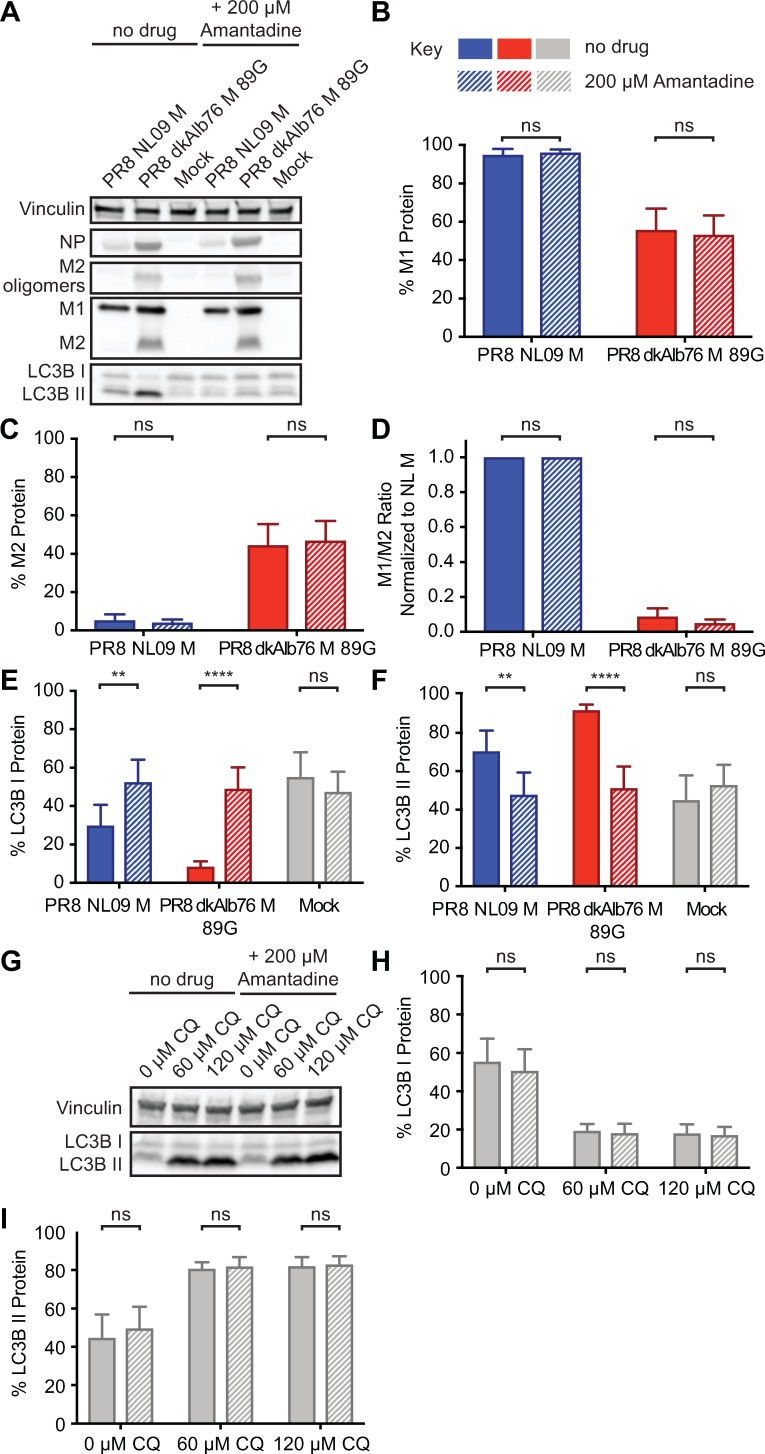
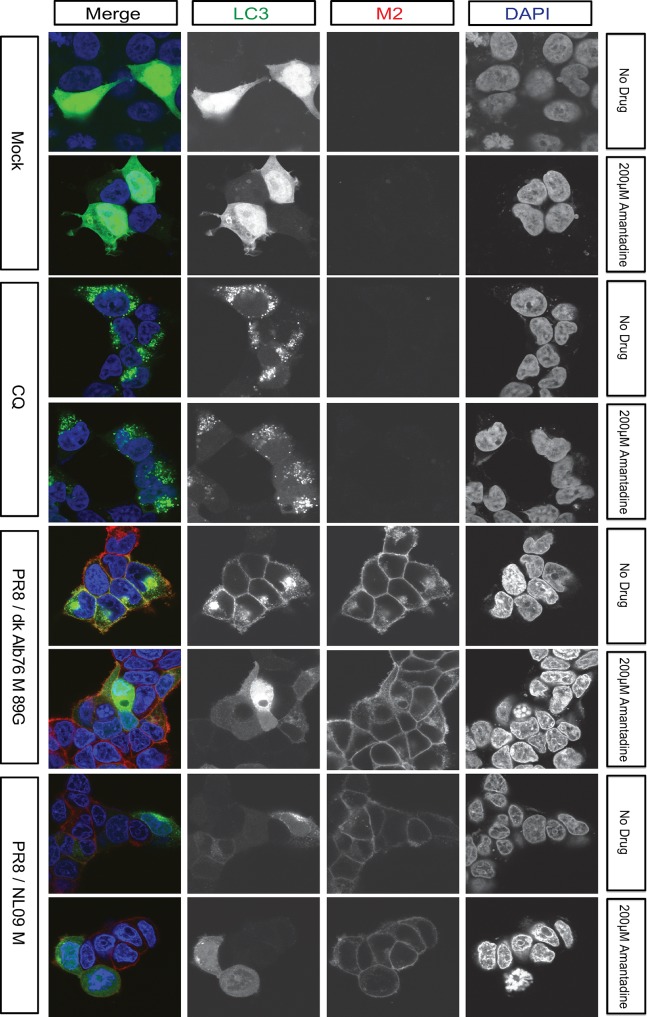
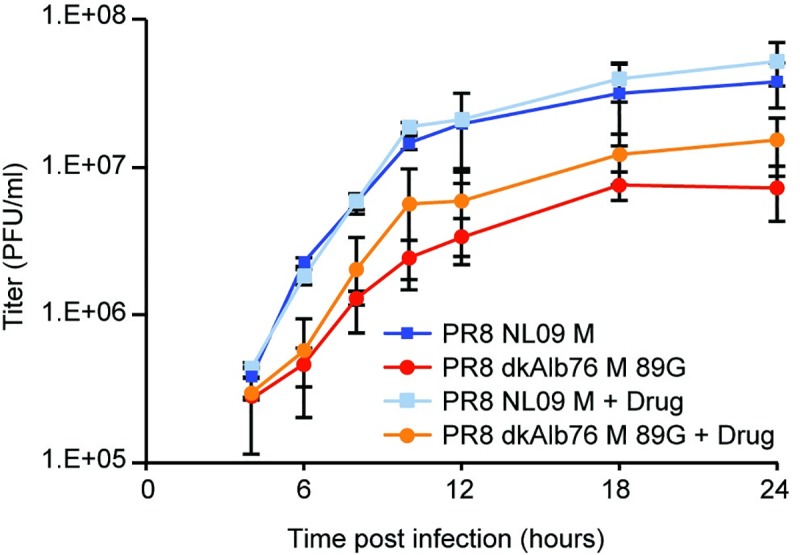
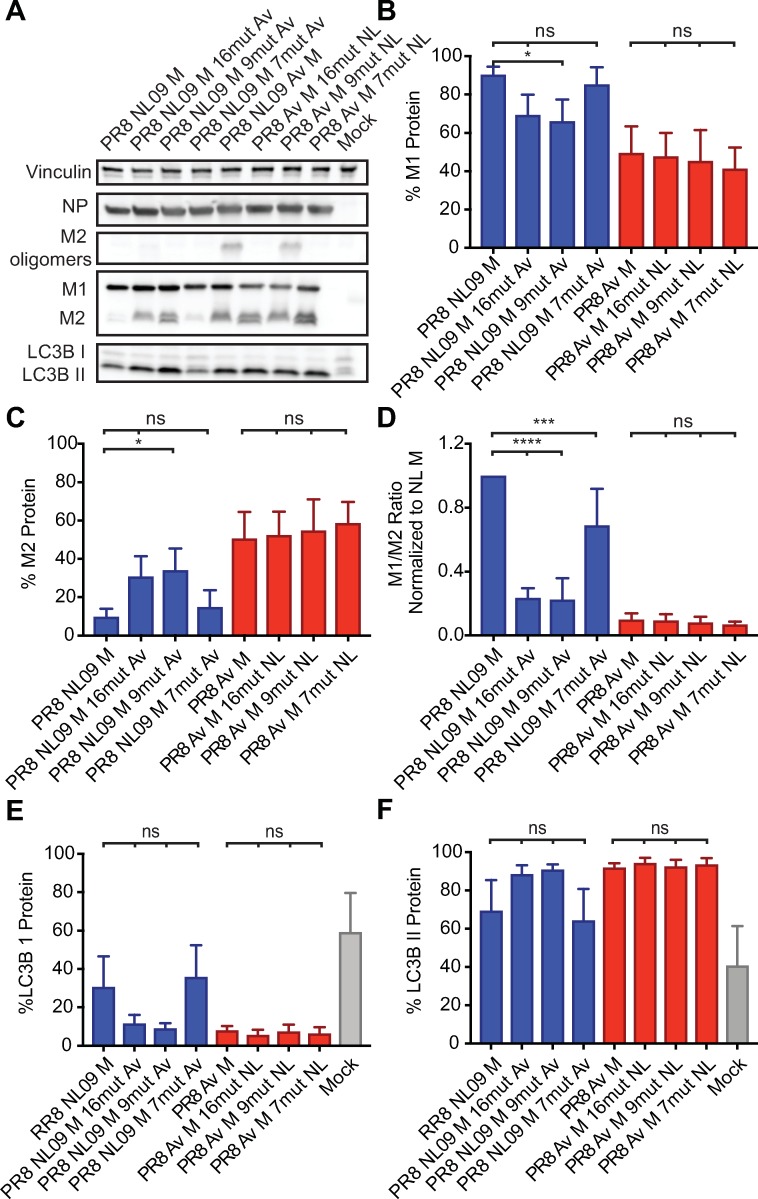
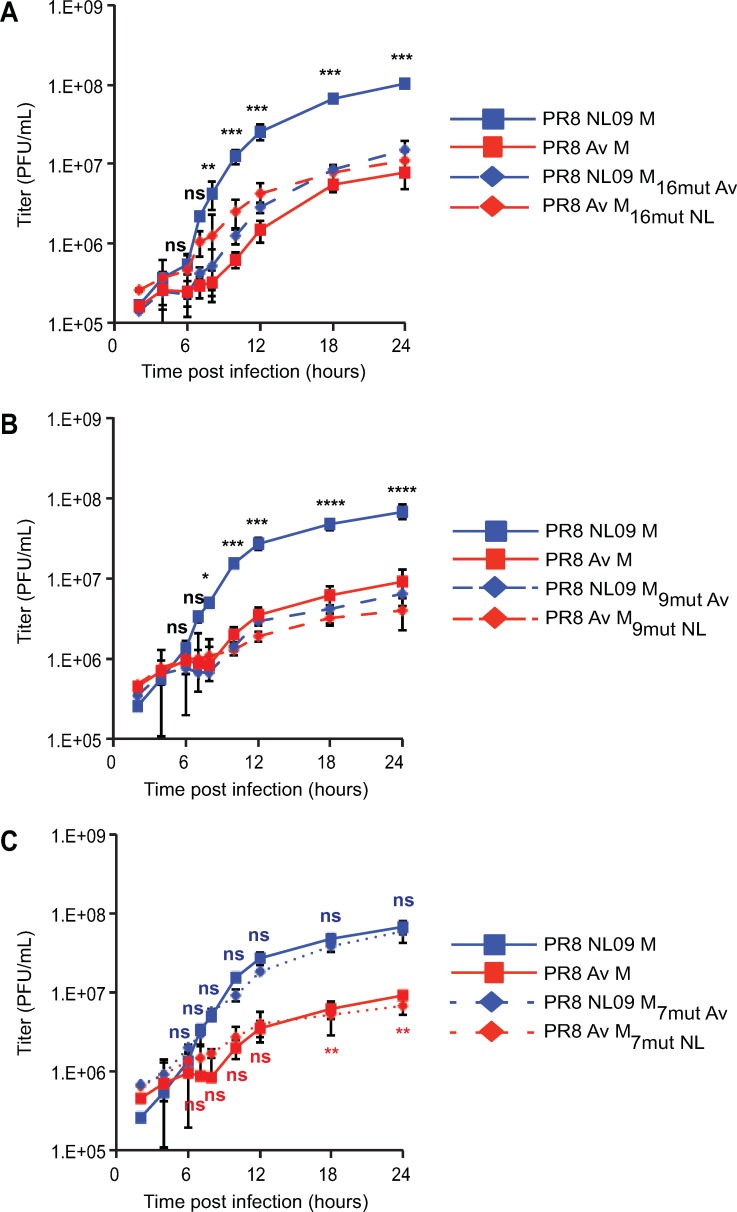
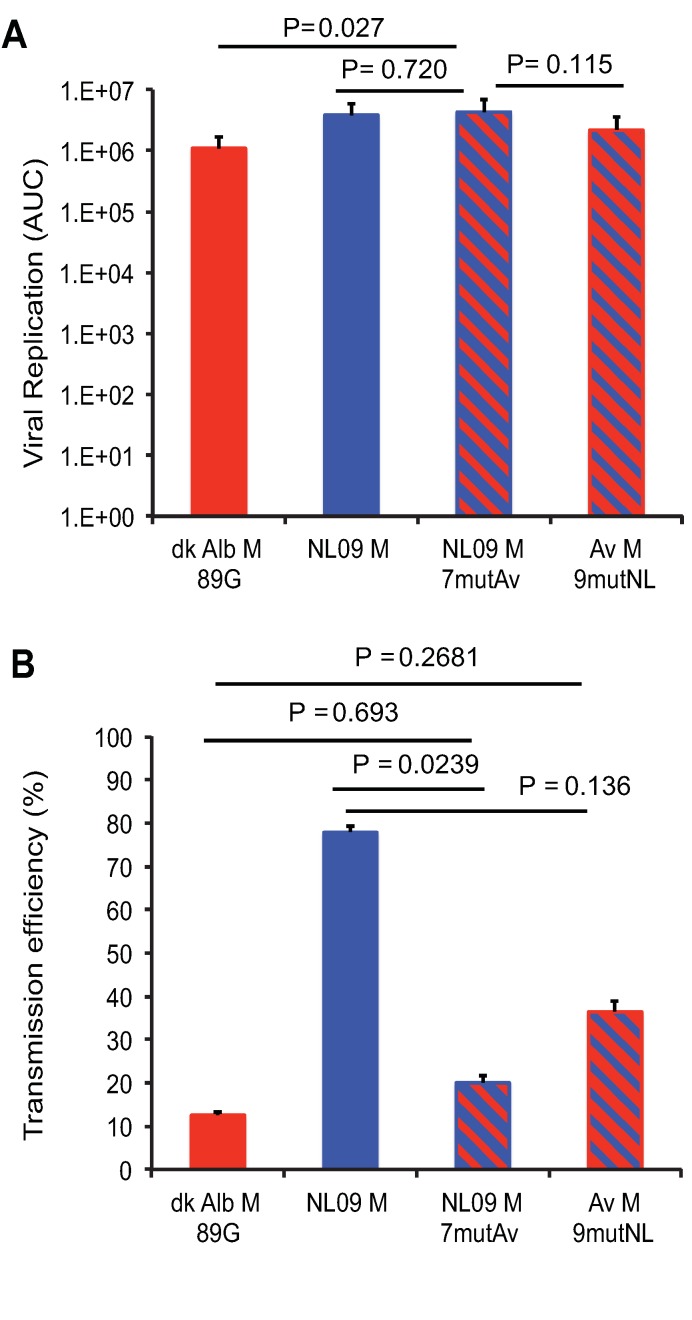
The M segment of the 2009 pandemic influenza A virus (IAV) has been implicated in its emergence into human populations. To elucidate the genetic contributions of the M segment to host adaptation, and the underlying mechanisms, we examined a panel of isogenic viruses that carry avian- or human-derived M segments. Avian, but not human, M segments restricted viral growth and transmission in mammalian model systems, and the restricted growth correlated with increased expression of M2 relative to M1. M2 overexpression was associated with intracellular accumulation of autophagosomes, which was alleviated by interference of the viral proton channel activity by amantadine treatment. As M1 and M2 are expressed from the M mRNA through alternative splicing, we separated synonymous and non-synonymous changes that differentiate human and avian M segments and found that dysregulation of gene expression leading to M2 overexpression diminished replication, irrespective of amino acid composition of M1 or M2. Moreover, in spite of efficient replication, virus possessing a human M segment that expressed avian M2 protein at low level did not transmit efficiently. We conclude that (i) determinants of transmission reside in the IAV M2 protein, and that (ii) control of M segment gene expression is a critical aspect of IAV host adaptation needed to prevent M2-mediated dysregulation of vesicular homeostasis.


Conflict of interest statement

The authors have declared that no competing interests exist.

Figures

Fig 1
Fig 1. pH1N1 M segment does not confer improved growth relative to avian M segment in avian cells at 37°C.
(A) A panel of PR8-based viruses was rescued by reverse genetics. The viruses differ only in the identity of the M segment, which were derived from A/mallard/MN/99 (H3N8), A/rhea/NC/93 (H7N1), A/duck/Alberta/76 (H1N1), or A/NL/602/09 (H1N1) viruses. (B) 11-day-old embryonated chicken eggs (ECE) or (C) chicken DF-1 cells were infected at low MOI with the indicated viruses. (D) Quail QT-6 cells or (E) DF-1 cells were infected at a high MOI of 5 PFU/cell with the indicated viruses. In all avian systems assessed, the pH1N1 M segment did not confer an increase in magnitude or kinetics of growth, relative to any avian-origin M segment. Multi-cycle and single-cycle growth were assessed in three independent experiments, with three technical replicates per experiment. Graphs show the means with SD for the three experiments. Statistical significance was determined using repeated measures, two-way, multiple ANOVA on log-transformed values, with Bonferroni correction applied to account for comparison of a limited number of means.
Fig 2
Fig 2. pH1N1 M segment confers higher growth relative to avian M segment in mammalian cells at 37°C.
(A) Canine MDCK cells or (B) human A549 cells were inoculated with the indicated viruses at a low MOI of 0.01 PFU/cell. (C) MDCK cells or (D) A549 cells were inoculated with the indicated viruses at a high MOI of 5 PFU/cell. In mammalian cells, the pH1N1 M segment conferred more rapid kinetics and higher peak titers than any avian-origin M segment. Multi-cycle and single-cycle growth were assessed in three independent experiments, with three technical sample replicates per experiment. Graphs show the means with SD for the three experiments. Statistical significance was determined using repeated measures, two-way, multiple ANOVA on log-transformed values, with Bonferroni correction applied to account for comparison of a limited number of means. At each time point, pairwise comparisons between viruses were performed, and asterisks corresponding to the most significant difference observed is shown.
Fig 3
Fig 3. pH1N1 influenza A virus M segment confers efficient replication and transmission of PR8-based virus among guinea pigs.
Groups of four guinea pigs were inoculated with 10 PFU of each avian M-encoding virus or NL09 M-encoding virus, as indicated. (A) Virus replication in nasal wash was measured by plaque titration at days 2, 4, 6, and 8 post-infection and the area under the curve was calculated. Graphs show mean AUC with SD for three experiments. All avian M-encoding viruses exhibited lower levels of growth in vivo than the isogenic virus possessing the NL09 M segment. The replication differences between avian M and NL09 M-based viruses were statistically significant, whereas those among avian M-based viruses were not. Statistical significance was evaluated using an unpaired, two-tailed Student’s t-test. (B) To assess transmission, each inoculated guinea pig was treated as an independent biological sample. The pH1N1 M segment conferred efficient transmission to naïve animals that were contact exposed (7/9 transmissions; 78%). In contrast, significantly poorer (12%), or no transmission was observed from guinea pigs infected with PR8 avian M viruses to naïve cage mates. Statistical significance of transmission differences were evaluated using an unpaired, two-tailed Student’s t-test.
Fig 4
Fig 4. Ratio of M1 to M2 protein expression is high in DF-1 Cells irrespective of viral M segment host origin.
DF-1 cells were inoculated at a MOI of 5 PFU/cell, with PR8 viruses encoding avian or human-derived M segments, and incubated at 37°C for 8 h, then lysed. Western immunoblot analysis of virus-infected DF-1 cells: (A) Vinculin expression was measured to allow normalization of viral protein levels. NP expression was measured to assess viral replication. Levels of M1 and M2 protein expression were assessed using an antibody (Mab E10) to a common epitope at the amino terminus of M1 and M2 proteins, allowing relative expression to be assessed. Levels of LC3B I and II were assessed using an antibody that detects both the precursor and activated forms of LC3B protein. (B) M1 protein and (C) M2 protein were normalized to vinculin, quantitated and displayed as a percentage of total protein expressed from the M gene. (D) The ratio of M1:M2 protein expression. (E) LC3B I protein and (F) LC3B II protein were normalized, quantitated and displayed as a percentage of total LC3B protein. Graphs in B-F show the means with SD from three independent experiments. For each experiment, two replicate Western immunoblots were performed and quantitated. Statistical significance was assessed using ordinary one-way ANOVA.
Fig 5
Fig 5. High expression ratio of M1 to M2 protein in A549 cells is dependent upon viral M segment host origin.
A549 cells were inoculated at a MOI of 5 PFU/cell with PR8 viruses encoding avian or human-derived M segments and incubated at 37°C for 8 h, then lysed. Western immunoblot analysis of virus-infected A549 cells: (A) Vinculin expression was measured to allow normalization of viral protein levels. NP expression was measured to assess viral replication. Levels of M1 and M2 protein expression were assessed using an antibody (Mab E10) to a common epitope at the amino terminus of M1 and M2 proteins, allowing relative expression to be assessed. Levels of LC3B I and II were assessed using an antibody that detects both the precursor and activated forms of LC3B protein. (B) M1 protein and (C) M2 protein were normalized to vinculin, quantitated and displayed as a percentage of total protein expressed from the M gene. (D) The ratio of M1:M2 protein expression. (E) LC3B I protein and (F) LC3B II protein were normalized, quantitated and displayed as a percentage of total LC3B protein. Graphs in B-F show the means with SD from three independent experiments. For each experiment, two replicate Western immunoblots were performed and quantitated. Statistical significance was assessed using ordinary one-way ANOVA.
Fig 6
Fig 6. Ratio of mRNA7 (encoding M1) to mRNA10 (encoding M2) expression is high in DF-1 cells irrespective of viral M Segment host origin.
DF-1 cells were inoculated at a MOI of 5 PFU/cell with PR8 viruses encoding avian or human-derived M segments and incubated at 37°C for 8 h prior to RNA extraction. RT primer extension radiogram of virus-infected DF-1 cells: (A) 5S rRNA levels were measured to allow normalization of viral RNA. Segment 7 vRNA expression was measured to assess viral replication. Levels of mRNA7, mRNA10, and mRNA11 mRNA expression were assessed using radiolabeled probes. (B) mRNA7, (C) mRNA10, and (D) mRNA11 was quantitated and displayed as a percentage of total M gene-expressed mRNA. Graphs in B-D show the means with SD from three independent experiments. For each experiment, two replicate radiograms were quantitated. Statistical significance was assessed using ordinary one-way ANOVA.
Fig 7
Fig 7. Ratio of mRNA7 (encoding M1) to mRNA10 (encoding M2) expression in A549 cells is dependent upon viral M segment host origin.
A549 cells were inoculated at a MOI of 5 PFU/cell with PR8 viruses encoding avian or human-derived M segments and incubated at 37°C for 8 h prior to RNA extraction. RT primer extension radiogram of virus-infected A549 cells: (A) 5S rRNA levels were measured to allow normalization of viral RNA. Segment 7 vRNA expression was measured to assess viral replication. Levels of mRNA7, mRNA10, and mRNA11 mRNA expression were assessed using radiolabeled probes. (B) mRNA7, (C) mRNA10, and (D) mRNA11 was quantitated and displayed as a percentage of total M gene expressed mRNA. Graphs in B-D show the means with SD from three independent experiments. For each experiment, two replicate radiograms were quantitated. Statistical significance was assessed using ordinary one-way ANOVA.
Fig 8
Fig 8. In human cells, avian M2 was expressed at higher levels and localized more strongly to perinuclear bodies than human M2.
A549 and 293T cells were inoculated with the indicated viruses, encoding avian or human M segments, at a MOI of 5 PFU/cell. At 8 hpi cells were stained with anti-M2 (Mab E10; red) and DAPI (blue) and imaged by confocal microscopy. Examples of optical sections are shown, either as merged 2-color images or the red and blue channels alone (shown in grey scale). (A) A549 cells with 63x optical and 3x digital magnification (189x total magnification). (B) 293T cells with 63x optical and 3x digital magnification (189x total magnification). Brightness was adjusted for optimal clarity, with all images treated equally.
Fig 9
Fig 9. Visualization of LC3 and M2 co-localization.
293T cells were transduced with GFP-LC3 protein and inoculated 24 h later with the indicated IAVs, encoding avian or human-derived M segments, at a MOI of 5 PFU/cell. Cells were fixed 8 h later and stained with anti-M2 (Mab E10; red) and DAPI (blue) followed by imaging with confocal microscopy. CQ: chloroquine. Examples of optical sections are shown, either as merged 3-color images, or the red, green, and blue channels alone (in grey scale). Images are at 63x optical and 3x digital magnification (189x total magnification). Brightness was adjusted for optimal clarity, with all images treated equally.
Fig 10
Fig 10. Inhibition of M2 ion channel results in loss of activation of LC3B.
A549 cells were inoculated at an MOI of 5 PFU/cell with PR8 viruses encoding avian or human-derived M segments and incubated in the presence or absence of 200 μM amantadine from 1 hpi. Cells were lysed at 8 hpi. (A) Representative Western immunoblot. Vinculin expression was measured to allow normalization of viral protein levels. NP expression was measured to assess viral replication. Levels of M1 and M2 protein were assessed using an antibody (Mab E10) to a common epitope of M1 and M2 proteins, allowing relative expression to be assessed. Levels of LC3B I and II were assessed using an antibody that detects both the precursor and activated forms of LC3B protein. (B) M1 protein and (C) M2 protein were normalized to vinculin and displayed as a percentage of total M gene-expressed protein. (D) The ratio of M1:M2 protein expression. (E) LC3B I and (F) LC3B II were normalized to vinculin and displayed as a percentage of total LC3B protein. (G) As a control to ensure the specificity of amantadine, we incubated chloroquine-treated A549 cells in the presence or absence of 200 μM amantadine for 8 h. (H) LC3B I and (I) LC3B II were normalized to vinculin and displayed as a percentage of total LC3B protein. Graphs in B-F, H-I show the means with SD from three independent experiments. For each experiment, two replicate Western immunoblots were performed and quantitated. Statistical significance was assessed using ordinary one-way ANOVA.
Fig 11
Fig 11. Inhibition of proton channel activity relieves M2-induced accumulation of LC3B positive vesicles.
293T cells transduced with LC3-GFP were inoculated at a MOI of 5 PFU/cell with PR8 viruses possessing M segments from a human or an avian strain and incubated in the presence or absence of 200 μM amantadine from 1 hpi. Cells were fixed at 12 hpi and stained with anti-M2 (Mab E10; red) and DAPI (blue) followed by imaging with confocal microscopy. Examples of optical sections are shown, either as merged 3-color images or the red, green, and blue channels alone (in grey scale). 3x zoom of a 63x magnification is shown. Brightness was adjusted for optimal clarity, with all images treated equally. CQ: chloroquine.
Fig 12
Fig 12. Amantadine improves growth of avian M segment-encoding virus in A549 cells.
PR8-based NL09 M or avian M-encoding viruses were inoculated at an MOI of 5 PFU/cell onto A549 cells. At 1hpi, cells were treated with 200μM amantadine, and incubated at 37°C for 24 h in the continuous presence of amantadine. Virus released into supernatant was collected at the indicated time points, and virus growth was measured by plaque titration. The pH1N1 M segment conferred more rapid kinetics and higher peak titers of growth than the avian-origin M segment, however amantadine had no impact on the growth of the pH1N1 M encoding virus. In contrast, growth of the avian M-encoding virus was improved in the presence of drug (P = 0.0007). Single-cycle growth was assessed in four independent experiments, with three technical sample replicates per experiment. Graphs show the means with SD for the four experiments. Statistical significance was determined using repeated measures, two-way, multiple comparisons ANOVA on log-transformed values, with Sidak’s correction applied.
Fig 13
Fig 13. Activation of LC3B II correlates with high expression of M2 protein in A549 cells regardless of M2 amino acid composition.
PR8 NL09 M virus and PR8 avian M virus, along with six chimeric variant PR8-based viruses, were inoculated at a MOI of 5 PFU/cell onto A549 cells. Cells were incubated for 8 h, then lysed. (A) Western immunoblot analysis of virus-infected A549 cells. Vinculin was measured to allow normalization of viral protein levels. NP was measured to assess viral replication. Levels of M1 and M2 protein were assessed using an antibody (Mab E10) to a common epitope at the amino terminus of M1 and M2 proteins, allowing their direct comparison. Levels of LC3B I and II were assessed using an antibody that detects both the precursor and activated forms of LC3B protein. (B) M1 protein and (C) M2 protein were normalized to vinculin and displayed as a percentage of total protein expressed from the M gene. (D) The ratio of M1:M2 protein expression. (E) LC3B I protein and (F) LC3B II protein were normalized to vinculin and displayed as a percentage of total LC3B protein. Graphs in B-F show the means with SD from three independent experiments. For each experiment, two replicate Western immunoblots were performed and quantitated. Statistical significance was assessed using ordinary one-way ANOVA.
Fig 14
Fig 14. pH1N1 M amino acid sequences are not sufficient to confer high growth phenotype in A549 cells.
PR8 NL09 M virus and PR8 avian M virus, along with six PR8-based viruses carrying avian-human chimeric M segments, were inoculated at a MOI of 5 PFU/cell onto A549 cells. Virus growth was measured by plaque titration. The effects on viral growth of amino acid changes in (A) both M1 and M2, (B) M1 only and (C) M2 only are shown. Single-cycle growth was assessed in at least three independent experiments, with three technical sample replicates per experiment. Graphed data show the means with SD for at least three experiments. Statistical significance was determined using repeated measures, two-way, multiple ANOVA on log-transformed values, with Bonferroni correction applied to account for comparison of a limited no of means. Experiments involving PR8 NL09 9mut or 7mut viruses as well as PR8 Av M 9mut or 7mut viruses were performed at the same time, but are displayed on two separate graphs with the same PR8 NL09 M and PR8 avian M control virus data, to improve clarity of presentation.
Fig 15
Fig 15. Reduced expression of avian M2 improves replication efficiency in vivo but is not sufficient for efficient transmission in guinea pigs.
Groups of twelve guinea pigs were inoculated with 10 PFU of PR8-based viruses carrying avian M, NL09 M, chimeric NL09 M 7mut M, or chimeric avian M 9mut segments, as indicated. (A) Virus replication in nasal washings was measured by plaque titration at days 2, 4, 6, and 8 post-infection and the total area under the curve was calculated. The replication differences between viruses with NL09 M and NL09 M 7mutAv segments were not significant (P = 0.720). Differences between viruses encoding the NL09 M 7mut segment and the avian M 9mut segment trended towards, but were not statistically significant (P = 0.115). (B) Transmission to naïve cage mates that were exposed at 24 hpi. Neither chimeric M segment conferred efficient transmission (7/9 transmissions; 78%). Statistical significance of replication differences was determined using a two-tailed Student’s t-test. Statistical significance of transmission differences was determined using an unpaired two-tailed Student’s t-test. NL M and avian M data are identical to data presented in Fig 3 and are reproduced here for clarity.
Fig 16
Fig 16. Regulation of M segment gene expression contributes to host range restriction of IAV.
When an avian IAV M segment is transcribed within mammalian cells, excessive splicing of mRNA7 results in aberrant overexpression of the M2 proton channel. When highly expressed, this channel accumulates in autophagic vesicles. Abundant proton channel activity in the membranes of autophagosomes blocks their turnover by preventing fusion with lysosomes. This stalling of a critical cellular housekeeping function in turn reduces the efficiency of viral replication, contributing to the species barrier that limits the zoonotic potential of avian IAVs.

References

    1. Patterson KD, Pyle GF (1991) The geography and mortality of the 1918 influenza pandemic. Bull Hist Med 65: 4–21. - PubMed
    1. Viboud C, Simonsen L, Fuentes R, Flores J, Miller MA, et al. (2016) Global Mortality Impact of the 1957–1959 Influenza Pandemic. J Infect Dis 213: 738–745. 10.1093/infdis/jiv534 - DOI - PMC - PubMed
    1. Viboud C, Grais RF, Lafont BA, Miller MA, Simonsen L, et al. (2005) Multinational impact of the 1968 Hong Kong influenza pandemic: evidence for a smoldering pandemic. J Infect Dis 192: 233–248. 10.1086/431150 - DOI - PubMed
    1. Molinari NA, Ortega-Sanchez IR, Messonnier ML, Thompson WW, Wortley PM, et al. (2007) The annual impact of seasonal influenza in the US: measuring disease burden and costs. Vaccine 25: 5086–5096. 10.1016/j.vaccine.2007.03.046 - DOI - PubMed
    1. Reperant LA, Kuiken T, Osterhaus AD (2012) Adaptive pathways of zoonotic influenza viruses: from exposure to establishment in humans. Vaccine 30: 4419–4434. 10.1016/j.vaccine.2012.04.049 - DOI - PubMed

Publication types

MeSH terms

Substances