. 2019 Aug 14;26(2):217-227.e6.
doi: 10.1016/j.chom.2019.07.005.

Epitranscriptomic Addition of m5C to HIV-1 Transcripts Regulates Viral Gene Expression

Affiliations

Epitranscriptomic Addition of m5C to HIV-1 Transcripts Regulates Viral Gene Expression

David G Courtney et al. Cell Host Microbe. .

Abstract

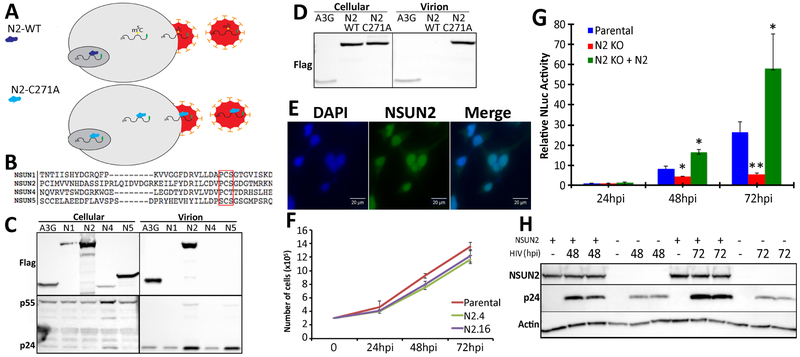
How the covalent modification of mRNA ribonucleotides, termed epitranscriptomic modifications, alters mRNA function remains unclear. One issue has been the difficulty of quantifying these modifications. Using purified HIV-1 genomic RNA, we show that this RNA bears more epitranscriptomic modifications than the average cellular mRNA, with 5-methylcytosine (m5C) and 2'O-methyl modifications being particularly prevalent. The methyltransferase NSUN2 serves as the primary writer for m5C on HIV-1 RNAs. NSUN2 inactivation inhibits not only m5C addition to HIV-1 transcripts but also viral replication. This inhibition results from reduced HIV-1 protein, but not mRNA, expression, which in turn correlates with reduced ribosome binding to viral mRNAs. In addition, loss of m5C dysregulates the alternative splicing of viral RNAs. These data identify m5C as a post-transcriptional regulator of both splicing and function of HIV-1 mRNA, thereby affecting directly viral gene expression.

Keywords: 5-methyl cytosine; HIV-1; NSUN2; RNA modification; RNA splicing; epitranscriptomic; translation of mRNA.


Conflict of interest statement

Declaration of Interests

The authors declare no competing interests.

Figures

Figure 1.
Figure 1.. Quantification and mapping of RNA modifications present on HIV-1 transcripts.
(A) Schematic of the purification of the gRNA present in HIV-1 virions released from infected CEM T cells. (B) Purified HIV-1 gRNA derived from infected CEM T cells or transfected 293T cells was analyzed by RNA-seq to determine the level of contaminating human RNA. CDS; human mRNAs. N=1 (C) UPLC-MS/MS was used to determine the percentage of each RNA modification listed, normalized to the level of the parental nucleoside, in the two HIV-1 gRNA samples and in CEM or 293T poly(A)+ RNA. N=1 (D) Schematic of the antibody capture technique used to map m6A or m5C modifications on HIV-1 RNA. (E) The upper two panels show PA-m6A-seq mapping, while the lower three panels show PA-m5C-seq mapping, of HIV-1 RNA derived from either virions or cell lysates of the matched virus producer CEM cells, or purified virions from infected primary CD4+ T cells.
Figure 2.
Figure 2.. Identification of NSUN2 as the primary m5C writer of HIV-1 RNAs.
(A) Schematic showing the potential packaging of a covalently bound, mutant NSUN protein into HIV-1 virions along with the HIV-1 gRNA, while WT NSUN protein remains in the infected cell. (B) Sequence alignment of a segment of the NSUN protein family, with the conserved motif involved in the detachment of covalently bound NSUN proteins from target RNAs boxed in red. A cysteine to alanine mutation in this motif results in NSUN proteins becoming covalently bound to target cytosines. (C) At left, a Western blot showing expression of FLAG-tagged A3G, and FLAG-tagged mutants of NSUN1/NOP2 (N1), NSUN2 (N2), NSUN4 (N4) and NSUN5 (N5), in 293T cells co-transfected with pNL4-3. At right, a Western blot showing the presence of A3G and N2-C271A in HIV-1 virions. N=3. (D) Western blots analyzing the intracellular expression of FLAG-tagged A3G, WT NSUN2 (N2) or N2-C271A in 293T cells co-transfected with HIV-1 (left panel) or in released virions (right panel). N=3. (E) IF localization of endogenous NSUN2 in 293T cells. Cells were stained with an NSUN2-specific antiserum, shown in green, as well as with DAPI, which stains DNA blue. N=3. (F) Growth curves for the two NSUN2 KO, 293T-derived clones N2.4 and N2.16, showing comparable growth rates to WT 293T cells. N=3 with SD indicated. (G) WT 293T cells, NSUN2 KO cells or NSUN2 KO cells transfected with a WT NSUN2 expression vector, were co-transfected with pCD4 and then infected with NL-NLuc. Induced NLuc levels were determined at 24, 48 and 72 hpi. Expression of virally encoded NLuc was inhibited by loss of NSUN2 but rescued by the NSUN2 expression plasmid. N=3, * = p<0.05, ** = p<0.01. (H) Western blot from an experiment similar to panel G but using WT NL4-3. This experiment measured HIV-1 p24 Gag expression at 48 and 72 hpi in WT 293T cells and in the NSUN2 KO cell lines N2.4 and N2.16. Again, HIV-1 protein expression was reduced in the NSUN2 KO cells. N=3.
Figure 3.
Figure 3.. NSUN2-specific m5C sites on HIV-1 transcripts upregulate HIV-1 gene expression.
(A) The upper two panels show mapping of NSUN2 binding sites on intracellular HIV-1 RNAs in infected 293T cells using CLIP-seq. FLAG-tagged WT NSUN2 was used as a control, while the covalently bound, FLAG-tagged N2-C271A mutant was used to identify NSUN2 binding sites. Lower two panels map m5C sites present on intracellular HIV-1 RNAs produced in HIV-infected WT 293T cells, or in the N2.4 KO cells, using PA-m5C-seq. (B) Western blot of NSUN2 or HIV-1 p55 Gag expression in N2.4 cells transfected with an empty vector, pN2 (WT NSUN2), pN2-C321A or pN2-C271A, as well as with pNL-NLuc. Actin was used as a loading control. N=3. (C) In blue, qRT-PCR was used to quantify the level of HIV-1 RNA in the samples analyzed in panel B. The probe used was specific for the LTR U3 region and values were normalized to cellular GAPDH mRNA. In red, NLuc activity from the cells shown in panel B. N=3 with SD indicated; * = p<0.05. (D) Western blot of virions isolated from the supernatant media from the HIV-1 producer cells analyzed in panel B, demonstrating packaging of N2-C271A. N=3. (E) ELISA was used to measure p24 levels in the supernatant of the HIV-1 producer cells analyzed in panel B. N=3 with SD indicated; *** = p<0.001. (F) Western blot of intracellular p55 and p24 Gag expression levels in CEM cells infected with the NL-NLuc virus generated from the 293T cell cultures analyzed in panels B through E. Virus was diluted to equal levels, as measured by p24 ELISA in panel E, prior to infection. N=3. (G) Intracellular NLuc activity was determined using extracts from the same NL-NLuc-infected CEM cell cultures analyzed in panel F. N=3, *** = p<0.001.
Figure 4.
Figure 4.. Loss of NSUN2 affects the translation of HIV-1 RNAs.
(A) Western blot of WT or NSUN2 KO 293T cells separated into nuclear (Nuc) and cytoplasmic (Cyt) fractions 72 h after transfection with pNL4-3. Blots were probed for NSUN2, Lamin A/C and GAPDH. N=2. (B) qRT-PCR was used to measure the level of HIV-1 gag mRNA present in the cytoplasmic and nuclear fractions isolated from the pNL4-3 transfected WT or NSUN2 KO 293T cells analyzed in panel A. GAPDH mRNA was measured in parallel and used to normalize the HIV-1 RNA data. The relative gag mRNA level in the cytoplasm was set at 1. N=4 with SD indicated. (C) WT or NSUN2 KO cells were transfected with pNL4-3 and used to analyze both the total and ribosome associated levels of cellular GAPDH, Actin, HPRT1 and MRAS mRNA, as well as HIV-1 gag RNA, at 72 h post-infection, with the average level detected in WT cells set at 1. N=3 with SD indicated; ** = p<0.01.
Figure 5.
Figure 5.. NSUN2 loss affects alternative splicing of HIV-1 RNAs.
(A) Schematic showing the location of the HIV-1 major 5’ splice site D1 and the five 3’ splice sites A1 through A5. PA-m5C-seq and N2-C271A binding sites located adjacent to the A2 splice site are also shown. (B) Assessment of 3’ splice site usage from the D1 5’ splice site in completely spliced, ~1.8 kb HIV-1 RNAs harvested from NSUN2 or DNMT2 293T KO cell lines, normalized to WT 293T cells, which was set at 1.0. N=3, *** = p<0.001. (C) Assessment of 3’ splice site usage from the D1 5’ splice site in incompletely spliced, ~4.0 kb HIV-1 RNAs harvested from NSUN2 or DNMT2 KO 293T cell lines, normalized to WT 293T cells, which was set at 1.0. N=3, *** = p<0.001. (D) qRT-PCR analysis showing usage of the D1/A2 splice junction relative to total viral RNA levels, measured with a U3-specific probe, using RNA isolated from transfected NSUN2 or DNMT2 293T KO cell lines. Data were normalized to WT 293T cells, which was set at 1.0 (dotted line). N=3 with SD indicated, ** = p<0.01. (E) Nucleotide and protein sequences underlying the m5C peak shown in panel D, with mutated C residues indicated. (F) qRT-PCR quantification of D1/A2 splice site usage in WT, NSUN2 or DNMT2 KO 293T cells transfected with WT pNL4-3 or with the HΔm5C1 proviral mutant. N=3 with SD indicated, * = p<0.05. For the experiments shown in this figure, both the N2.4 and N2.16 NSUN2 KO cell lines and the D2.1 and D2.2 DNMT2 KO cell lines were used.

References

    1. Arango D, Sturgill D, Alhusaini N, Dillman AA, Sweet TJ, Hanson G, Hosogane M, Sinclair WR, Nanan KK, Mandler MD, et al. (2018). Acetylation of Cytidine in mRNA Promotes Translation Efficiency. Cell 175, 1872–1886 e1824. - PMC - PubMed
    1. Basanta-Sanchez M, Temple S, Ansari SA, D'Amico A, and Agris PF (2016). Attomole quantification and global profile of RNA modifications: Epitranscriptome of human neural stem cells. Nucleic Acids Res 44, e26. - PMC - PubMed
    1. Bieniasz PD, Fridell RA, Aramori I, Ferguson SS, Caron MG, and Cullen BR (1997). HIV-1-induced cell fusion is mediated by multiple regions within both the viral envelope and the CCR-5 co-receptor. Embo J 16, 2599–2609. - PMC - PubMed
    1. Bohnsack KE, Hobartner C, and Bohnsack MT (2019). Eukaryotic 5-methylcytosine (m(5)C) RNA Methyltransferases: Mechanisms, Cellular Functions, and Links to Disease. Genes (Basel) 10. - PMC - PubMed
    1. Chen K, Lu Z, Wang X, Fu Y, Luo GZ, Liu N, Han D, Dominissini D, Dai Q, Pan T, et al. (2015). High-resolution N(6) -methyladenosine (m(6) A) map using photocrosslinking-assisted m(6) A sequencing. Angew Chem Int Ed Engl 54, 1587–1590. - PMC - PubMed

Publication types