Review
. 2019 Aug 14;26(2):283-295.e8.
doi: 10.1016/j.chom.2019.07.008.

The Landscape of Genetic Content in the Gut and Oral Human Microbiome

Affiliations
Review

The Landscape of Genetic Content in the Gut and Oral Human Microbiome

Braden T Tierney et al. Cell Host Microbe. .

Abstract

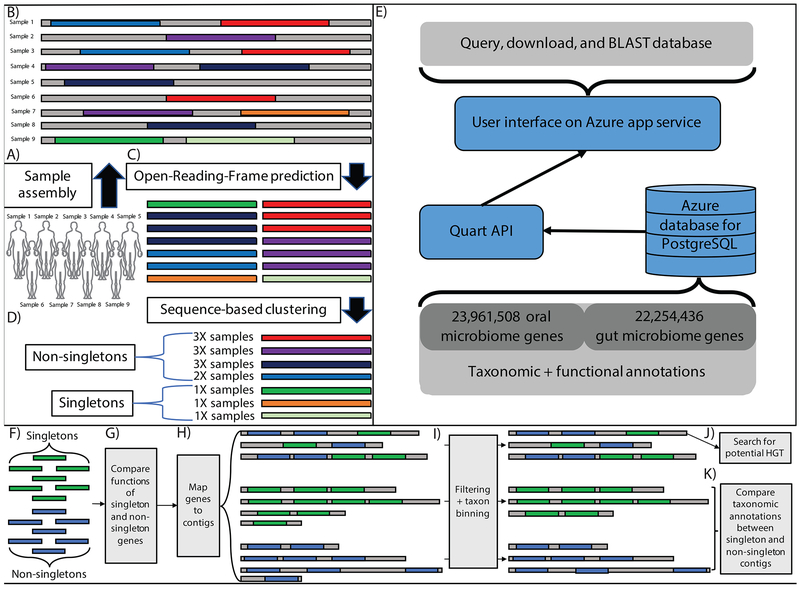
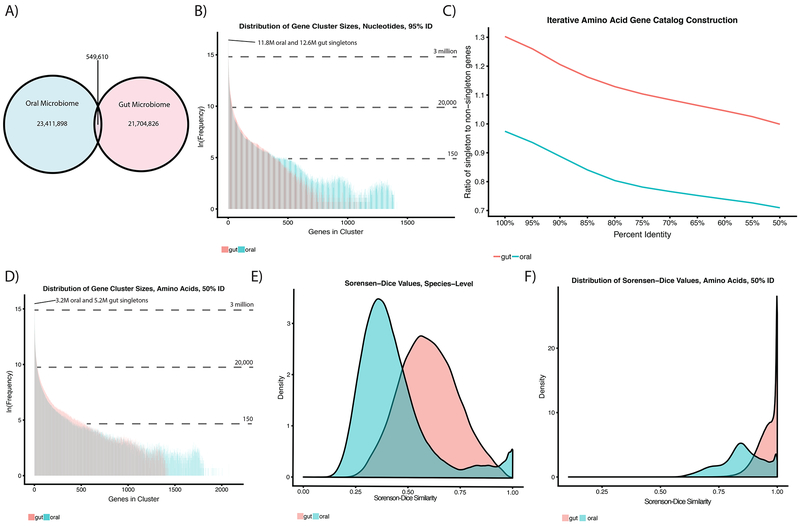
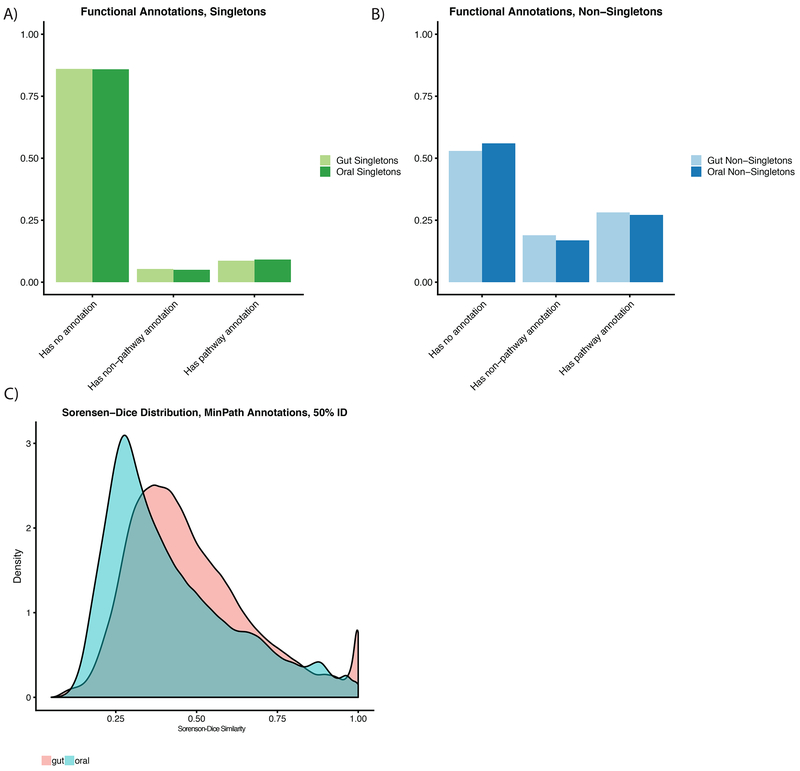
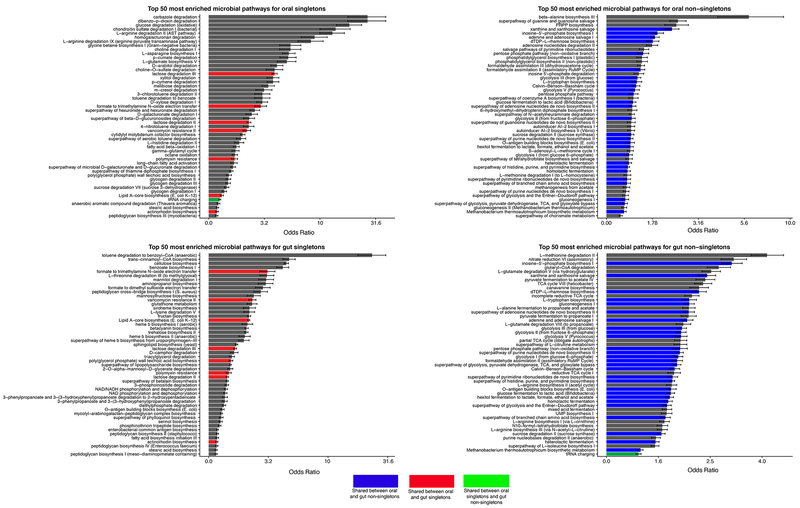
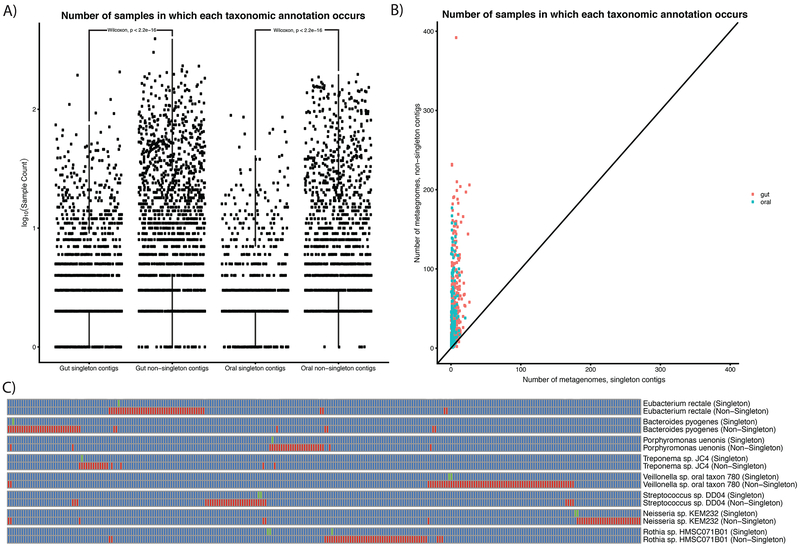
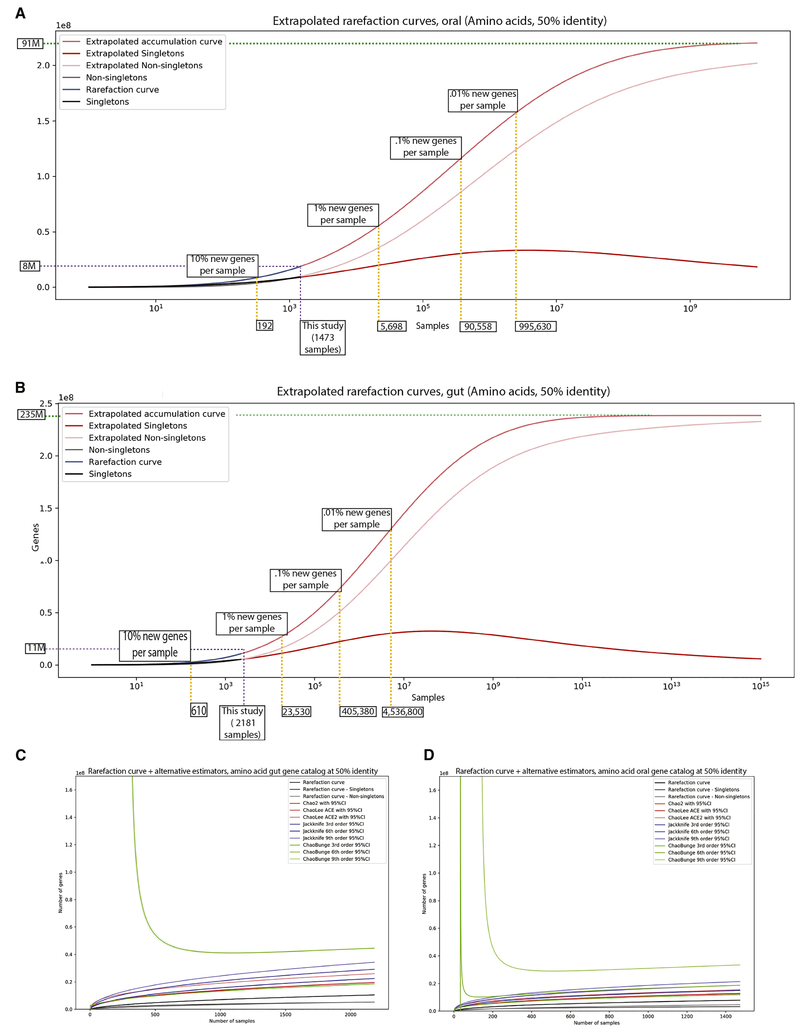
Despite substantial interest in the species diversity of the human microbiome and its role in disease, the scale of its genetic diversity, which is fundamental to deciphering human-microbe interactions, has not been quantified. Here, we conducted a cross-study meta-analysis of metagenomes from two human body niches, the mouth and gut, covering 3,655 samples from 13 studies. We found staggering genetic heterogeneity in the dataset, identifying a total of 45,666,334 non-redundant genes (23,961,508 oral and 22,254,436 gut) at the 95% identity level. Fifty percent of all genes were "singletons," or unique to a single metagenomic sample. Singletons were enriched for different functions (compared with non-singletons) and arose from sub-population-specific microbial strains. Overall, these results provide potential bases for the unexplained heterogeneity observed in microbiome-derived human phenotypes. One the basis of these data, we built a resource, which can be accessed at https://microbial-genes.bio.

Keywords: de novo assembly; gene catalog; gene diversity; gut microbiome; metagenomics; microbial diversity; oral microbiome.


Conflict of interest statement

Declaration of Interests

The authors have no competing interests to declare.

Figures

Figure 1:
Figure 1:. Meta-analysis of the oral and gut microbiomes.
A-B) We aggregated publically available oral and gut short read data and assembled it into contigs (in this example, each contig comes from a single sample). C) Gene open-reading-frames (ORFs) are identified on assembled contigs D) ORFs are clustered at 95% identity to identify a non-redundant gene catalog E) Database content, description of backend, description of UI F-K) Downstream singleton analytical pipeline. F) We identify singletons and non-singletons in our dataset and G) compare their functional annotations. H) We then map genes to contigs, which we group into 3 categories: singleton-contigs (those consisting of only singletons), non-singleton contigs (those consisting of only non-singletons) and mixture contigs (those consisting of both singletons and non-singletons). i) We filter short contigs and bin the remainder according to the taxonomic classification of their gene content. We then attempt to identify the source of singletons as either J) horizontal gene transfer (HGT) and/or K) rare, singleton-rich microbial strains.
Figure 2:
Figure 2:. The genetic diversity of the oral and gut microbiomes.
A) The overlap in genetic content (95% identity level) between the oral and gut microbiomes. B) Distribution of ORF cluster sizes at 95% identity in our oral (blue) and gut (red) gene catalogs. C) Iterative clustering of our amino acid gene catalogs. D) Distribution of gene cluster sizes for amino acid gene catalogs generated at the 50% identity level. E) Sorensen-Dice index measuring dissimilarity in gene content between all pairs of individuals. F) Sorensen-Dice dissimilarity of individuals in terms of MetaPhlAn2-derived species content.
Figure 3:
Figure 3:. The known and unknown functional diversity of the oral and gut microbiomes.
A-B) Fractions of genes functionally annotated in the oral and gut microbiomes. Genes labeled with pathway annotations were used in the Minpath analyses. C) Sorensen-dice dissimilarity of individuals in terms of overall pathway content.
Figure 4:
Figure 4:. Enrichment of functions in gut/oral niches for singletons/non-singletons.
Here we display the top 50 most enriched pathways for oral singletons (A), oral non-singletons (B), gut singletons (C), and gut non-singletons (D). Blue bars are pathways enriched in both oral and gut non-singletons, red bars are pathways enriched in both oral and gut singletons, and the green bar is a pathway enriched in both oral singletons and gut non-singletons.
Figure 5:
Figure 5:. Singleton taxa as sub-population specific, rare strains.
A) Counts of taxonomic annotations for singleton and non-singleton contigs in the oral and gut microbiomes. B) Number of metagenomes singleton contigs and non-singleton contigs are present in for different taxonomies. Each point represents a different taxonomic annotation. C) Examples of strain-specific “fingerprints.” Each pair of rows corresponds to singleton and non-singleton contigs containing at least two genes that were binned into the same taxonomic annotation. Columns are different metagenomic samples (each corresponding to a different individual). Green boxes correspond to singleton contigs. Red boxes correspond to non-singleton contigs.
Figure 6:
Figure 6:. Extrapolating the gene content of the human microbiome.
A-B) Extrapolation of the universe of genes using curves fit to our oral microbiome data (A) and gut microbiome data (B). Yellow dashed lines demarcate sampling required to observe certain percentages of new singletons per sample. Purpose dashed line marks size of this study. Green dashed line is the asymptotic number of genes in the oral microbiome. C-D) Alternative, more conservative extrapolation methods for estimating total gene content in the oral/gut niches.

Similar articles

Cited by

References

    1. Almeida Alexandre, Mitchell Alex L., Boland Miguel, Forster Samuel C., Gloor Gregory B., Tarkowska Aleksandra, Lawley Trevor D., and Finn Robert D.. 2019. “A New Genomic Blueprint of the Human Gut Microbiota.” Nature, February 10.1038/s41586-019-0965-1. - DOI - PMC - PubMed
    1. Andrei Adrian-Ştefan, Salcher Michaela M., Mehrshad Maliheh, Rychtecký Pavel, Znachor Petr, and Ghai Rohit. 2019. “Niche-Directed Evolution Modulates Genome Architecture in Freshwater Planctomycetes.” The ISME Journal, January 10.1038/s41396-018-0332-5. - DOI - PMC - PubMed
    1. Ayling Martin, Clark Matthew D., and Leggett Richard M.. 2018. “New Approaches for Assembly of Short-Read Metagenomic Data.” e27332v1 PeerJ Preprints. 10.7287/peerj.preprints.27332v1. - DOI
    1. Bairoch A 2000. “The ENZYME Database in 2000.” Nucleic Acids Research 28 (1): 304–5. - PMC - PubMed
    1. Benjamini Yoav, and Yekutieli Daniel. 2001. “The Control of the False Discovery Rate in Multiple Testing under Dependency.” Annals of Statistics 29 (4): 1165–88.

LinkOut - more resources