. 2019 Aug 14;11(8):1165.
doi: 10.3390/cancers11081165.

Long-Term Dynamics of Three Dimensional Telomere Profiles in Circulating Tumor Cells in High-Risk Prostate Cancer Patients Undergoing Androgen-Deprivation and Radiation Therapy

Affiliations

Long-Term Dynamics of Three Dimensional Telomere Profiles in Circulating Tumor Cells in High-Risk Prostate Cancer Patients Undergoing Androgen-Deprivation and Radiation Therapy

Landon Wark et al. Cancers (Basel). .

Abstract

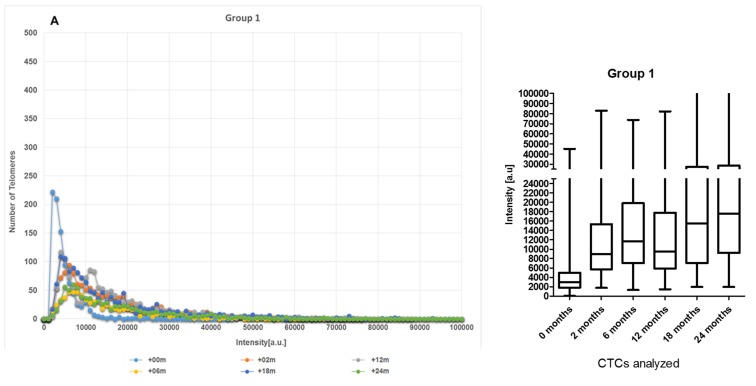
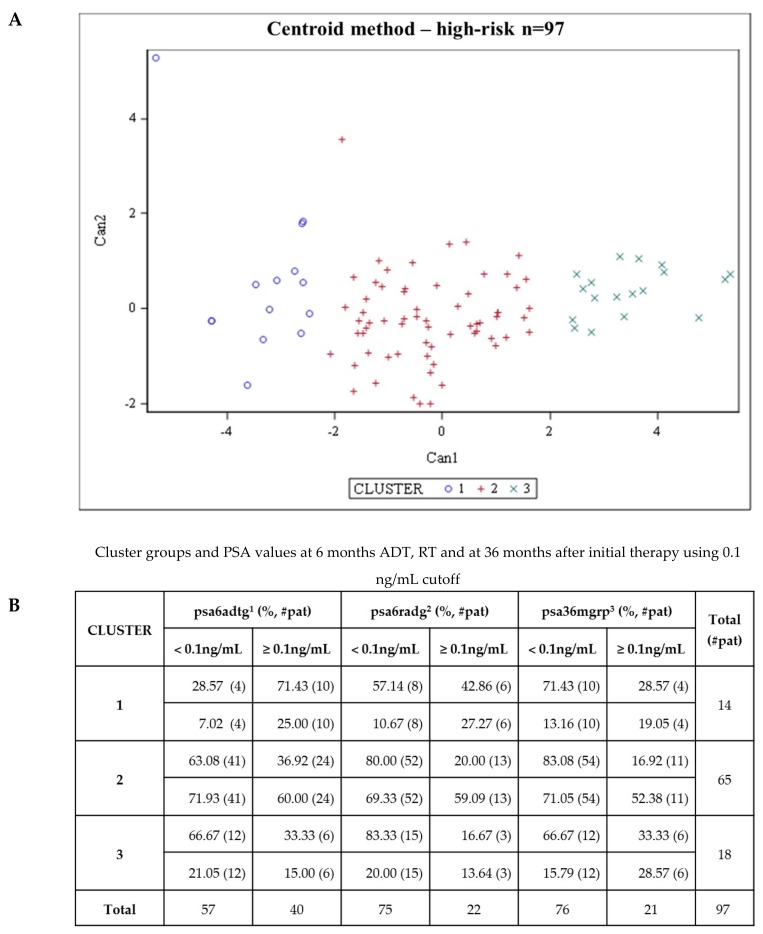
Patient-specific assessment, disease monitoring, and the development of an accurate early surrogate of the therapeutic efficacy of locally advanced prostate cancer still remain a clinical challenge. Contrary to prostate biopsies, circulating tumor cell (CTC) collection from blood is a less-invasive method and has potential as a real-time liquid biopsy and as a surrogate marker for treatment efficacy. In this study, we used size-based filtration to isolate CTCs from the blood of 100 prostate cancer patients with high-risk localized disease. CTCs from five time points: +0, +2, +6, +12 and +24 months were analyzed. Consenting treatment-naïve patients with cT3, Gleason 8-10, or prostate-specific antigen > 20 ng/mL and non-metastatic prostate cancer were included. For all time points, we performed 3D telomere-specific quantitative fluorescence in situ hybridization on a minimum of thirty isolated CTCs. The patients were divided into five groups based on the changes of number of telomeres vs telomere lengths over time and into three clusters based on all telomere parameters found on diagnosis. Group 2 was classified as non-respondent to treatment and the Cluster 3 presented more aggressive phenotype. Additionally, we compared our telomere results with the PSA levels for each patient at 6 months of ADT, at 6 months of completed RT, and at 36 months post-initial therapy. CTCs of patients with PSA levels above or equal to 0.1 ng/mL presented significant increases of nuclear volume, number of telomeres, and telomere aggregates. The 3D telomere analysis of CTCs identified disease heterogeneity among a clinically homogeneous group of patients, which suggests differences in therapeutic responses. Our finding suggests a new opportunity for better treatment monitoring of patients with localized high-risk prostate cancer.

Keywords: androgen deprivation therapy; circulating tumor cells; localized high-risk prostate cancer; radiotherapy; three-dimensional (3D) telomere profiling.


Conflict of interest statement

S.M. is a shareholder, director and chair of the clinical and scientific advisory board of Telo Genomics Corp. (Toronto, ON, Canada). The other authors declare that they have no conflicts of interest.

Figures

Figure 1
Figure 1
Summary timeline of treatment and PSA/CTC collection points over the course of the study. CTCs were collected and analyzed at 0 m (untreated), 2 m, 6 m, 12 m, 18 m and 24 months and PSA end levels at 6 months ADT, 6 months after finished RT and 36 months after initial treatment were used as early surrogates of treatment response.
Figure 2
Figure 2
Example of a circulating tumor cell from a high-risk localized prostate cancer patient captured on top of a filter pore (A) (The arrows show empty filter pores). The prostate cancer CTCs are recognized based of their AR positive staining (B). (B1) Two-dimensional image showing a CTC AR+ in FITC (green); (B2) CTC with the telomeres labeled with telomere-specific Cy3-labeled probe (red); (B3) Merge between FITC and telomeres; and (B4) CTC counterstained with DAPI in blue. In C (C1 and C2), the same cell is shown in three-dimensional representation. Red spots represent telomere signals; and the blue is DAPI.
Figure 3
Figure 3
(A) Representative examples of the CTCs dynamics of telomere length profiles over time for patients assigned to Group 1 (A), Group 2 (B), Group 3 (C), Group 4 (D), and Group 5 (E). In each graph, the telomere length is shown in arbitrary units of fluorescence (AU). Baseline profile (+0 month, untreated) and other time point (2, 6, 12, 18, 24 months) are demarked with colors. Bars plot were used to illustrate inter-sample variability of representative individual samples in the groups.
Figure 3
Figure 3
(A) Representative examples of the CTCs dynamics of telomere length profiles over time for patients assigned to Group 1 (A), Group 2 (B), Group 3 (C), Group 4 (D), and Group 5 (E). In each graph, the telomere length is shown in arbitrary units of fluorescence (AU). Baseline profile (+0 month, untreated) and other time point (2, 6, 12, 18, 24 months) are demarked with colors. Bars plot were used to illustrate inter-sample variability of representative individual samples in the groups.
Figure 4
Figure 4
Statistical analysis comparing the telomeres parameters at 0 month with PSA end value at 6 months after androgen deprivation therapy using 0.1 ng/mL cutoff (A). (B) Box-plots generated by Statistical Analysis Software v 9.4 (SAS, Cary, NC USA). The box is divided in the following way: —the median is the middle line, the 50th percentile- the top of box is the 75th percentile- the bottom box is the 25th percentile. Concerning the whiskers, the upper top of whiskers represent the max observation 1.5× (interquartile range (IQR)—75th percentile minus 25th percentile), while the bottom of whiskers represent the minimum observation 1.5× (1QR from 25th). The observations plotted are outliers—beyond the 1.5× IQR or below. The sign in the box is the mean. The box indicates where 50 percent of the observations lies, extending to the whiskers indicates where most of the data lies and the points outside are extremes.
Figure 5
Figure 5
Statistical analysis comparing the telomeres parameters at 0m with PSA end value at 6 months after radiotherapy using 0.1 ng/mL cutoff (A). (B) Box-plots generated by Statistical Analysis Software v. 9.4. The box is divided in the following way: —the median is the middle line, the 50th percentile- the top of box is the 75th percentile- the bottom box is the 25th percentile. Concerning the whiskers, the upper top of whiskers represent the max observation 1.5× (interquartile range (IQR)—75th percentile minus 25th percentile), while the bottom of whiskers represent the minimum observation 1.5×(1QR from 25th). The observations plotted are outliers—beyond the 1.5× IQR or below. The sign in the box is the mean. The box indicates where 50 percent of the observations lies, extending to the whiskers indicates where most of the data lies and the points outside are extremes.
Figure 6
Figure 6
Statistical analysis comparing the telomeres parameters at 0 month with PSA value at 36 months after initial therapy using 0.1 ng/mL cutoff (A). (B) Box-plots generated by Statistical Analysis Software v. 9.4. The box is divided in the following way: —the median is the middle line, the 50th percentile- the top of box is the 75th percentile- the bottom box is the 25th percentile. Concerning the whiskers, the upper top of whiskers represent the max observation 1.5× (interquartile range (IQR)—75th percentile minus 25th percentile), while the bottom of whiskers represent the minimum observation 1.5× (1QR from 25th). The observations plotted are outliers- beyond the 1.5× IQR or below. The sign in the box is the mean. The box indicates where 50 percent of the observations lies, extending to the whiskers indicates where most of the data lies and the points outside are extremes.
Figure 7
Figure 7
Centroid cluster analysis of 3D nuclear profiling of CTCs from 97 patients with high-risk prostate cancer (A). The combination of telomere parameters (Materials and Methods) allows the stratification of patients into clusters. Each cluster possesses a different level of genomic instability and different risk of future prostate mortality, based on their PSA end values after 6 months of ADT 6 months of RT, and 36 months after initial treatment (B). Patients in cluster 3 (green) had the highest percentage of patients with PSA ≥ 0.1ng/mL after treatment, while those in cluster 2 (red) and cluster 1 (blue) had an intermediate- to low percentage of patients with PSA ≥ 0.1ng/mL after treatment.

References

    1. Mohler J.L., Armstrong A.J., Bahnson R.R., D’Amico A.V., Davis B.J., Eastham J.A., Enke C.A., Farrington T.A., Higano C.S., Horwitz E.M., et al. Prostate cancer, version 1. 2016. J. Natl. Compr. Cancer Netw. 2016;14:19–30. doi: 10.6004/jnccn.2016.0004. - DOI - PubMed
    1. Sternberg C.N., Baskin-Bey E.S., Watson M., Worsfold A., Rider A., Tombal B. Treatment patterns and characteristics of European patients with castration-resistant prostate cancer. BMC Urol. 2013;13:58. doi: 10.1186/1471-2490-13-58. - DOI - PMC - PubMed
    1. Merseburger A.S., Alcaraz A., von Klot C.A. Androgen deprivation therapy as backbone therapy in the management of prostate cancer. Onco Targets Ther. 2016;9:7263–7274. doi: 10.2147/OTT.S117176. - DOI - PMC - PubMed
    1. Nguyen P.L., Martin N.E., Choeurng V., Palmer-Aronsten B., Kolisnik T., Beard C.J., Orio P.F., Nezolosky M.D., Chen Y.W., Shin H., et al. Utilization of biopsy-based genomic classifier to predict distant metastasis after definitive radiation and short-course ADT for intermediate and high-risk prostate cancer. Prostate Cancer Prostatic Dis. 2017;20:186–192. doi: 10.1038/pcan.2016.58. - DOI - PMC - PubMed
    1. Roach M., Hanks G., Thames H., Schellhammer P., Shipley W.U., Sokol G.H., Sandler H. Defining biochemical failure following radiotherapy with or without hormonal therapy in men with clinically localized prostate cancer: Recommendations of the RTOG-ASTRO Phoenix Consensus Conference. Int. J. Radiat. Oncol. 2006;65:965–974. doi: 10.1016/j.ijrobp.2006.04.029. - DOI - PubMed