

Ventilator-Associated Pneumonia and PaO2/FIO2 Diagnostic Accuracy: Changing the Paradigm?
- PMID: 31416285
- PMCID: PMC6722826
- DOI: 10.3390/jcm8081217
Ventilator-Associated Pneumonia and PaO2/FIO2 Diagnostic Accuracy: Changing the Paradigm?
Abstract
Background: Ventilator-associated pneumonia (VAP) is associated to longer stay and poor outcomes. Lacking definitive diagnostic criteria, worsening gas exchange assessed by PaO2/FIO2 ≤ 240 in mmHg has been proposed as one of the diagnostic criteria for VAP. We aim to assess the adequacy of PaO2/FIO2 ≤ 240 to diagnose VAP.
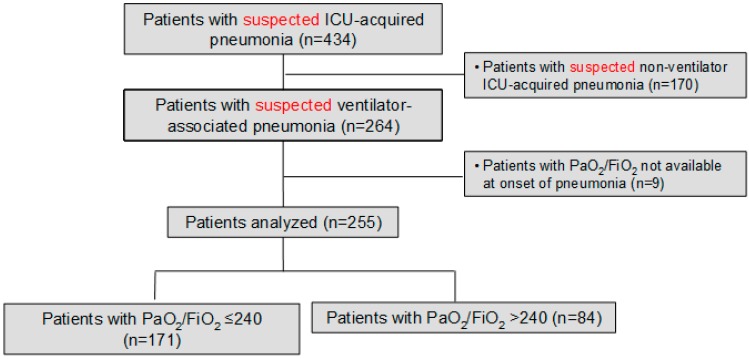
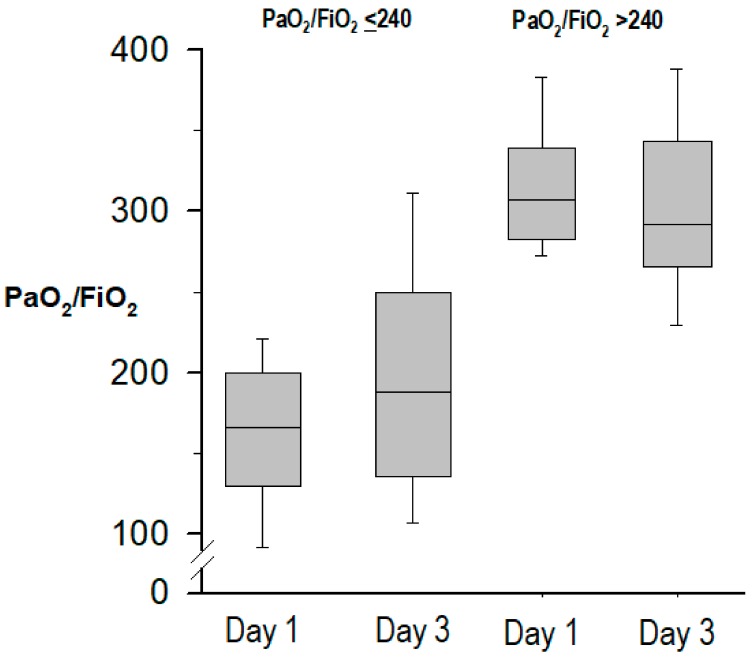
Methods: Prospective observational study in 255 consecutive patients with suspected VAP, clustered according to PaO2/FIO2 ≤ 240 vs. > 240 at pneumonia onset. The primary analysis was the association between PaO2/FIO2 ≤ 240 and quantitative microbiologic confirmation of pneumonia, the most reliable diagnostic gold-standard.
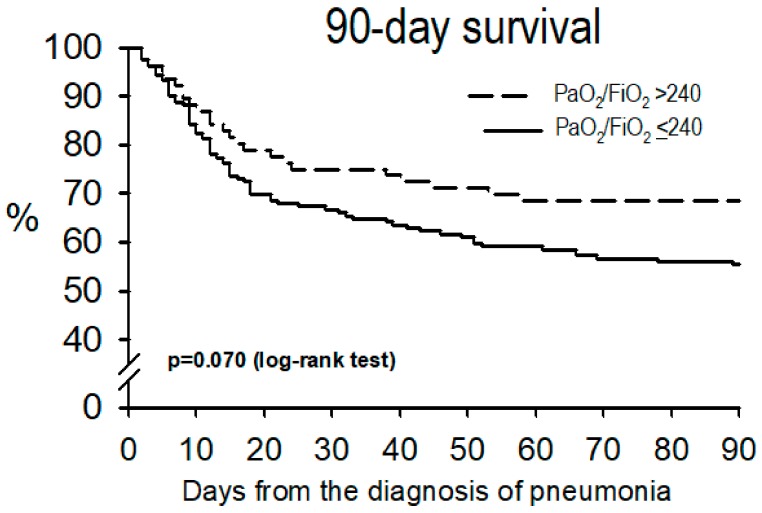
Results: Mean PaO2/FIO2 at VAP onset was 195 ± 82; 171 (67%) cases had PaO2/FIO2 ≤ 240. Patients with PaO2/FIO2 ≤ 240 had a lower APACHE-II score at ICU admission; however, at pneumonia onset they had higher CPIS, SOFA score, acute respiratory distress syndrome criteria and incidence of shock, and less microbiological confirmation of pneumonia (117, 69% vs. 71, 85%, p = 0.008), compared to patients with PaO2/FIO2 > 240. In multivariate logistic regression, PaO2/FIO2 ≤ 240 was independently associated with less microbiological confirmation (adjusted odds-ratio 0.37, 95% confidence interval 0.15-0.89, p = 0.027). The association between PaO2/FIO2 and microbiological confirmation of VAP was poor, with an area under the ROC curve 0.645. Initial non-response to treatment and length of stay were similar between both groups, while hospital mortality was higher in patients with PaO2/FIO2 ≤ 240.
Conclusion: Adding PaO2/FIO2 ratio ≤ 240 to the clinical and radiographic criteria does not help in the diagnosis of VAP. PaO2/FIO2 ratio > 240 does not exclude this infection. Using this threshold may underestimate the incidence of VAP.
Keywords: Intensive care unit; PaO2/FIO2.; nosocomial infection; ventilator-associated pneumonia.
Conflict of interest statement
The authors declare that they have no conflicts of interest.
Figures
References
-
- Kalil A.C., Metersky M.L., Klompas M., Muscedere J., Sweeney D.A., Palmer L.B., Napolitano L.M., O’Grady N.P., Bartlett J.G., Carratalà J., et al. Management of Adults with Hospital-acquired and Ventilator-associated Pneumonia: 2016 Clinical Practice Guidelines by the Infectious Diseases Society of America and the American Thoracic Society. Clin. Infect. Dis. 2016;63:e61–e111. doi: 10.1093/cid/ciw353. - DOI - PMC - PubMed
-
- Van Vught L.A., Klein Klouwenberg P.M.C., Spitoni C., Scicluna B.P., Wiewel M.A., Horn J., Schultz M.J., Nürnberg P., Bonten M.J.M., Cremer O.L., et al. Incidence, Risk Factors, and Attributable Mortality of Secondary Infections in the Intensive Care Unit After Admission for Sepsis. JAMA. 2016;315:1469–1479. doi: 10.1001/jama.2016.2691. - DOI - PubMed
Grants and funding
LinkOut - more resources
Full Text Sources
Molecular Biology Databases
