Penetrance and Pleiotropy of Polygenic Risk Scores for Schizophrenia in 106,160 Patients Across Four Health Care Systems
- PMID: 31416338
- PMCID: PMC6961974
- DOI: 10.1176/appi.ajp.2019.18091085
Penetrance and Pleiotropy of Polygenic Risk Scores for Schizophrenia in 106,160 Patients Across Four Health Care Systems
Abstract
Objective: Individuals at high risk for schizophrenia may benefit from early intervention, but few validated risk predictors are available. Genetic profiling is one approach to risk stratification that has been extensively validated in research cohorts. The authors sought to test the utility of this approach in clinical settings and to evaluate the broader health consequences of high genetic risk for schizophrenia.
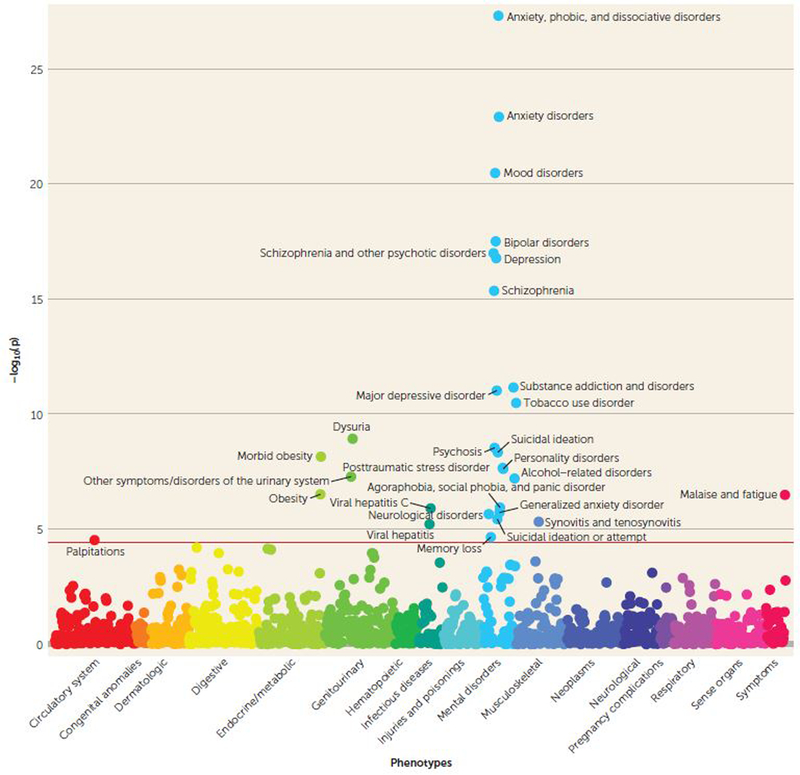
Methods: The authors used electronic health records for 106,160 patients from four health care systems to evaluate the penetrance and pleiotropy of genetic risk for schizophrenia. Polygenic risk scores (PRSs) for schizophrenia were calculated from summary statistics and tested for association with 1,359 disease categories, including schizophrenia and psychosis, in phenome-wide association studies. Effects were combined through meta-analysis across sites.
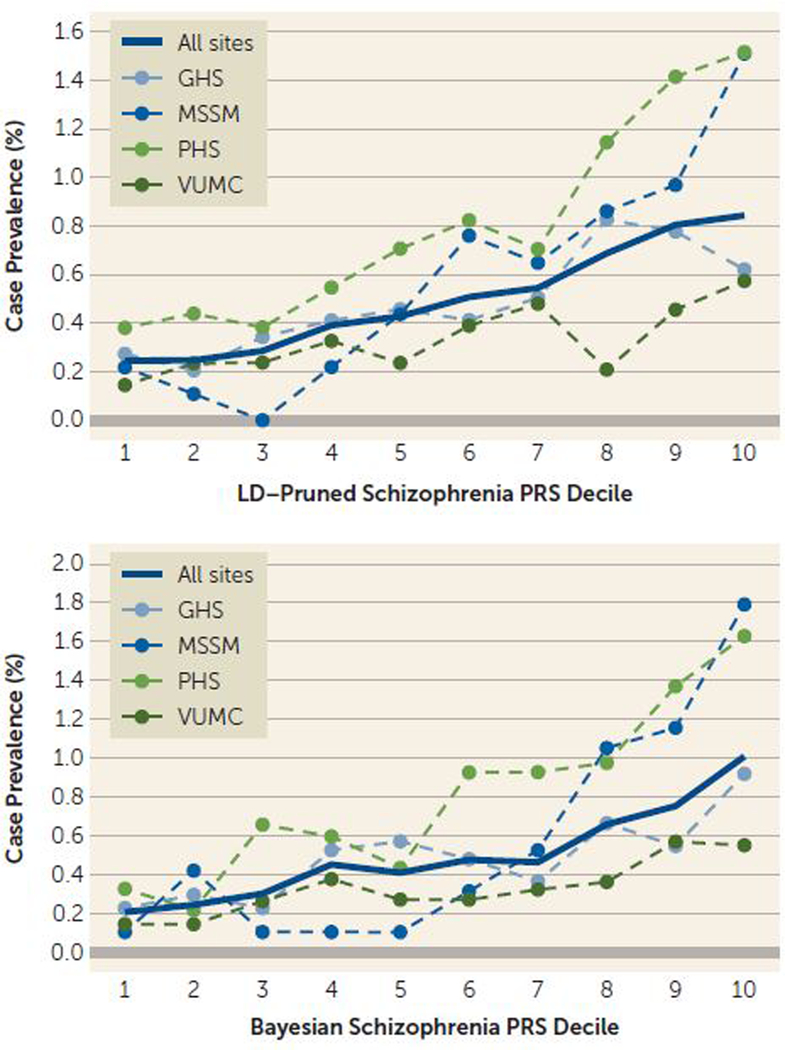
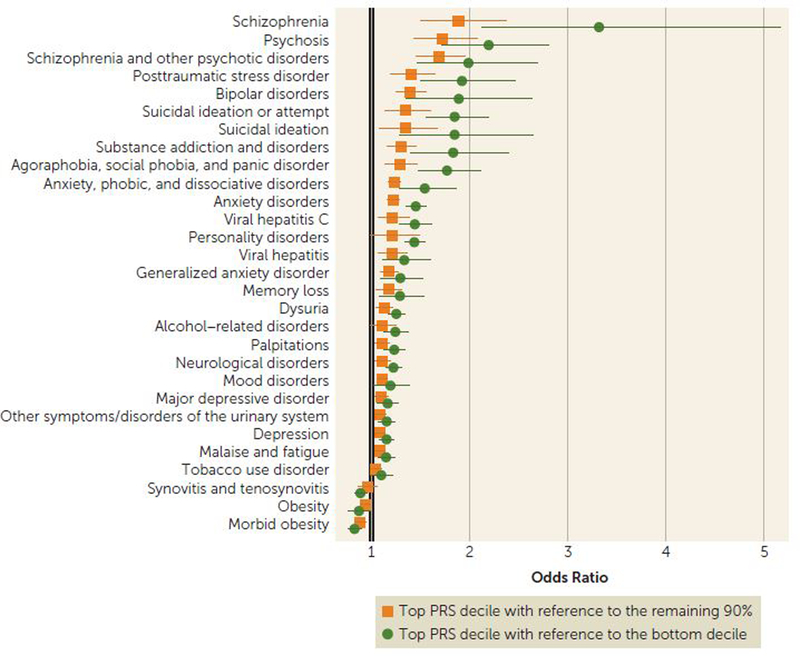
Results: PRSs were robustly associated with schizophrenia (odds ratio per standard deviation increase in PRS, 1.55; 95% CI=1.4, 1.7), and patients in the highest risk decile of the PRS distribution had up to 4.6-fold higher odds of schizophrenia compared with those in the bottom decile (95% CI=2.9, 7.3). PRSs were also positively associated with other phenotypes, including anxiety, mood, substance use, neurological, and personality disorders, as well as suicidal behavior, memory loss, and urinary syndromes; they were inversely related to obesity.
Conclusions: The study demonstrates that an available measure of genetic risk for schizophrenia is robustly associated with schizophrenia in health care settings and has pleiotropic effects on related psychiatric disorders as well as other medical syndromes. The results provide an initial indication of the opportunities and limitations that may arise with the future application of PRS testing in health care systems.
Keywords: Chronic Psychiatric Illness; Cognitive Neuroscience; Genetics; Schizophrenia.
Figures
Comment in
-
Polygenic Risk Scores in Schizophrenia: Ready for the Real World?Am J Psychiatry. 2019 Oct 1;176(10):783-784. doi: 10.1176/appi.ajp.2019.19080825. Am J Psychiatry. 2019. PMID: 31569989 No abstract available.
References
-
- Substance Abuse and Mental Health Services Administration (SAMHSA): Key Substance Use and Mental Health Indicators in the United States: Results From the 2016 National Survey on Drug Use and Health. Rockville, Md, SAMHSA, 2017
Publication types
MeSH terms
Grants and funding
- UL1 TR000445/TR/NCATS NIH HHS/United States
- K99 AG054573/AG/NIA NIH HHS/United States
- S10 RR025141/RR/NCRR NIH HHS/United States
- U01 HG008679/HG/NHGRI NIH HHS/United States
- P50 GM115305/GM/NIGMS NIH HHS/United States
- S10 OD025092/OD/NIH HHS/United States
- UL1 RR024975/RR/NCRR NIH HHS/United States
- R01 MH113362/MH/NIMH NIH HHS/United States
- R01 MH095034/MH/NIMH NIH HHS/United States
- R00 AG054573/AG/NIA NIH HHS/United States
- U19 HL065962/HL/NHLBI NIH HHS/United States
- R01 MH118233/MH/NIMH NIH HHS/United States
- U01 MH109536/MH/NIMH NIH HHS/United States
- P30 EY008126/EY/NEI NIH HHS/United States
- P30 CA068485/CA/NCI NIH HHS/United States
- R01 MH111776/MH/NIMH NIH HHS/United States
- R01 MH106531/MH/NIMH NIH HHS/United States
- UL1 TR002243/TR/NCATS NIH HHS/United States
- U01 HG008685/HG/NHGRI NIH HHS/United States
LinkOut - more resources
Full Text Sources
Medical