. 2019 Aug 16;20(1):620.
doi: 10.1186/s12864-019-5957-x.

Evaluating the quality of the 1000 genomes project data

Affiliations

Evaluating the quality of the 1000 genomes project data

Saurabh Belsare et al. BMC Genomics. .

Abstract

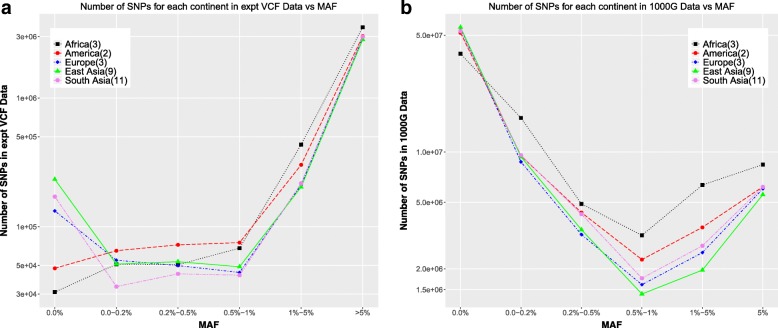
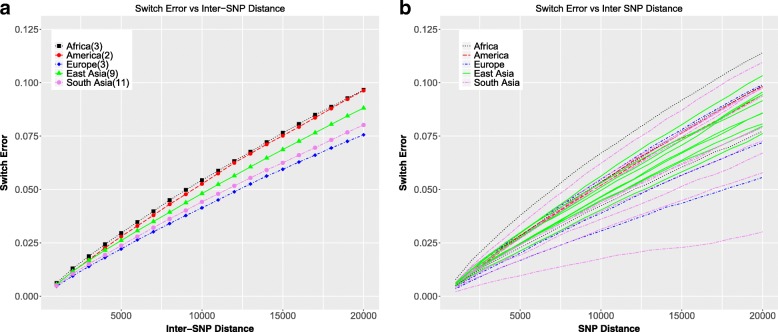
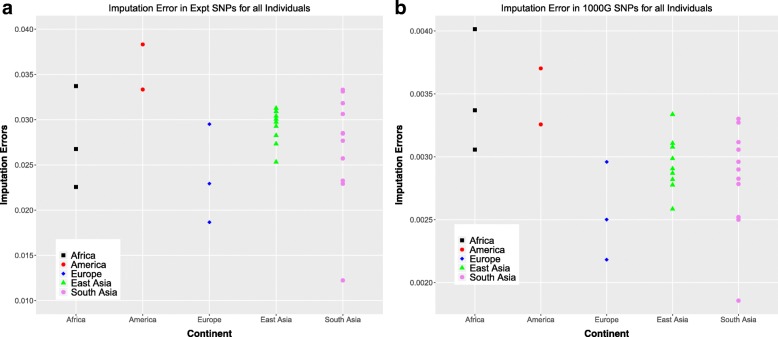
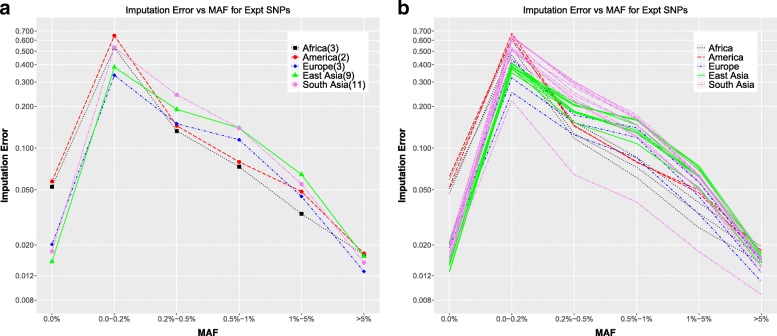
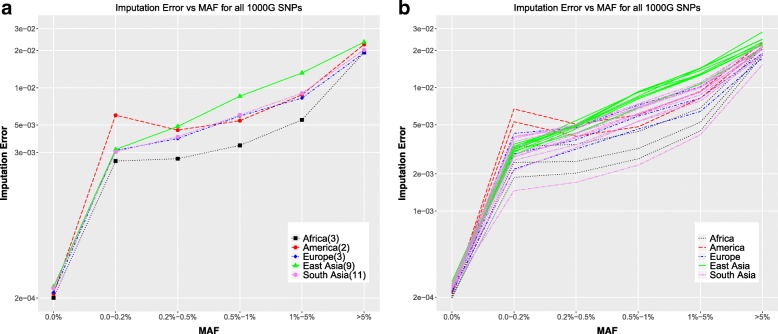
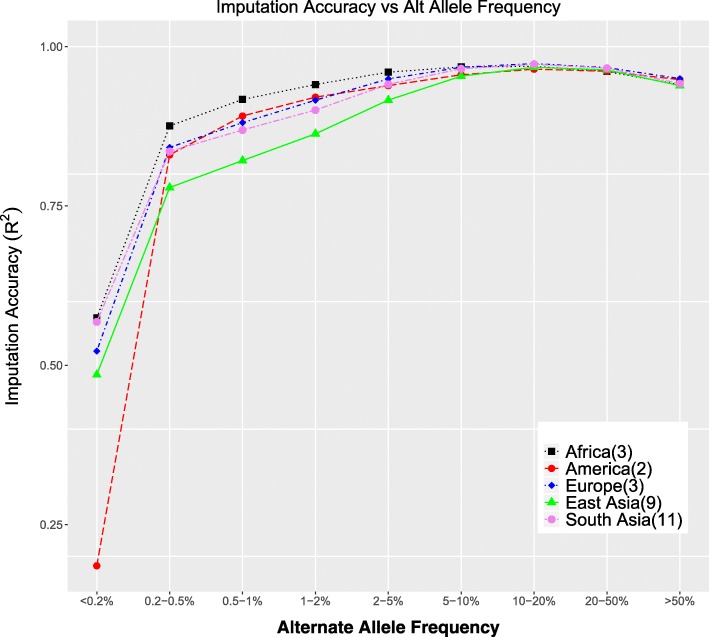
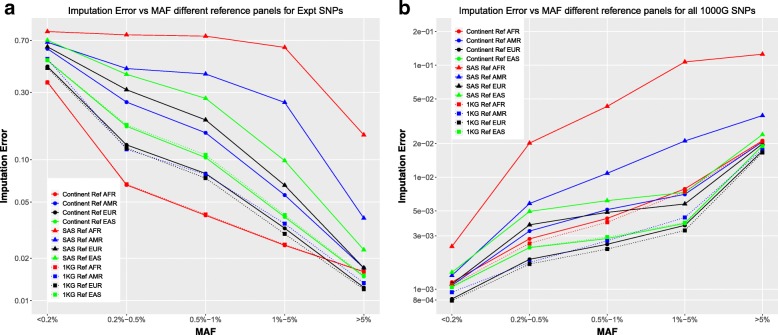
Background: Data from the 1000 Genomes project is quite often used as a reference for human genomic analysis. However, its accuracy needs to be assessed to understand the quality of predictions made using this reference. We present here an assessment of the genotyping, phasing, and imputation accuracy data in the 1000 Genomes project. We compare the phased haplotype calls from the 1000 Genomes project to experimentally phased haplotypes for 28 of the same individuals sequenced using the 10X Genomics platform.

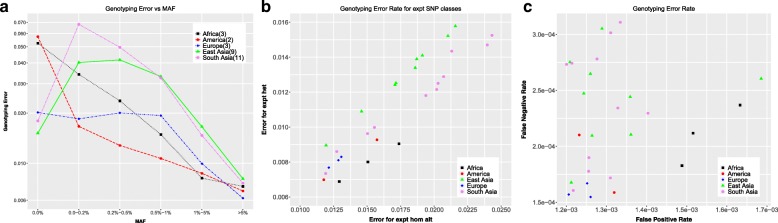
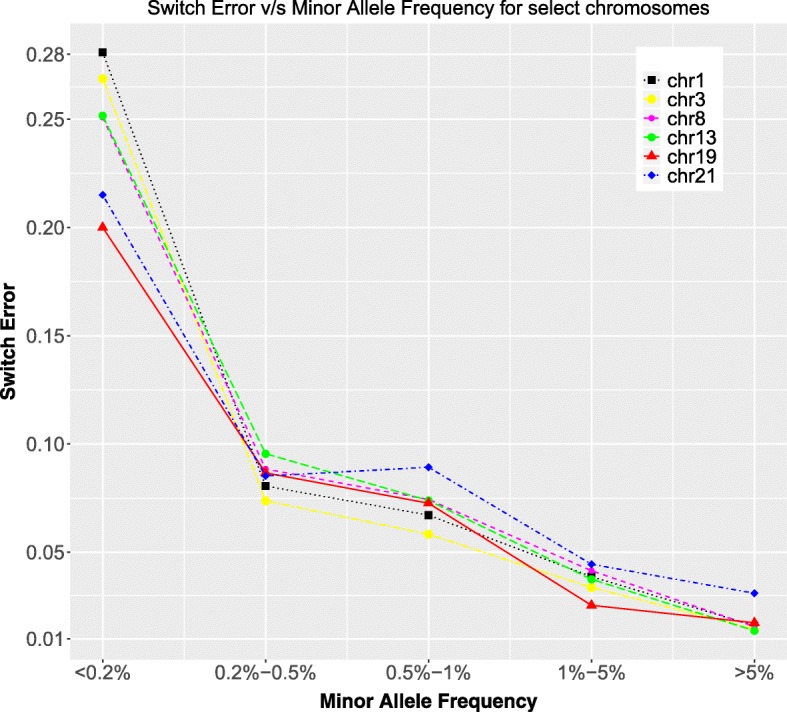
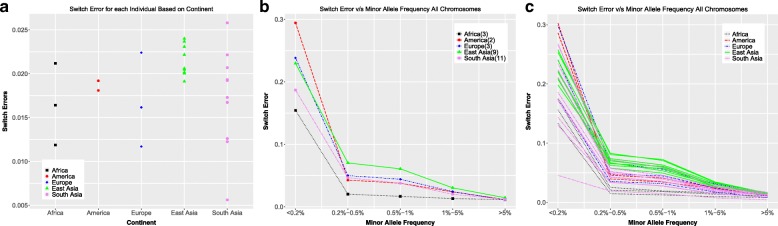
Results: We observe that phasing and imputation for rare variants are unreliable, which likely reflects the limited sample size of the 1000 Genomes project data. Further, it appears that using a population specific reference panel does not improve the accuracy of imputation over using the entire 1000 Genomes data set as a reference panel. We also note that the error rates and trends depend on the choice of definition of error, and hence any error reporting needs to take these definitions into account.

Conclusions: The quality of the 1000 Genomes data needs to be considered while using this database for further studies. This work presents an analysis that can be used for these assessments.

Keywords: 1000 genomes; Imputation; Phasing.


Conflict of interest statement

Genentech authors hold shares in Roche. The other authors declare no conflicts of interest.

Figures

Fig. 1
Fig. 1
Distribution of SNPs as a function of continent-specific minor allele frequencies a only experimental SNPs b all 1000 Genomes SNPs
Fig. 2
Fig. 2
Genotyping error a in the experimental VCF positions (non-hom ref. SNPs) as a function of continent-specific minor allele frequency averaged over all chromosomes over all individuals in each continent b in experimental VCF positions comparing SNPs with homozygous alternate vs heterozygous calls in the experimental data c false positive vs false negative rates (defined in text) for all 1000 Genomes SNPs
Fig. 3
Fig. 3
Switch error as a function of Minor Allele Frequencies for different individual chromosomes. Chromosome 21 shows higher switch error for large MAF values
Fig. 4
Fig. 4
Switch error a Total switch error (number of switches in experimental SNPs/total number of experimental SNPs) for each individual b Switch error as a function of Minor Allele Frequencies averaged over all individuals in each continent. c Switch error as a function of Minor Allele Frequencies for all individuals colored by continent
Fig. 5
Fig. 5
Switch error as a function of inter-SNP distance a Switch error as a function of inter-SNP distances averaged over individuals in each continent. b Switch error as a function of inter-SNP distances for all individuals colored by continent
Fig. 6
Fig. 6
Total imputation error a Total imputation error in experimental SNPs (number of incorrect genotypes in all experimental SNPs/total number of experimental SNPs) for each individual b Total imputation error in all 1000GP SNPs (number of incorrect genotypes in all 1000GP SNPs/total number of 1000GP SNPs) for each individual
Fig. 7
Fig. 7
Imputation accuracy experimental VCF positions a Imputation error in the experimental SNPs as a function of Minor Allele Frequencies averaged over individuals in each continent. b Imputation error in the experimental SNPs as a function of Minor Allele Frequencies for all individuals colored by continent
Fig. 8
Fig. 8
Imputation accuracy all 1000GP SNPs a Imputation error in all the 1000 Genomes positions as a function of Minor Allele Frequencies averaged over individuals in each continent. b Imputation error in all the 1000 Genomes positions as a function of Minor Allele Frequencies for all individuals colored by continent
Fig. 9
Fig. 9
Imputation accuracy all 1000GP SNPs r2 for allele frequency bins
Fig. 10
Fig. 10
Imputation error as a function of Minor Allele Frequencies for AFR (red), AMR (blue), EUR (black), and EAS (green) individuals comparing the continent specific reference panel (solid lines + circles), a different continent specific panel (SAS, dotted lines + squares), and the entire 1000G reference panel (dashed lines + triangles) a experimental SNPs b All 1000 Genomes SNPs

References

    1. Altshuler DL, et al. A map of human genome variation from population-scale sequencing. Nature. 2010;467:1061–1073. doi: 10.1038/nature09534. - DOI - PMC - PubMed
    1. Altshuler DM, et al. An integrated map of genetic variation from 1,092 human genomes. Nature. 2012;491:56–65. doi: 10.1038/nature11632. - DOI - PMC - PubMed
    1. Auton A, et al. A global reference for human genetic variation. Nature. 2015;526:68–74. doi: 10.1038/nature15393. - DOI - PMC - PubMed
    1. Tewhey R, Bansal V, Torkamani A, Topol EJ, Schork NJ. The importance of phase information for human genomics. Nat Rev Genet. 2011;12:215–223. doi: 10.1038/nrg2950. - DOI - PMC - PubMed
    1. Browning SR, Browning BL. Haplotype phasing : existing methods and new developments. Nat Publ Gr. 2011;12:703–714. - PMC - PubMed

LinkOut - more resources