. 2019 Oct 11;294(41):14991-15002.
doi: 10.1074/jbc.RA119.009578. Epub 2019 Aug 15.

A genetic mouse model of severe iron deficiency anemia reveals tissue-specific transcriptional stress responses and cardiac remodeling

Affiliations

A genetic mouse model of severe iron deficiency anemia reveals tissue-specific transcriptional stress responses and cardiac remodeling

Andrew J Schwartz et al. J Biol Chem. .

Abstract

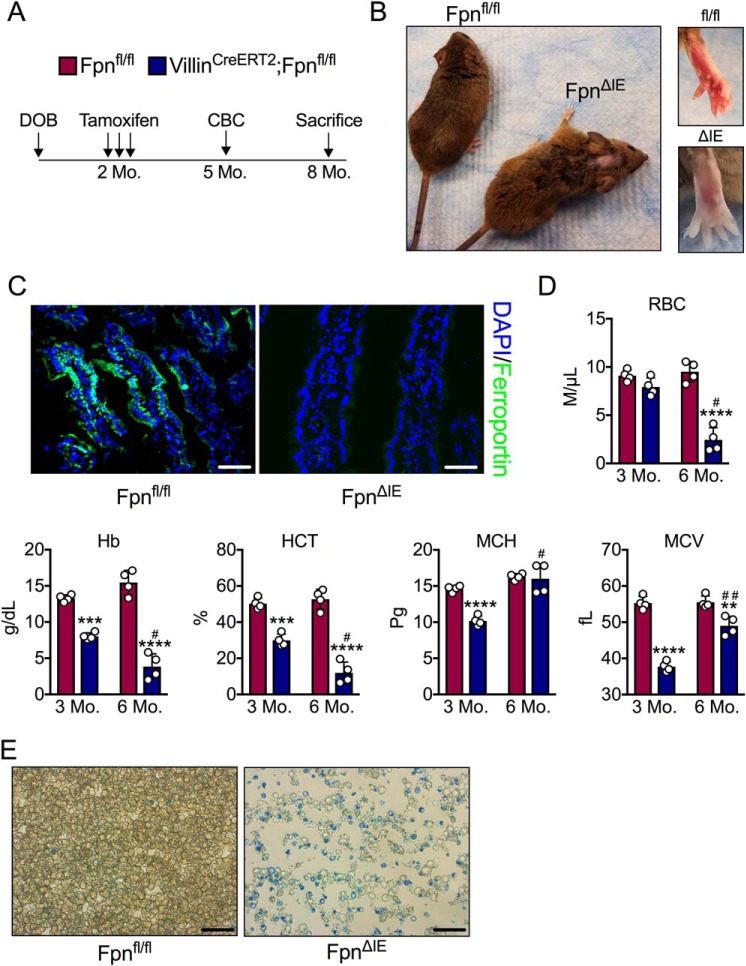
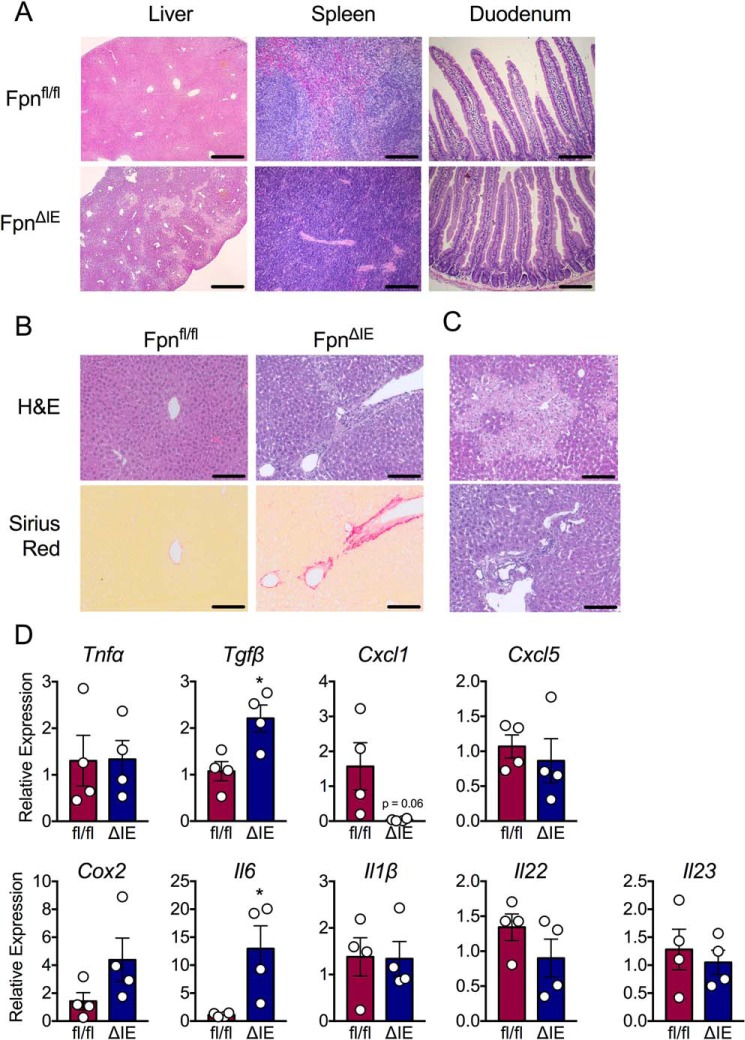
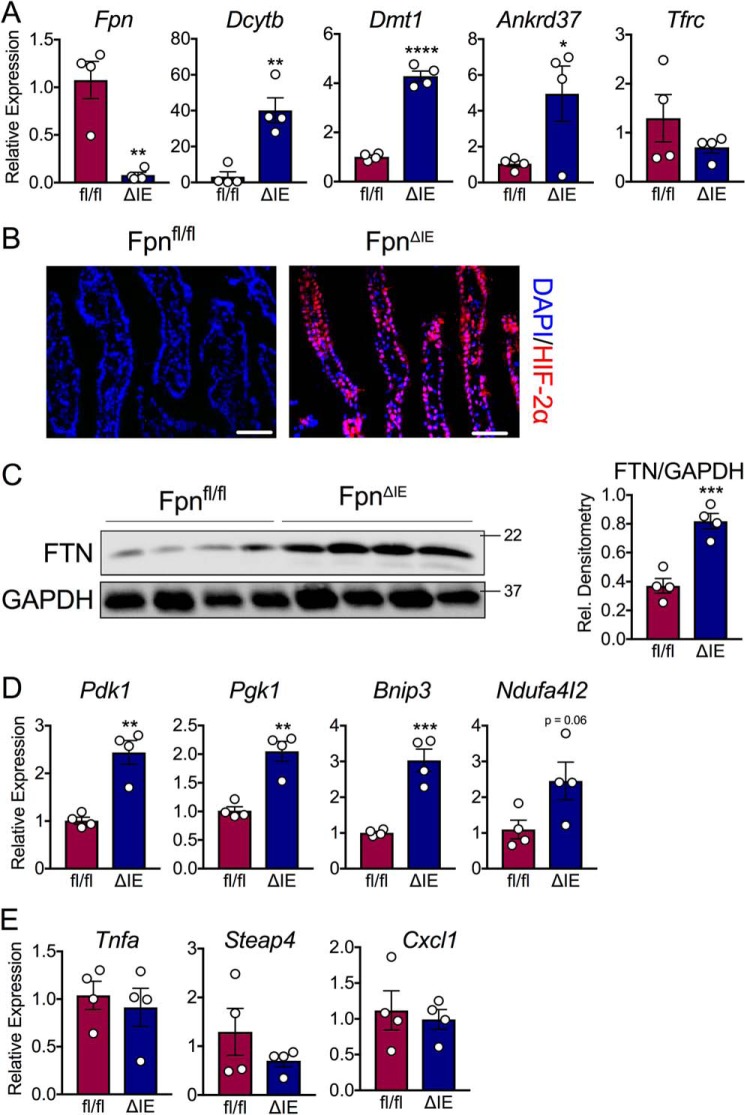
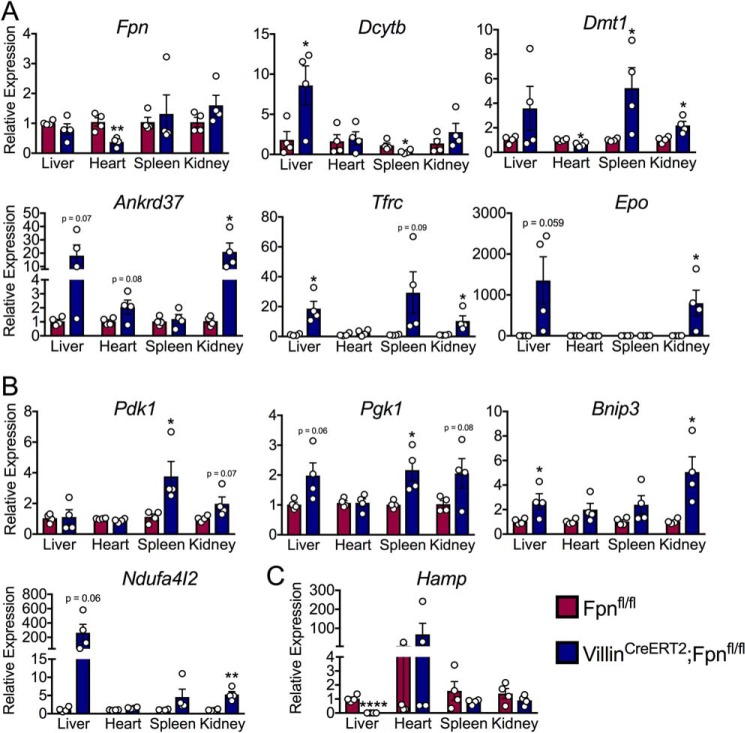
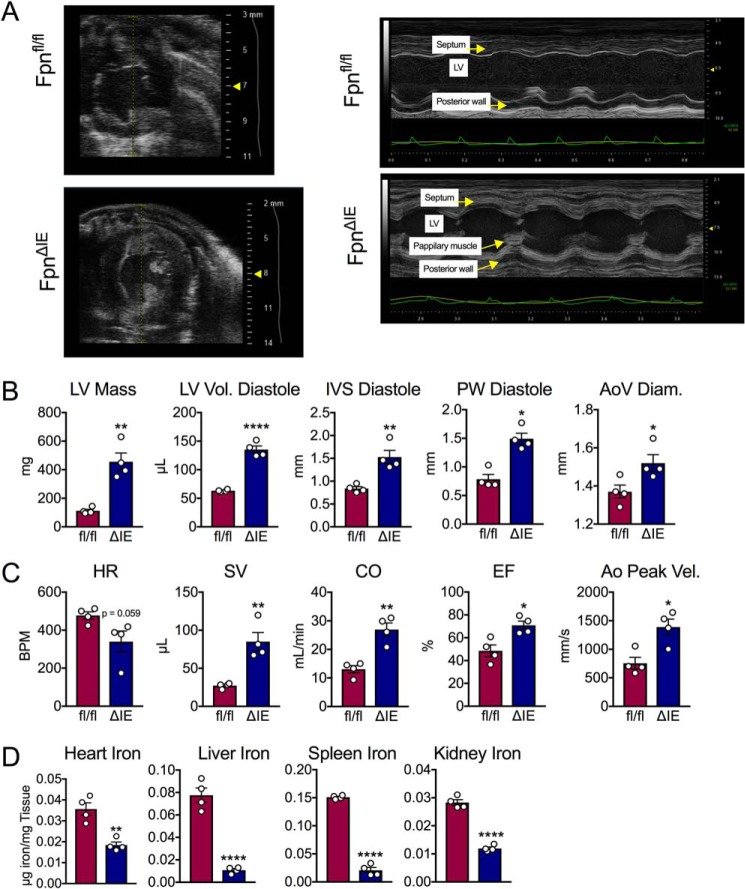
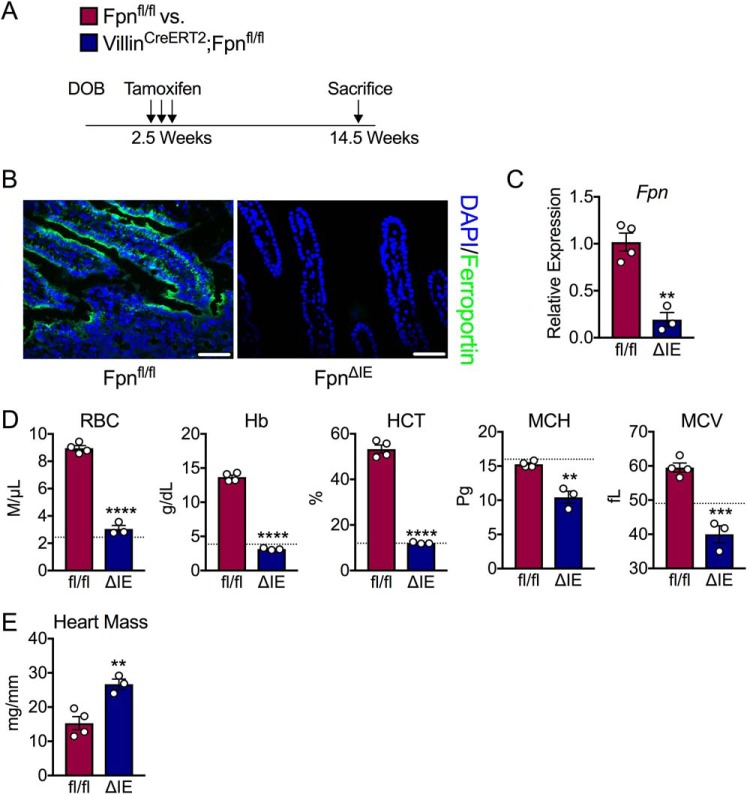
Iron is a micronutrient fundamental for life. Iron homeostasis in mammals requires sustained postnatal intestinal iron absorption that maintains intracellular iron concentrations for central and systemic metabolism as well as for erythropoiesis and oxygen transport. More than 1 billion people worldwide suffer from iron deficiency anemia (IDA), a state of systemic iron insufficiency that limits the production of red blood cells and leads to tissue hypoxia and intracellular iron stress. Despite this tremendous public health concern, very few genetic models of IDA are available to study its progression. Here we developed and characterized a novel genetic mouse model of IDA. We found that tamoxifen-inducible deletion of the mammalian iron exporter ferroportin exclusively in intestinal epithelial cells leads to loss of intestinal iron absorption. Ferroportin ablation yielded a robust phenotype of progressive IDA that develops in as little as 3 months following disruption of intestinal iron absorption. We noted that, at end-stage IDA, tissue-specific transcriptional stress responses occur in which the heart shows little to no hypoxic and iron stress compared with other peripheral organs. However, morphometric and echocardiographic analysis revealed massive cardiac hypertrophy and chamber dilation, albeit with increased cardiac output at very low basal heart rates. We propose that our intestine-specific ferroportin knockout mouse model of end-stage IDA could be used in future studies to investigate IDA progression and cell-specific responses to hypoxic and iron stress.

Keywords: animal model; hypoxia; hypoxia-inducible factor (HIF); iron; iron metabolism.


Conflict of interest statement

The authors declare that they have no conflicts of interest with the contents of this article. The content is solely the responsibility of the authors and does not necessarily represent the official views of the National Institutes of Health

Figures

Figure 1.
Figure 1.
Intestinal epithelial ferroportin deletion in adult mice gives rise to progressive and end-stage iron deficiency anemia. A, schematic of the experimental design. Mo, month. DOB, date of birth; CBC, complete blood count. B, gross images of Fpnfl/fl and FpnΔIE mice 6 months after tamoxifen administration. C, representative ferroportin staining in duodenal sections of Fpnfl/fl and FpnΔIE mice; images at ×40, scale bars = 100 μm. DAPI, 4′,6-diamidino-2-phenylindole. D, analysis of RBCs, Hb, HCT, MCH, and MCV 3 and 6 months following tamoxifen injection. E, representative methylene blue staining for reticulocytes; images at ×60, scale bars = 150 μm. Mean ± S.E. are plotted. **, p < 0.01; ***, p < 0.001; ****, p < 0.0001 compared between Fpnfl/fl and FpnΔIE cohorts within each time point using two-tailed unpaired t test. #, p < 0.05; ##, p < 0.01 compared between individual FpnΔIE mice at the 3- and 6-month time points using two-tailed paired t test.
Figure 2.
Figure 2.
Histological analysis of peripheral organs involved in iron homeostasis reveals inflammation and necrosis in the liver. A, representative H&E analysis of liver at ×5 (scale bars = 50 μm) and spleen and duodenum at ×20 (scale bars = 200 μm) from Fpnfl/fl and FpnΔIE cohorts. B, representative H&E and picrosirius red analysis of liver from Fpnfl/fl and FpnΔIE cohorts; images ×20, scale bars = 200 μm. C, additional representative H&E images of liver from FpnΔIE cohorts; images at ×20, scale bars = 200 μm. D, qPCR analysis of inflammatory genes in livers of Fpnfl/fl and FpnΔIE cohorts. All data are from mice 6 months post-tamoxifen treatment. Mean ± S.E. are plotted. Significance was determined using two-tailed unpaired t test. *, p < 0.5 compared between Fpnfl/fl and FpnΔIE cohorts.
Figure 3.
Figure 3.
Iron deficiency anemia leads to transcriptional activation of iron and hypoxic target genes in the intestine despite intestinal epithelial iron retention. A, qPCR analysis for duodenal HIF-2α–specific and iron-handling transcripts. B, representative HIF-2α staining in duodenal sections of Fpnfl/fl and FpnΔIE mice; images at ×40, scale bars = 100 μm. DAPI, 4′,6-diamidino-2-phenylindole. C, Western blot analysis and quantification of duodenal FTN abundance. Rel., relative. D, qPCR analysis of duodenal HIF-1α–specific transcripts. E, qPCR analysis of duodenal HIF-2α–specific and inflammatory transcripts. All data are from mice 6 months post-tamoxifen treatment. Mean ± S.E. are plotted. Significance was determined using two-tailed unpaired t test. *, p < 0.5; **, p < 0.01; ***, p < 0.001; ****, p < 0.0001 compared between Fpnfl/fl and FpnΔIE cohorts.
Figure 4.
Figure 4.
The heart is spared from hypoxic and iron stresses that affect peripheral tissues during iron deficiency anemia. A, qPCR analysis of HIF-2α–specific and iron-handling transcripts in the liver, heart, spleen, and kidney. B, qPCR analysis of HIF-1α–specific transcripts in the liver, heart, spleen, and kidney. C, qPCR analysis of hepcidin (Hamp) in the liver, heart, spleen, and kidney. All data are from mice 6 months post-tamoxifen treatment. Mean ± S.E. are plotted. Significance was determined using two-tailed unpaired t test. *, p < 0.5; **, p < 0.01; ****, p < 0.0001 compared between Fpnfl/fl and FpnΔIE cohorts within each tissue group.
Figure 5.
Figure 5.
Echocardiogram analysis of iron deficiency anemia reveals cardiomegaly and disruption of cardiac function. A, M-mode images from echocardiogram analysis in Fpnfl/fl and FpnΔIE mice with end-stage iron deficiency anemia. B, quantification of cardiac structure parameters: left ventricular mass (LV Mass), left ventricular volume at diastole (LV Vol. Diastole), interventricular septum width at diastole (IVS Diastole), posterior wall thickness at diastole (PW Diastole), and ascending aorta diameter (AoV Diam.). C, quantification of cardiac function parameters: heart rate (HR), stroke volume (SV), cardiac output (CO), ejection fraction (EF), and aorta velocity peak gradient (Ao Peak Vel.). D, heart, liver, spleen, and kidney iron content. All data are from mice 6 months post-tamoxifen treatment. Mean ± S.E. are plotted. Significance was determined using two-tailed unpaired t test. *, p < 0.5; **, p < 0.01; ****, p < 0.0001 compared between Fpnfl/fl and FpnΔIE cohorts
Figure 6.
Figure 6.
End-stage iron deficiency anemia develops more rapidly when induced in young mice. A, schematic of the experimental design. DOB, date of birth. B, representative ferroportin staining in duodenal sections of Fpnfl/fl and FpnΔIE mice; images at ×40, scale bars = 100 μm. C, qPCR analysis of the duodenal Fpn transcript in Fpnfl/fl and FpnΔIE mice. D, analysis of RBCs, Hb, HCT, MCH, and MCV. The dashed lines indicate 6-month values observed in the experiment with FpnΔIE adult mice reported in Fig. 1. E, heart mass normalized to tibia length. All data are from mice 3 months post-tamoxifen treatment. Mean ± S.E. are plotted. Significance was determined using two-tailed unpaired t test. **, p < 0.01; ***, p < 0.001; ****, p < 0.0001 compared between Fpnfl/fl and FpnΔIE cohorts.

References

    1. Drakesmith H., Nemeth E., and Ganz T. (2015) Ironing out ferroportin. Cell Metab. 22, 777–787 10.1016/j.cmet.2015.09.006 - DOI - PMC - PubMed
    1. McLean E., Cogswell M., Egli I., Wojdyla D., and de Benoist B. (2009) Worldwide prevalence of anaemia, WHO Vitamin and Mineral Nutrition Information System. 1993–2005. Public Health Nutr. 12, 444–454 10.1017/S1368980008002401 - DOI - PubMed
    1. Muckenthaler M. U., Rivella S., Hentze M. W., and Galy B. (2017) A red carpet for iron metabolism. Cell 168, 344–361 10.1016/j.cell.2016.12.034 - DOI - PMC - PubMed
    1. Camaschella C. (2015) Iron-deficiency anemia. N. Engl. J. Med. 372, 1832–1843 10.1056/NEJMra1401038 - DOI - PubMed
    1. Heeney M. M., and Finberg K. E. (2014) Iron-refractory iron deficiency anemia (IRIDA). Hematol. Oncol. Clin. North Am. 28, 637–652 10.1016/j.hoc.2014.04.009 - DOI - PubMed

Publication types

LinkOut - more resources