. 2019 Sep 20;365(6459):1267-1273.
doi: 10.1126/science.aau2078. Epub 2019 Aug 15.

Genetic behavioral screen identifies an orphan anti-opioid system

Affiliations

Genetic behavioral screen identifies an orphan anti-opioid system

Dandan Wang et al. Science. .

Abstract

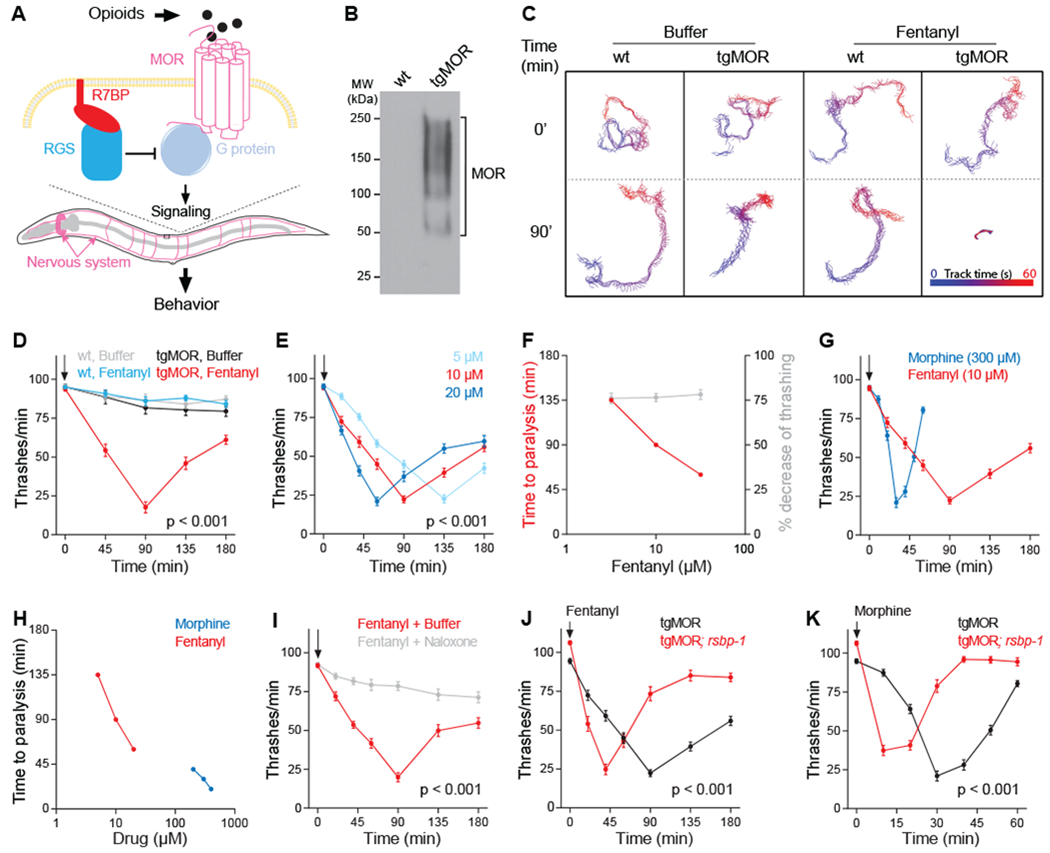
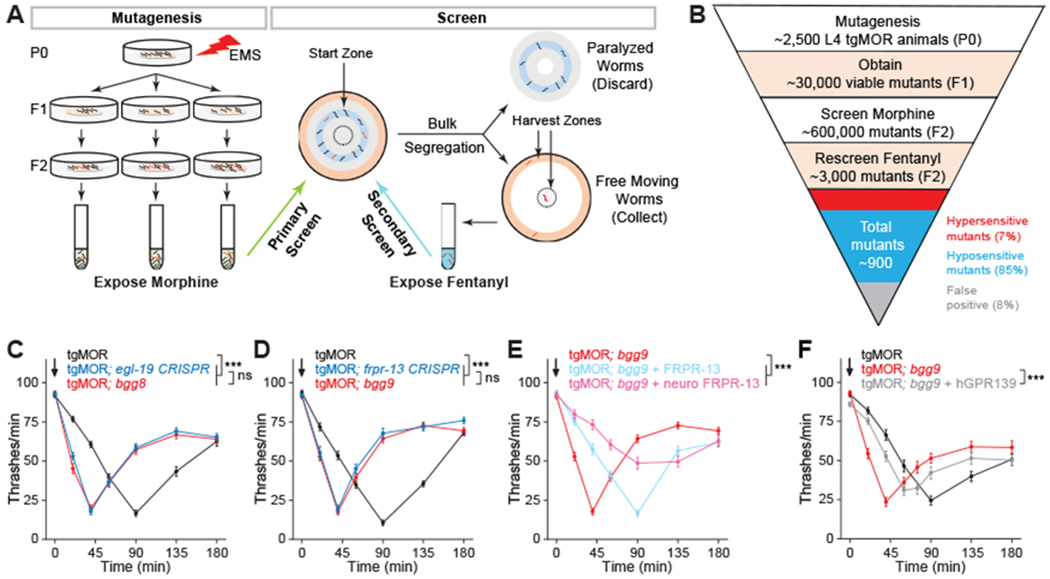
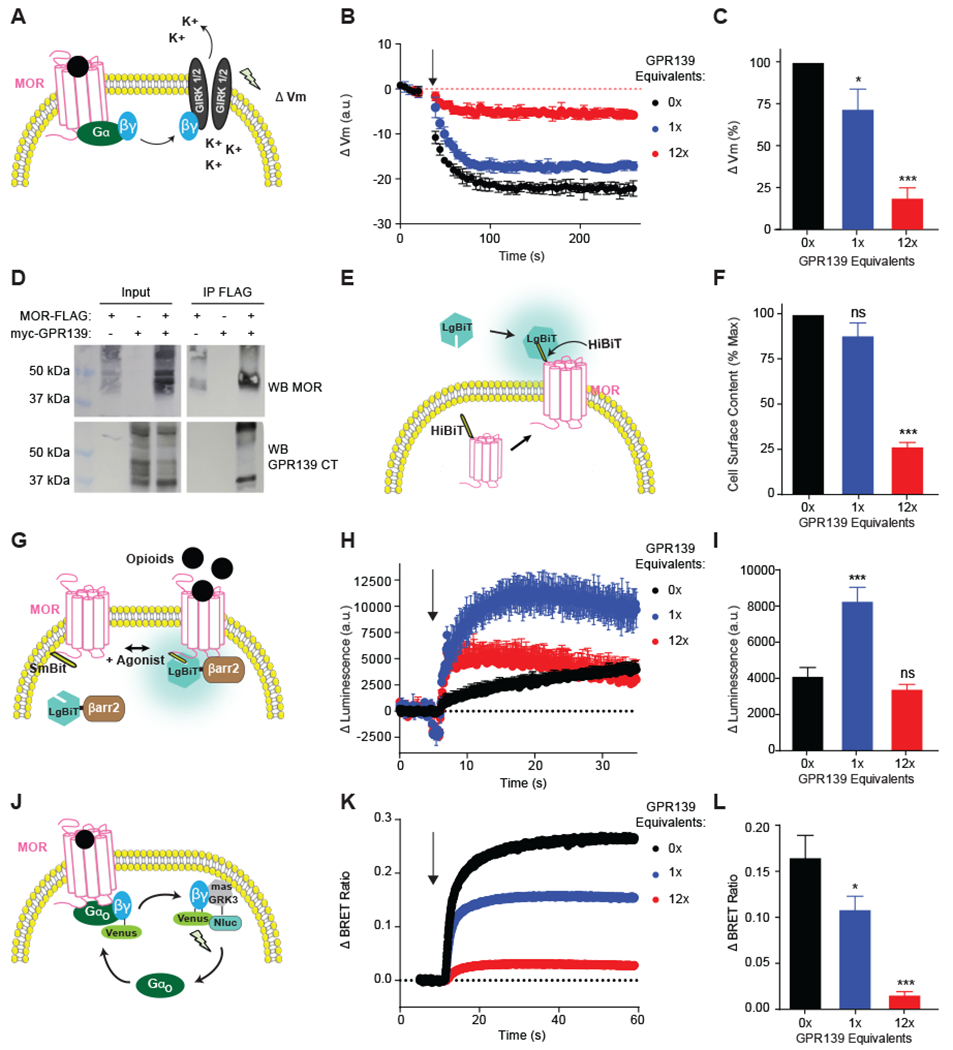
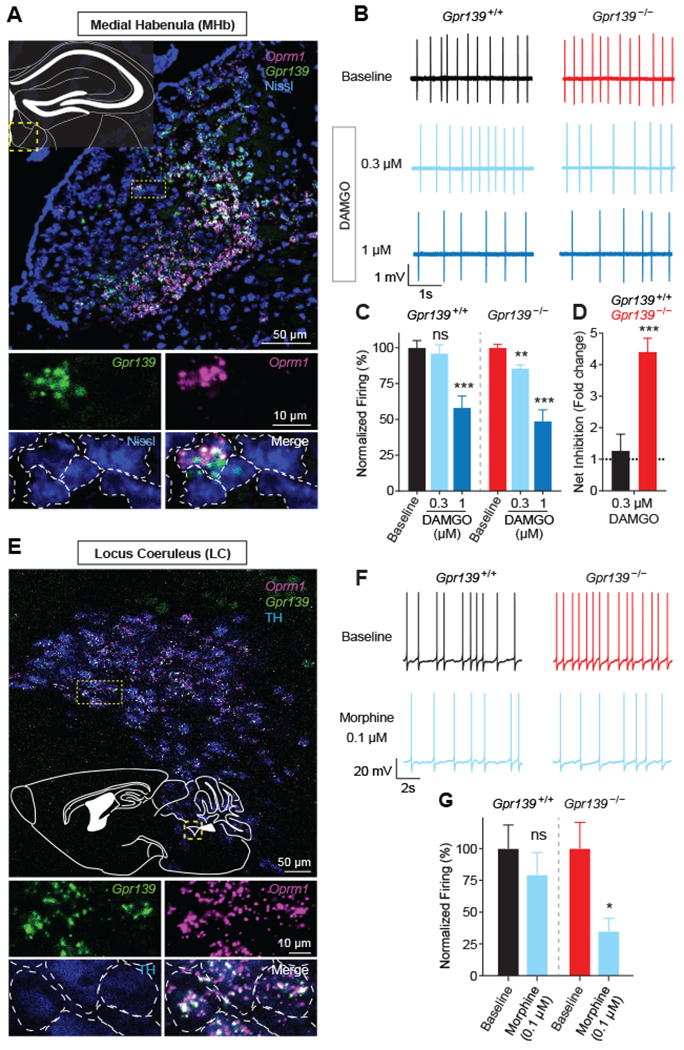
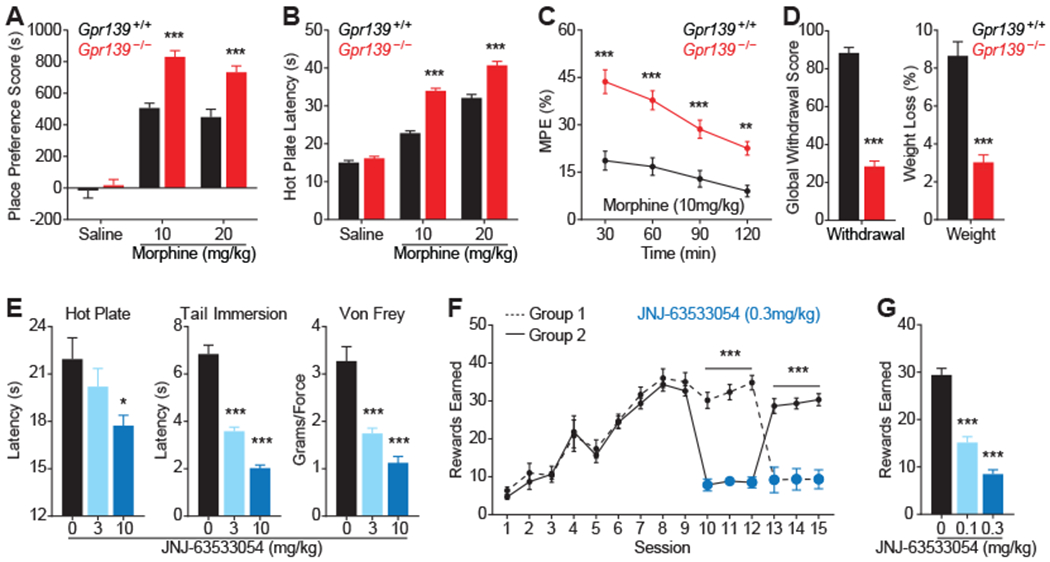
Opioids target the μ-opioid receptor (MOR) to produce unrivaled pain management, but their addictive properties can lead to severe abuse. We developed a whole-animal behavioral platform for unbiased discovery of genes influencing opioid responsiveness. Using forward genetics in Caenorhabditis elegans, we identified a conserved orphan receptor, GPR139, with anti-opioid activity. GPR139 is coexpressed with MOR in opioid-sensitive brain circuits, binds to MOR, and inhibits signaling to heterotrimeric guanine nucleotide-binding proteins (G proteins). Deletion of GPR139 in mice enhanced opioid-induced inhibition of neuronal firing to modulate morphine-induced analgesia, reward, and withdrawal. Thus, GPR139 could be a useful target for increasing opioid safety. These results also demonstrate the potential of C. elegans as a scalable platform for genetic discovery of G protein-coupled receptor signaling principles.


Conflict of interest statement

Competing Interests: B.G. and K.A.M have filed a patent on the utility of GPR139 as a drug target.

Figures

Fig. 1.
Fig. 1.. Transgenic C. elegans platform for dissecting opioid signaling mechanisms.
(A) Transgenic C. elegans model of MOR signaling (tgMOR). (B) Western blot showing expression of FLAG::MOR in the nervous system after immunoprecipitation. (C) Fentanyl inhibits thrashing of tgMOR. (D) Quantitation of fentanyl effects on tgMOR. (E) Time course of fentanyl doses on tgMOR. (F) Fentanyl dose response for tgMOR. (G) Time course for morphine and fentanyl on tgMOR. (H) Morphine and fentanyl dose response for tgMOR. (I) Naloxone blocks fentanyl effects on tgMOR. (J, K) Time courses showing tgMOR; rsbp-1 mutants are hypersensitive to (J) fentanyl and (K) morphine. Arrows denote drug application. If not indicated, opioids were used at the following concentrations: fentanyl (10μM), morphine (300μM) and naloxone (20μM). For all genotypes and drug conditions, means are shown from 30 or more animals obtained from three independent experiments. Error bars are S.E.M. Significance tested using two-way ANOVA. P values reported are for genotype/time interactions.
Fig. 2.
Fig. 2.. Forward genetic screen with tgMOR platform identifies orphan receptor FRPR-13 as negative regulator of MOR signaling.
(A) Two-step genetic screen for tgMOR mutants with altered opioid sensitivity. (B) Outline of steps, generations, number of independent mutants isolated, and phenotypic categories observed for genetic screen with tgMOR. (C) tgMOR; bgg8 mutants are hypersensitive to fentanyl and CRISPR/Cas9 editing validates egl-19 as gene causing hypersensitivity. (D) tgMOR; bgg9 mutants are hypersensitive to fentanyl and CRISPR/Cas9 editing validates frpr-13 as gene causing hypersensitivity. (E) Transgenic expression of FRPR-13 using native or neuronal promoters reverses fentanyl hypersensitivity in tgMOR; bgg9 animals. (F) Transgenic expression of human GPR139 reverses fentanyl hypersensitivity in tgMOR; bgg9 animals. Arrows denote fentanyl (10μM) application. For all genotypes and drug conditions, means are shown from 30 or more animals obtained from three independent experiments. Error bars are S.E.M. Significance tested using two-way ANOVA. *** p<0.001 and ns = not significant
Fig. 3.
Fig. 3.. GPR139 inhibits MOR signaling.
(A) Experimental design for evaluating MOR signaling via its effector GIRK. MOR activation leads to Gβγ subunit release, which opens GIRK channels to produce membrane hyperpolarization (Vm) that is measured with voltage sensitive dye. (B) Coexpression of GPR139 inhibits MOR-mediated kinetics of membrane potential change in response to morphine (0.1 μM). (C) Quantification shows GPR139 reduces morphine effects on Vm amplitude. (D) Co-immunoprecipitation of MOR-FLAG and myc-GPR139 following their coexpression. (E) Experimental design for evaluating cell surface abundance of MOR. HiBiT-tagged MOR complements the LargeBiT (LgBiT) nanoluciferase enzyme only at the plasma membrane. (F) Quantification of the maximal cell surface content of HiBiT-MOR indicates that GPR139 inhibits MOR surface localization only at high (12X) expression levels. (G) Experimental design for evaluating agonist-induced β-arrestin recruitment to MOR. Recruitment of β-arrestin2-LgBiT to SmBiT-MOR generates a functional nanoluciferase enzyme. (H) Effect of GPR139 coexpression on the kinetics of β-arrestin2-LgBiT recruitment induced by DAMGO (10 μM). (I) Quantification shows that low level GPR139 coexpression increases the extent of β-arrestin2 recruitment to MOR. (J) Experimental design for evaluating MOR signaling to G proteins by BRET assay that monitors MOR-mediated release of Gβγ subunits. (K) Effect of GPR139 coexpression on the kinetics of G protein activation by MOR in response to morphine (1 μM) application. (L) Quantification shows GPR139 coexpression reduces maximal BRET response of MOR-Gαo signaling. All experiments were performed in HEK293T cells. In all panels, means are shown from 3-5 independent experiments with 3-4 replicates each ± S.E.M. Significance tested by one-way ANOVA with Dunnett’s post-hoc test. *** p<0.001, ** p<0.01, * p<0.05. Arrows denote application of opioids.
Fig. 4.
Fig. 4.. GPR139 inhibits opioid modulation of neuronal firing.
(A) In situ hybridization showing extensive coexpression of MOR mRNA (Oprm1) and Gpr139 in medial habenula (MHb) neurons. (B) Representative traces showing changes in MHb neuron firing in response to different doses of DAMGO in Gpr139+/+ and Gpr139−/− mice. (C) Quantification of normalized firing frequency in MHb neurons shows responsiveness to low DAMGO concentration (0.3μM) in Gpr139−/− but not Gpr139+/+ (n = 11 cells from 6 mice per genotype). (D) Quantification shows MHb neurons from Gpr139−/− animals have increased net inhibition of neuronal firing following DAMGO treatment. (E) In situ hybridization showing Oprm1 and Gpr139 coexpression in locus coeruleus (LC) neurons. (F) Representative traces showing changes in LC neuron firing in response to morphine in Gpr139+/+ and Gpr139−/− mice. (G) Quantification indicates morphine inhibits firing of LC neurons from Gpr139−/− mice but not Gpr139+/+ animals (n = 7-9 cells from 4-6 mice per genotype). All results were reported as mean ± SEM. Significance tested using unpaired Students’ t test. *p < 0.05; **p < 0.01; ***p < 0.001, ns = not significant
Fig. 5.
Fig. 5.. GPR139 controls behavioral sensitivity of mice to opioid administration.
(A) Conditioned place preference paradigm showing increased reward in Gpr139−/− mice. (B) Hot plate assay showing increased dose-dependent, anti-nociceptive effects of morphine in Gpr139−/− mice. (C) Gpr139−/− animals have increased duration of morphine analgesia in hot plate assay. (D) Gpr139−/− mice have decreased behavioral responses and weight loss to naloxone-precipitated somatic withdrawal following chronic morphine exposure. Global score reflects aggregate measure of several withdrawal signs (diarrhea, jumps, dog shakes, paw tremor, back walking, tremor and ptosis). (E) Augmentation of GPR139 function by JNJ63533054 decreases analgesia induced by morphine (10 mg/kg) across pain models. (F) Activation of GPR139 by JNJ63533054 inhibits morphine intake (0.3 mg/kg/infusion) in self-administration task. (G) Quantification of JNJ63533054 effects on morphine self-administration. Significance tested using two-way ANOVA or Student’s t-test. Animal numbers for each test provided in Methods. *** p<0.001, * p<0.05

Comment in

References

    1. Lefkowitz RJ, Seven transmembrane receptors: something old, something new. Acta physiologica (Oxford, England) 190, 9–19 (2007). - PubMed
    1. Offermanns S, G-proteins as transducers in transmembrane signalling. Prog Biophys Mol Biol 83, 101–130 (2003). - PubMed
    1. Hauser AS et al., Pharmacogenomics of GPCR Drug Targets. Cell 172, 41–54 e19 (2018). - PMC - PubMed
    1. Sriram K, Insel PA, G Protein-Coupled Receptors as Targets for Approved Drugs: How Many Targets and How Many Drugs? Mol Pharmacol 93, 251–258 (2018). - PMC - PubMed
    1. Santos R et al., A comprehensive map of molecular drug targets. Nat Rev Drug Discov 16, 19–34 (2017). - PMC - PubMed

Publication types