

Review
doi: 10.1038/s41467-019-11394-4.
Ice sheets matter for the global carbon cycle
Affiliations
- PMID: 31417076
- PMCID: PMC6695407
- DOI: 10.1038/s41467-019-11394-4
Item in Clipboard
Review
Ice sheets matter for the global carbon cycle
Nat Commun.
.
Erratum in
-
Publisher Correction: Ice sheets matter for the global carbon cycle.Nat Commun. 2019 Sep 9;10(1):4084. doi: 10.1038/s41467-019-11997-x. Nat Commun. 2019. PMID: 31501445 Free PMC article.
Abstract
The cycling of carbon on Earth exerts a fundamental influence upon the greenhouse gas content of the atmosphere, and hence global climate over millennia. Until recently, ice sheets were viewed as inert components of this cycle and largely disregarded in global models. Research in the past decade has transformed this view, demonstrating the existence of uniquely adapted microbial communities, high rates of biogeochemical/physical weathering in ice sheets and storage and cycling of organic carbon (>104 Pg C) and nutrients. Here we assess the active role of ice sheets in the global carbon cycle and potential ramifications of enhanced melt and ice discharge in a warming world.
Conflict of interest statement
The authors declare no competing interests.
Figures
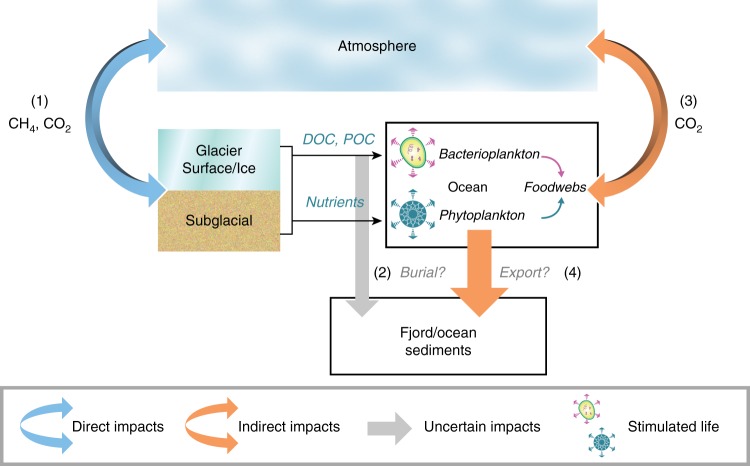
Conceptual diagram of ice sheets in the global carbon cycle. The diagram indicates the potential direct and indirect impacts of ice sheets. (1) direct sequestration or emission of CO2/CH4 by microbial activity in ice sheets, (2) burial of terrestrial OM exported from ice sheets by rivers, (3) emission of CO2 by respiration or uptake by primary production in the oceans (4) export production–OM produced by primary production which is not recycled before it sinks to the ocean floor
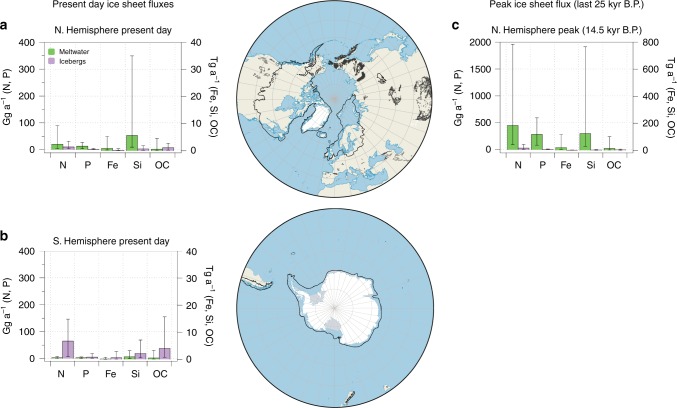
Fluxes of nutrients and organic carbon. Fluxes of bioavailable nutrients and organic carbon associated with subglacial meltwater and ice discharge from (a) northern and (b) southern hemisphere ice sheets at the present day and (c) northern hemisphere ice sheets during Meltwater Pulse 1a (14.5 kyr B.P.). LGM extents of ice sheets in both hemispheres are indicated by a black line in the maps. Nutrient fluxes and their uncertainty refer to the following species: N = DIN + loosely sediment bound NH4+ (also including loosely bound NO3− for icebergs), P = DIP + bioavailable sediment bound P (MgCl2-P + NaOH-P), Fe = DFe (<0.02 μm) + CNFe (colloidal/nanoparticulate Fe, 0.02–0.45 μm) + SSFe (sediment-bound ascorbic acid extractable nanoparticulate Fe, e.g., ferrihydrite), Si = DSi + ASi and OC = POC + DOC. All fluxes include minimum, maximum and mid-range estimates calculated from published estimates of the range of nutrient concentrations and freshwater fluxes. Please see Supplementary Methods for flux calculations, error bars and the full dataset (note the different y axis scales in Northern Hemisphere peak fluxes)
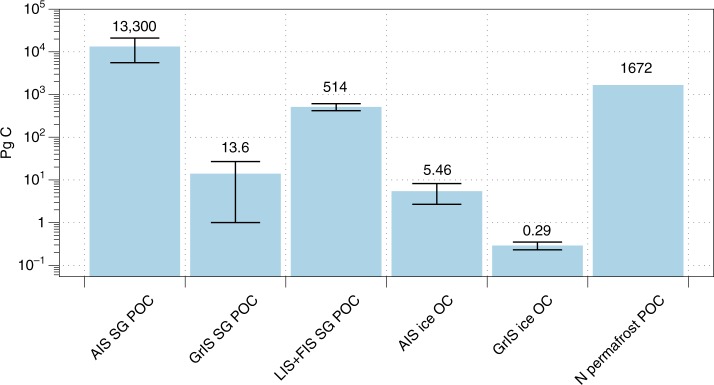
Carbon inventories for present day and former ice sheets. Data presented includes minimum, mid-range and maximum estimates. Antarctic Subglacial POC (AIS SG POC), minimum estimates are calculated assuming a sediment depth of 1 km, sedimentary basin areas of 1 × 10⁶ km2 for WAIS and 2.5 × 10⁶ km2 for EAIS, a rock density of 2650 kg m-3, a porosity of 0.3 and a POC of 0.1%, maximum estimates are derived from ref. . and mid-range values as the average between the two, Greenland Ice Sheet Subglacial POC (GrIS SG POC, minimum estimates calculated assuming a POC of c. 0.2%, sediment thicknesses of 0.1 m and a porosity of 0.4, maximum estimates assuming a POC of 0.44%, sediment thicknesses of 2 m and a porosity of 0.3 and mid-range values as the average between the two), Laurentide + Fennoscandian Ice Sheet Subglacial POC (LIS + FIS SG POC, minimum, maximum and mid-range estimates from ref. ), Antarctic Ice Sheet englacial POC + DOC (AIS ice OC, mid-range, minimum and maximum values from ref. , where the min/max values only include DOC due to lack of data), Greenland Ice Sheet ice-bound POC + DOC (GrIS ice OC, mid-range, minimum and maximum values from ref. , where the min/max values only include DOC due to lack of data) and Northern hemisphere permafrost (N permafrost POC)
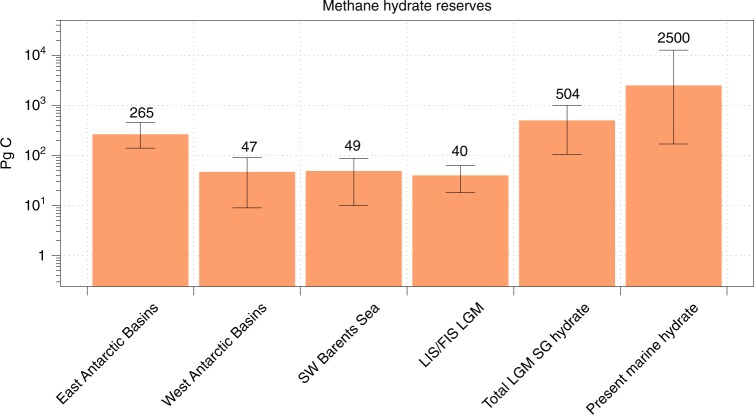
Potential methane hydrate reserves beneath present and former ice sheets. Data presented includes minimum, mid-range and maximum estimates of carbon reserves. East Antarctic Ice Sheet sedimentary basin methane hydrate + free gas (AIS hydrate, minimum and maximum values taken from ref. , with mid-range values as the average between the two), West Antarctic Ice Sheet sedimentary basin methane hydrate + free gas (WAIS hydrate, minimum and maximum estimates taken from ref. , with mid-range values as the average between the two), the SW Barents Sea LGM hydrate (mid-range values are the average of the minimum and maximum published values from ref. ), Laurentide and Fennoscandian Ice Sheet estimates of potential methane hydrate (minimum and mid-range estimates from estimates of methane hydrate carbon modelled in ref. . and maximum estimates taken from calculations in ref. ) (LIS/FIS LGM), Total LGM subglacial (SG) hydrate + free gas (sum of all data presented, with SW Barents Sea estimates scaled to the entire formerly glaciated Barents Sea Shelf hydrate scaled to the entire shelf), global present day marine methane hydrate, mid-range estimates (2500 Pg C) from ref. , minimum and maximum estimates from ref. (170–12,700 Pg C)
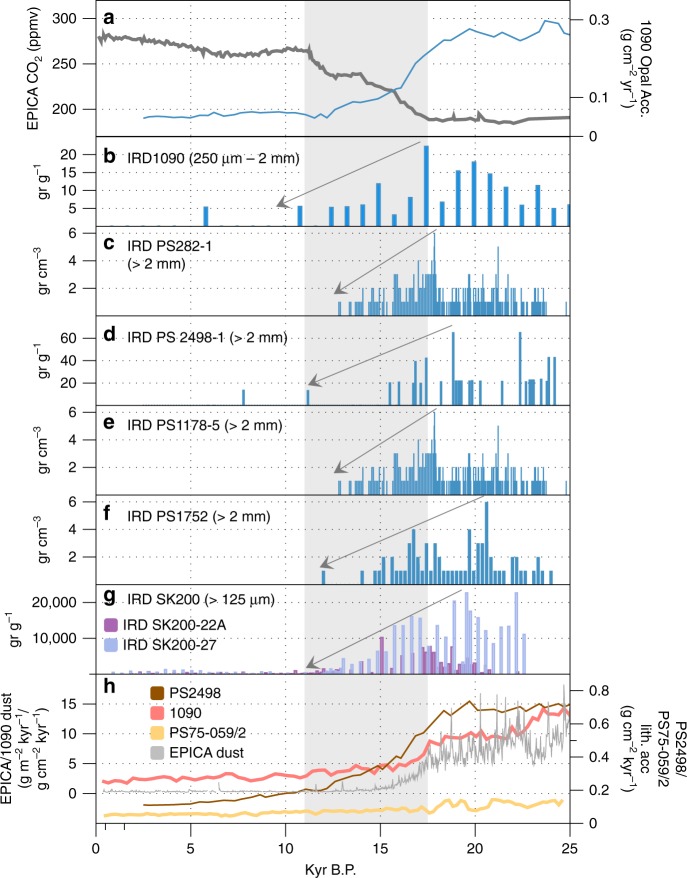
Temporal variability in the Southern Ocean. Temporal variation in atmospheric CO2, marine opal accumulation, Ice-rafted debris (IRD) and total lithogenic inputs to the Southern Ocean over the past 25 ka: a atmospheric CO2 concentrations (EPICA Dome C, dark grey line) and opal accumulation in sub-Antarctic cores 1090/PS2498-1174 (blue line), (b) IRD in core 1090, (c) IRD in core PS282-1 where the IRD data are from ref. and the Depth/Age model is from Ref. , (d) IRD in core PS2498-1 where the IRD data are from ref. and the Depth/Age model is from ref. , (e) IRD core PS1778-5, where the IRD data are from ref. and the Depth/Age model is from ref. , (f), IRD in core PS1752, where the IRD data are from ref. and the Depth/Age model is from ref. . g IRD in cores SK200-22A and SK200-27 from the Indian Ocean sector of the Southern Ocean. h Lithogenic fluxes to the Southern Ocean for marine cores 1090, PS2498-1 and PS75-059/2 alongside the EPICA Dome C dust flux record. The shaded area indicates the period of maximum CO2 increase during deglaciation. See Supplementary Fig. 3 for core locations
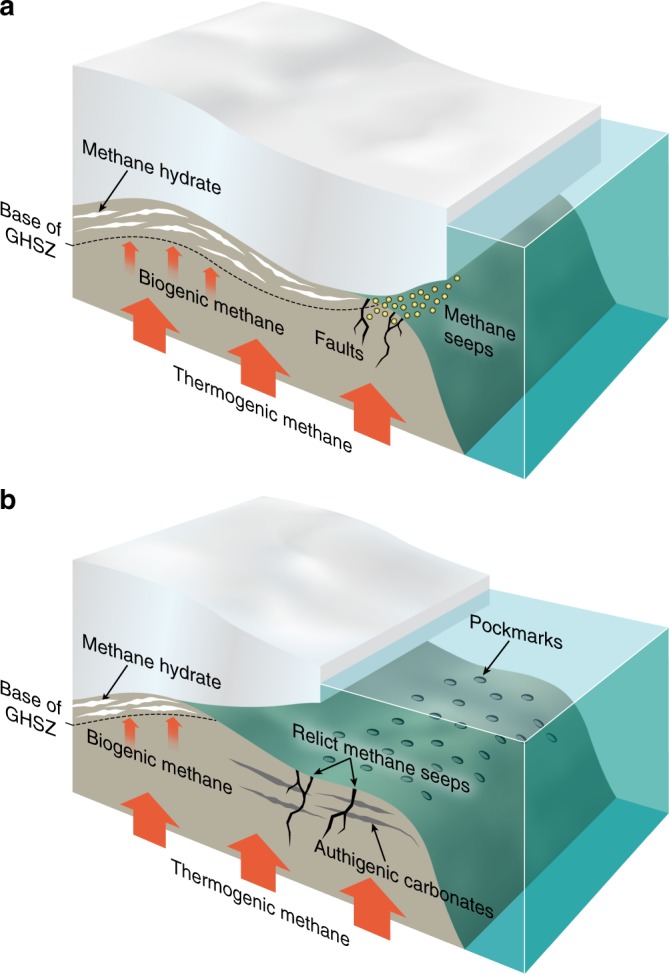
Model of ice sheet ice sheet impacts on hydrate reserves. A conceptual model illustrates the impact of ice sheet retreat and thinning on hydrate reserves beneath ice sheets, via their impact on the Gas Hydrate Stability Zone (GHSZ). (a) Conditions at peak glaciation, and (b) conditions after substantial ice sheet retreat. Following ice sheet retreat, relict features of hydrate destabilisation (e.g., authigenic carbonates, pock marks and relict cold seeps) may be evident on the formerly glaciated continental shelf
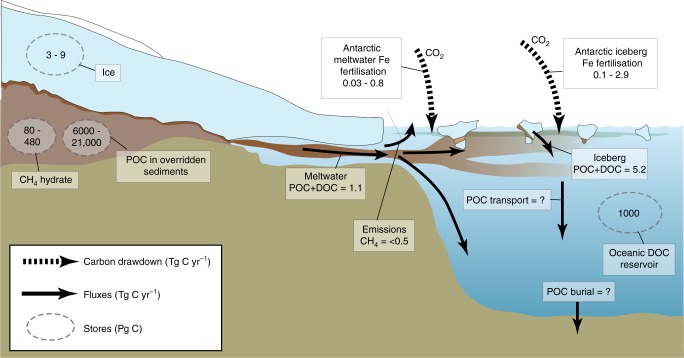
Stores and fluxes in present day ice sheets. A summary diagram indicating stores and fluxes of nutrients for present day ice sheets, and the predicted impact on CO2 (where data exists). The estimated size of carbon stores (Pg C) and Fluxes (Tg a−1)
References
-
- Zeng N. Glacial-interglacial atmospheric CO2 change—The glacial burial hypothesis. Adv. Atmos. Sci. 2003;20:677–693. doi: 10.1007/BF02915395. - DOI
-
- Stubbins Aron, Hood Eran, Raymond Peter A., Aiken George R., Sleighter Rachel L., Hernes Peter J., Butman David, Hatcher Patrick G., Striegl Robert G., Schuster Paul, Abdulla Hussain A. N., Vermilyea Andrew W., Scott Durelle T., Spencer Robert G. M. Anthropogenic aerosols as a source of ancient dissolved organic matter in glaciers. Nature Geoscience. 2012;5(3):198–201. doi: 10.1038/ngeo1403. - DOI
-
- Priscu, J. et al. Antarctic subglacial water:origin, evolution and ecology. In: Polar Lakes and Rivers (eds. Vincent, W. F., Laybourn-Parry, J.) (Oxford University Press, Oxford, United Kingdom 2009).
