. 2019 Aug 15;9(1):11878.
doi: 10.1038/s41598-019-48047-x.

Functional Transcriptome Analysis in ARSACS KO Cell Model Reveals a Role of Sacsin in Autophagy

Affiliations

Functional Transcriptome Analysis in ARSACS KO Cell Model Reveals a Role of Sacsin in Autophagy

Federica Morani et al. Sci Rep. .

Abstract

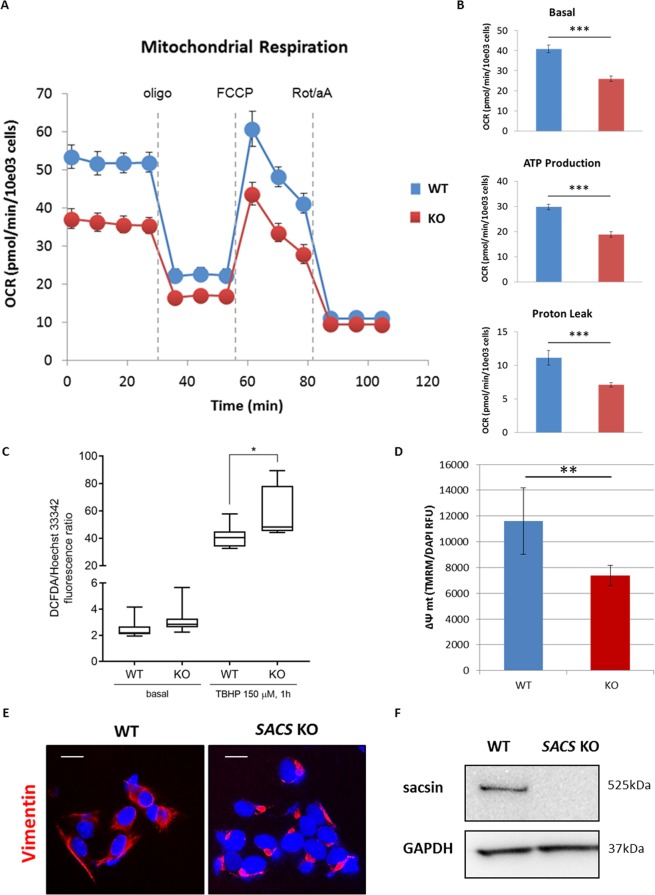
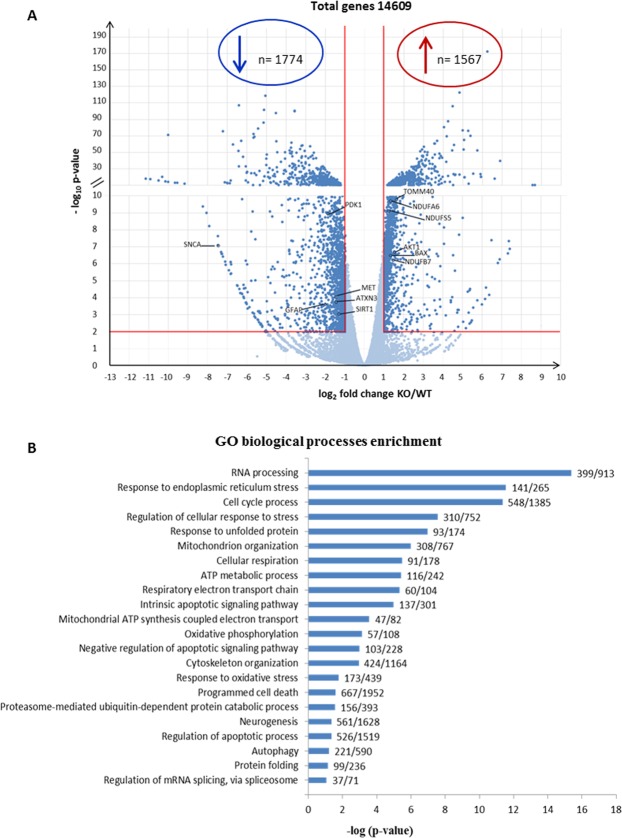
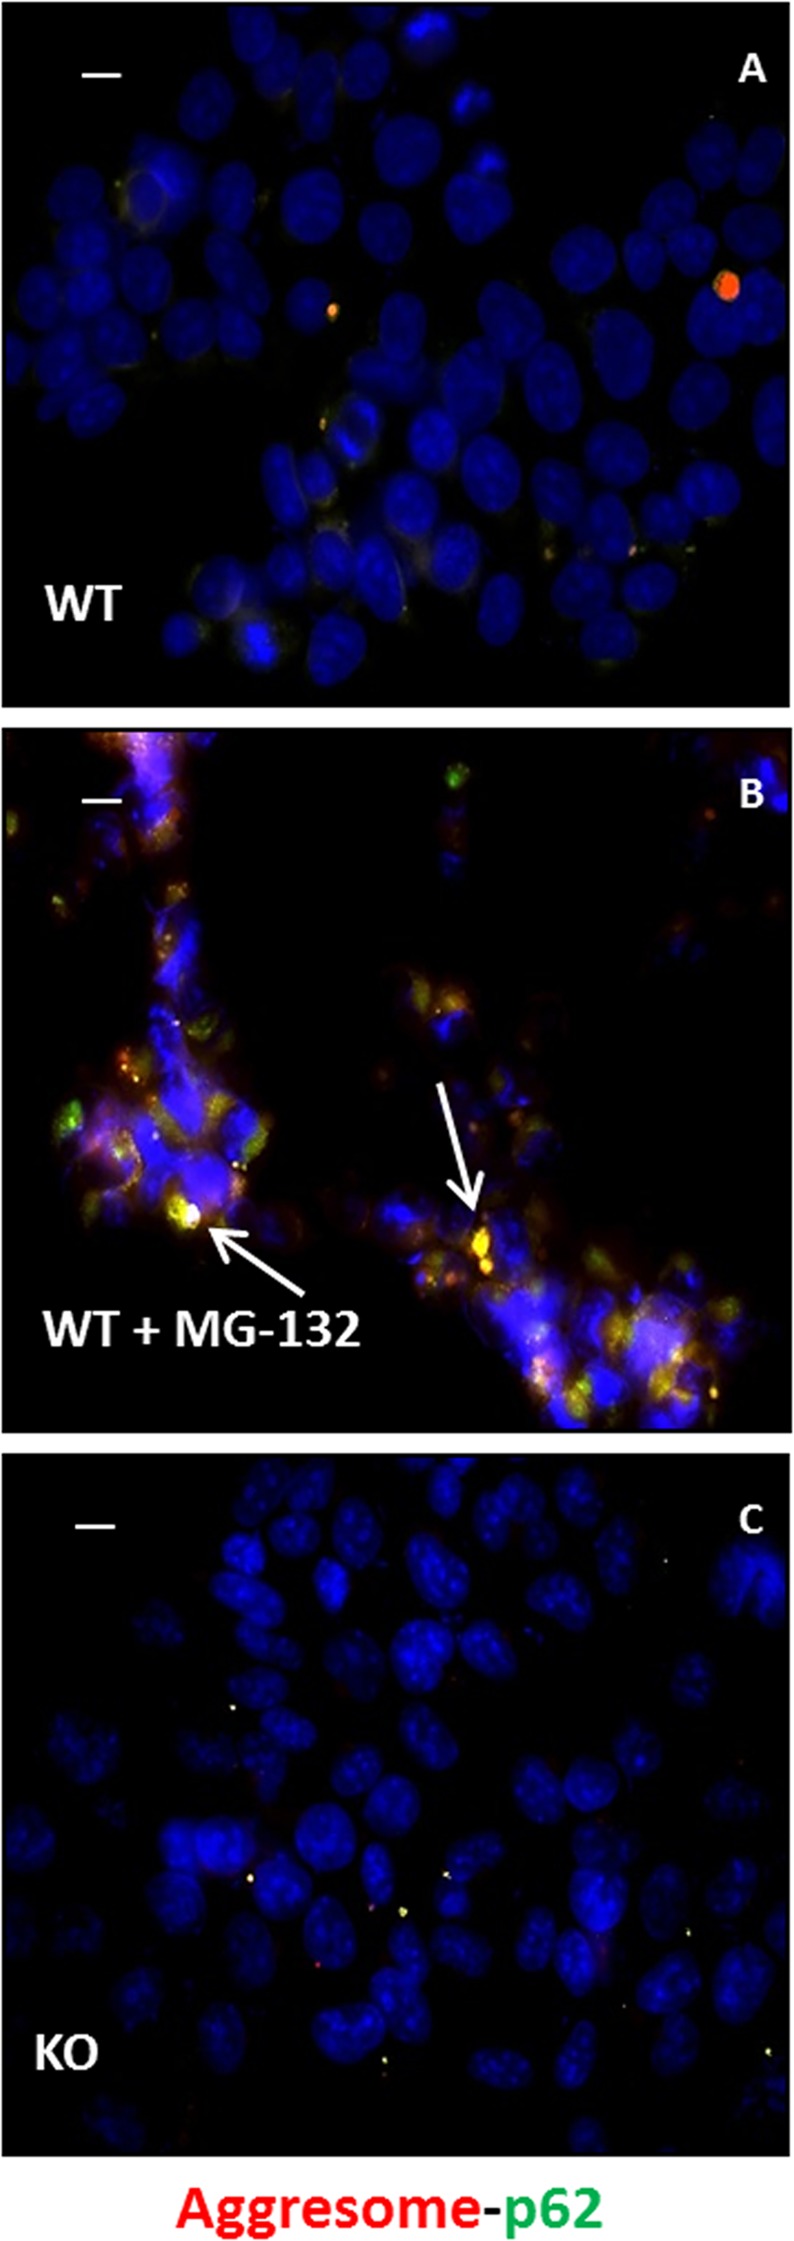
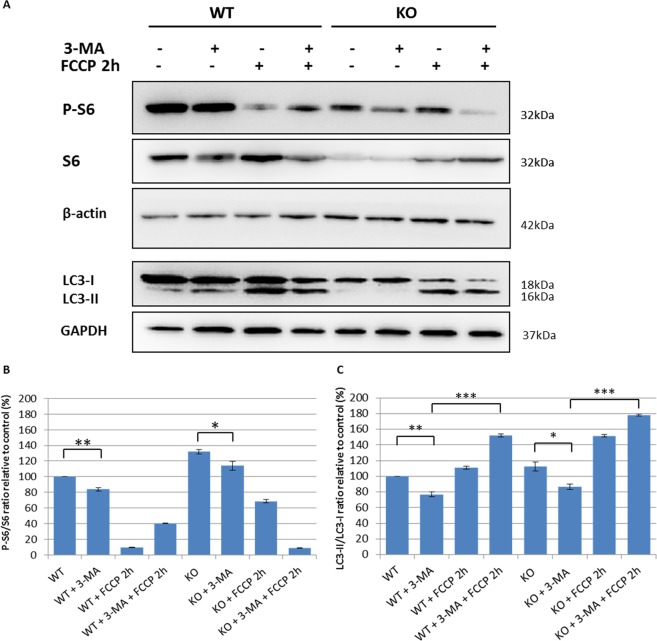
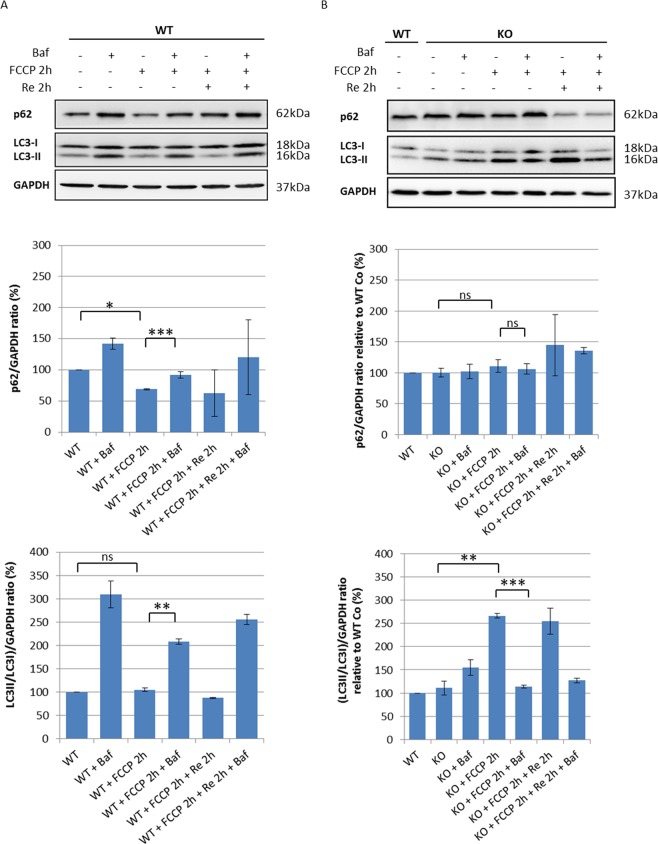
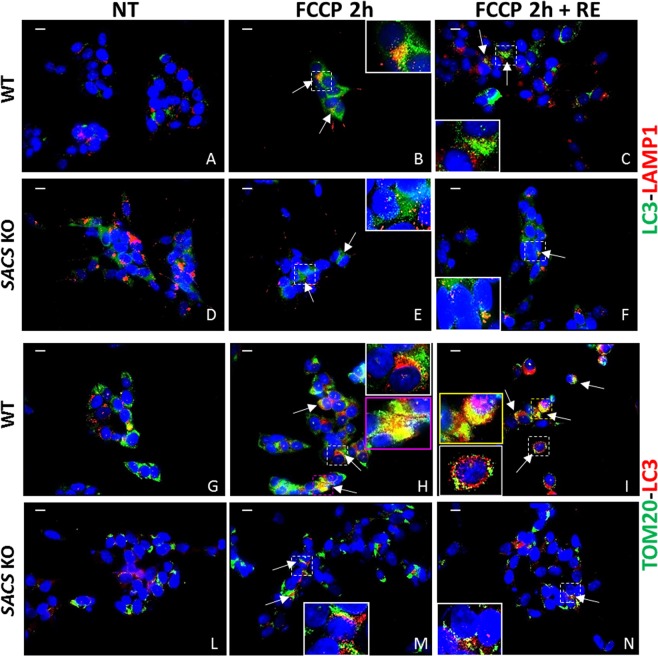
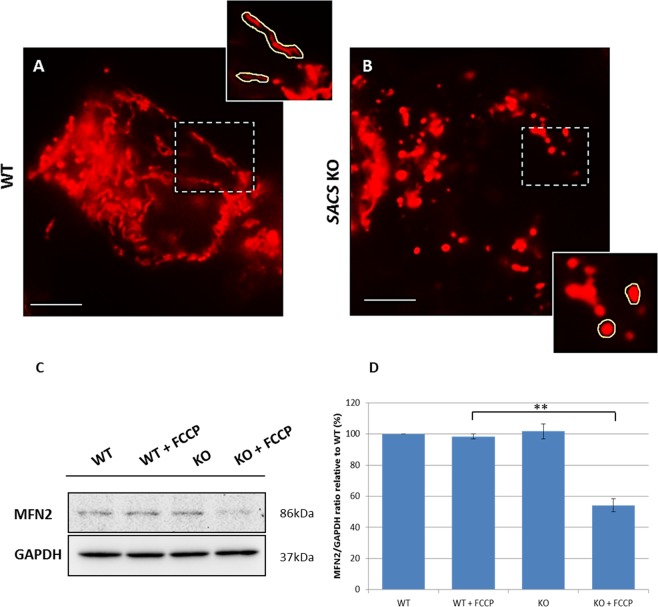
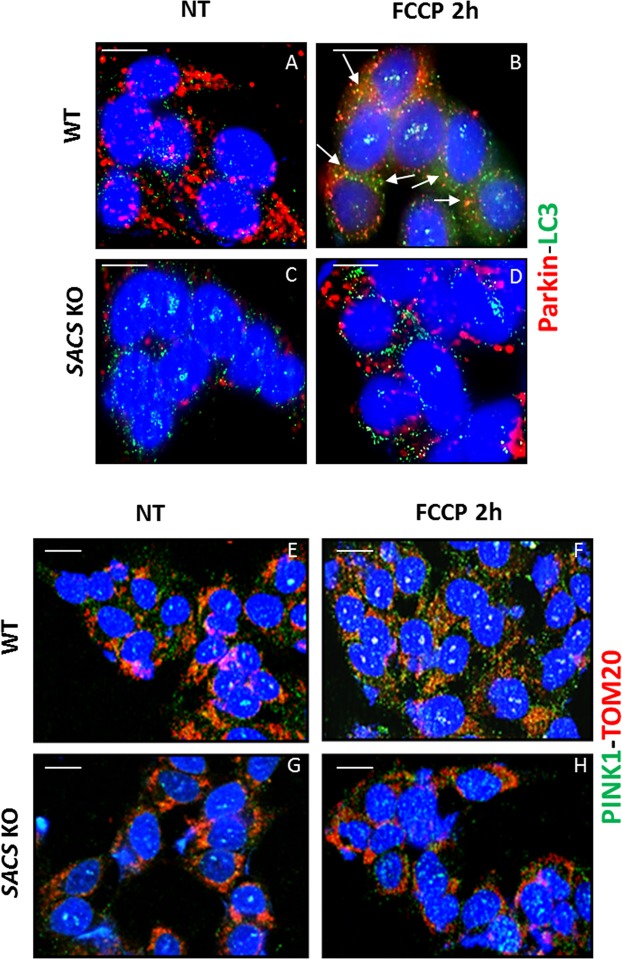
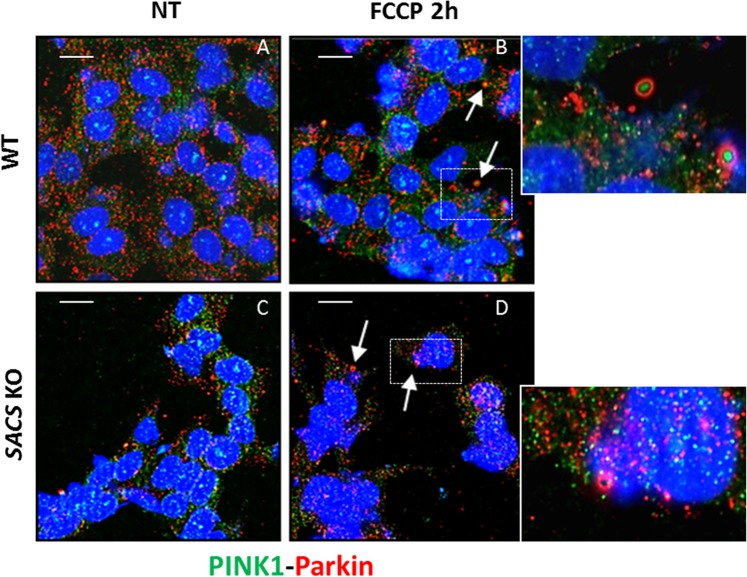
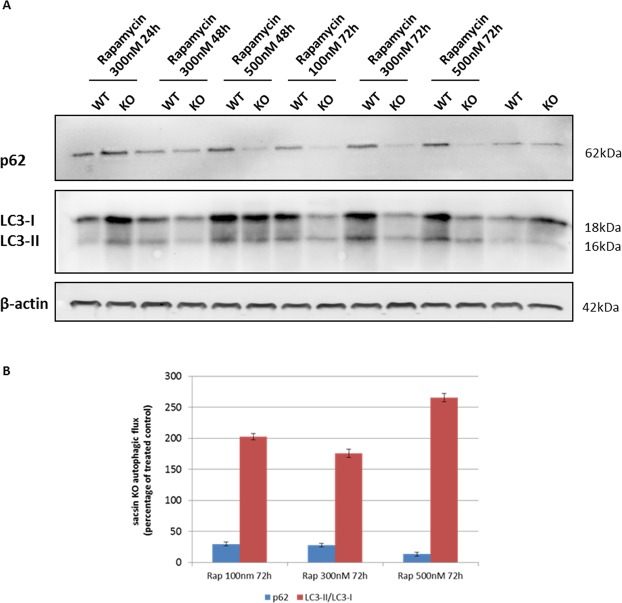
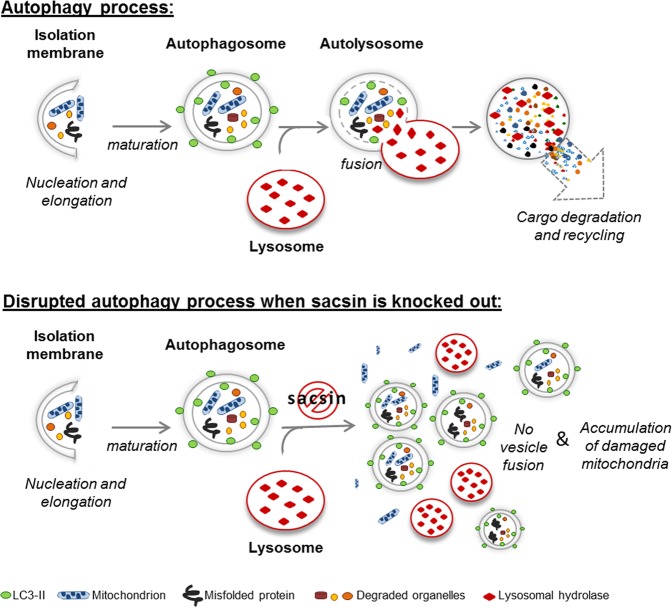
Autosomal recessive spastic ataxia of Charlevoix-Saguenay (ARSACS) is a rare early-onset neurological disease caused by mutations in SACS, which encodes sacsin. The complex architecture of sacsin suggests that it could be a key player in cellular protein quality control system. Molecular chaperones that operate in protein folding/unfolding and assembly/disassembly patterns have been described as essential modulators of selectivity during the autophagy process. We performed RNA-sequencing analysis to generate a whole-genome molecular signature profile of sacsin knockout cells. Using data analysis of biological processes significantly disrupted due to loss of sacsin, we confirmed the presence of decreased mitochondrial function associated with increased oxidative stress, and also provided a demonstration of a defective autophagic pathway in sacsin-depleted cells. Western blotting assays revealed decreased expression of LC3 and increased levels of p62 even after treatment with the lysosomal inhibitor bafilomycin A1, indicating impairment of the autophagic flux. Moreover, we found reduced co-immunolocalization of the autophagosome marker LC3 with lysosomal and mitochondrial markers suggesting fusion inhibition of autophagic compartments and subsequent failed cargo degradation, in particular failed degradation of damaged mitochondria. Pharmacological up-regulation of autophagy restored correct autophagic flux in sacsin knockout cells. These results corroborate the hypothesis that sacsin may play a role in autophagy. Chemical manipulation of this pathway might represent a new target to alleviate clinical and pathological symptoms, delaying the processes of neurodegeneration in ARSACS.


Conflict of interest statement

The authors declare no competing interests.

Figures

Figure 1
Figure 1
Mitochondrial bioenergetic function reduction, ROS levels increase, mitochondrial membrane potential impairment and abnormal intermediate filament network in sacsin KO cells. Measurement of OCR (A), basal respiration, ATP production and proton leak (B) in WT and KO cells using the Agilent Seahorse XF Cell Mito Stress Test. The assay was performed under basal conditions and after addition of olygomycin (2 µM), carbonyl cyanide 4-trifluoromethoxyphenylhydrazone (FCCP) (1.5 µM) and rotenone plus antimycin A (1 µM). Comparison between WT and sacsin KO cells showed impaired mitochondrial function (OCR = oxygen consumption rate; oligo = oligomycin; Rot = rotenone; aA = antimycin A). (C) Fluorimetric detection of intracellular ROS in WT and sacsin KO cells in basal condition (only addition of 2′,7′–dichlorofluorescin diacetate (DCFDA), 25 µM) and after tert-butyl hydroperoxide (TBHP) treatment (150 µM) using DCFDA assay kit showed a significant increase in intracellular ROS levels in KO cells after oxidative stress induction. Hoechst 33342 was used to normalize cell number. (D) Cells were loaded with the fluorescent cationic probe tetramethylrhodamine methyl ester (TMRM). TMRM, whose fluorescence intensity was measured using the Spectramax iD3 microplate reader, showed a significantly reduced Δψm in KO cells. Δψm was normalized by DAPI fluorescence, as a function of number of cells. (RFU = relative fluorescence units; Δψm = mitochondrial membrane potential). *p < 0.05; **p < 0.01; and ***p < 0.001. (E) Representative images of vimentin network (in red) in WT and sacsin KO cells showed a collapsed intermediate filament network in cells lacking sacsin. DAPI (in blue) was used as nuclear stain. Scale bar = 10 µm. (F) Western blotting showed undetectable sacsin levels in KO cell line. GAPDH was used as a loading control. Full-length blots are presented in the Supplementary Information 1.
Figure 2
Figure 2
Altered expression of genes identified through RNA-seq analyses comparing sacsin KO cells and WT control cells. (A) Volcano plot of transcriptome analyses of KO cells compared with WT cells. Names are indicated for some relevant genes. p value < 0.01. (B) Significantly enriched biological processes illustrated by transcriptomic data.
Figure 3
Figure 3
Aggresome staining in WT and sacsin KO cells. Representative images of p62 (in green) and aggresomes (in red) in WT and sacsin KO cells under normal conditions (A,C) or in WT cells after MG-132 treatment (B). Hoechst 33342 (in blue) was used as nuclear stain. Colocalization between aggresomes and p62 was absent in sacsin KO cells. Colocalization (in yellow) is indicated by arrows. Scale bar = 10 µm.
Figure 4
Figure 4
m-TOR dependent autophagy in WT and sacsin KO cell line. (A) Western blotting analysis of phospho-S6 (P-S6) and total S6 (S6) and LC3 autophagy markers in WT and sacsin KO cells treated for 2 h with the mitochondrial uncoupler carbonyl cyanide 4-trifluoromethoxyphenylhydrazone (FCCP 20 µM) in the absence or the presence of the PI3K inhibitor 3-methyladenine (3-MA; 10 mM). Full-length blots are presented in the Supplementary Information 2. The densitometry ratios of P-S6/S6 normalized versus β-actin (B) and of LC3-II/LC3-I normalized versus GAPDH (C) are reported, and they show m-TOR dependent regulation of autophagy in both cell lines. The data shown in this figure were reproduced independently three times. ns, not statistically significant; *p < 0.05; **p < 0.01; and ***p < 0.001.
Figure 5
Figure 5
The autophagic flux is impaired in sacsin KO cells. (A) Western blotting analysis of LC3 and p62 autophagy markers in WT cells treated for 2 h with the mitochondrial uncoupler FCCP (20 µM) in the absence or the presence of the lysosomal inhibitor bafilomycin A1 (200 nM). The densitometry ratios of LC3-II/LC3-I and of p62 normalized versus GAPDH are reported, and they show correct autophagic flux induction by carbonyl cyanide 4-trifluoromethoxyphenylhydrazone (FCCP) treatment. (B) Western blotting analysis showing LC3 and p62 levels in sacsin KO cells treated for 2 h with the uncoupler FCCP (20 µM) in the absence or the presence of bafilomycin A1 (200 nM). The densitometry ratios of LC3-II/LC3-I and p62 normalized vs GAPDH showed the failure of LC3-II to increase in the presence of bafilomycin, even after normal medium recovery, and p62 accumulation, these findings together indicate a defective autophagy process in KO cells.Data shown in this figure were reproduced independently three times. ns, not statistically significant; *p < 0.05; **p < 0.01; and ***p < 0.001. (Baf = bafilomycin A1; Re = normal medium recovery). Full-length blots are presented in the Supplementary Information 3.
Figure 6
Figure 6
Mitophagy is impaired in sacsin KO cells. (Panels A–F) Autophagosome-lysosome fusion is disrupted in sacsin KO cells. Immunofluorescence images of LC3 (in green) and LAMP1 (in red) in WT and sacsin KO cells under normal conditions (A,D), FCCP treatment (B,E) and FCCP treatment followed by medium recovery (C,F). DAPI (in blue) was used as nuclear stain. Fusion between autophagosomes and lysosomes was reduced in sacsin KO cells even after medium recovery. Colocalization of LC3 with LAMP1 (in yellow) is indicated by arrows. (Panels G–N) Mitophagy activation is reduced in KO cells. Immunofluorescence images of the mitochondrial marker TOM20 (in green) and LC3 (in red) in WT and sacsin KO cells under normal conditions (G,L) FCCP treatment (H,M) and FCCP treatment followed by medium recovery (I,N). DAPI (in blue) was used as nuclear stain. Fusion between mitochondria and autophagosomes was reduced in sacsin KO cells even after medium recovery. Colocalization of LC3 with TOM20 (in yellow) is indicated by arrows. Scale bar = 10 µm. (Re = normal medium recovery).
Figure 7
Figure 7
Mitochondrial pattern is disrupted in sacsin KO cells. (Panels A,B) Representative images showing WT and KO cells that were stained with MitoTracker (in red) under normal conditions. Mitochondria appeared more fragmented in KO cells as opposed to WT cells as highligthed by yellow border in the magnification inserts. Scale bar = 10 µm. (C) Western blotting of MFN2 in WT and KO cells in the presence or absence of the mitochondrial uncoupler FCCP (20 µM, 2 h). Full-length blots are presented in the Supplementary Information 4. (D) Densitometry of protein bands normalized versus GAPDH showed a significant reduced steady-state levels of MFN2 in KO cells after FCCP treatment. **p < 0.01.
Figure 8
Figure 8
Mitophagic flux is altered in sacsin KO cells. (AD) Immunofluorescence images of the mitophagy-related protein Parkin (red) and LC3 (green) in WT and KO cells under normal conditions (A,C) or upon FCCP treatment (B,D). There was no fusion between damaged mitochondria and autophagosomes in sacsin KO cells. Co-localization of Parkin with LC3 (yellow) is arrow indicated. (E–H) Co-staining of PINK1 (green) and TOM20 (in red) in WT and KO cells under normal conditions (E,G) or FCCP treatment (F,H) indicated a reduced localization of PINK1 on the outer mitochondrial membrane in KO cells after FCCP treatment. DAPI (in blue) was used as nuclear stain. Scale bar = 10 µm.
Figure 9
Figure 9
Mitophagic flux is damaged in sacsin KO cells. (A,B) Representative images of WT and KO cells immunolabeled for PINK1 (green) and Parkin (red) under normal conditions (A,C) or FCCP treatment (B,D) showed loss of co-localization of PINK1 with Parkin in KO cells compared to WT cells, indicating a defective mitophagic flux. Co-localization of PINK1 with Parkin (rounded structures) is arrow indicated (the insert shows an enlargement of these structures). DAPI (in blue) was used as nuclear stain. Scale bar = 10 µm.
Figure 10
Figure 10
Rapamacyin-induced autophagy restores correct autophagic flux in KO cells after 72 h of treatment. (A) Western blotting analysis of the autophagy markers LC3 and p62 in WT and KO cells treated with different concentrations of the autophagy inducer rapamycin for up to 72 h. Full-length blots are presented in the Supplementary Information 5. (B) Trend of KO vs WT cells in rapamycin treatment at 72 h showed effective autophagic flux rescue. Data shown in this figure were reproduced independently three times. ns, not statistically significant; *p < 0.05; **p < 0.01.
Figure 11
Figure 11
Scheme of autophagy processes in WT and sacsin KO cell models. Autophagy is active at a basal level serving for the turnover of long-lived proteins and also for the removal of superfluous or damaged organelles, such as mitochondria. The autophagy cascade consists of: formation of autophagosomes, their fusion with lysosomes to create autolysosomes and finally cytoplasmic cargo degradation by lysosomal hydrolases and recycling of macromolecules for the synthesis of essential components, to overcome various stress conditions. In our cell models, in which sacsin was knocked out, the fusion step did not take place. This resulted in accumulation of autophagosomes and damaged mitochondria in the cytoplasm.

References

    1. Yamamoto Y, et al. Novel compound heterozygous mutations in sacsin-related ataxia. J. Neurol. Sci. 2005;239:101–4. doi: 10.1016/j.jns.2005.08.005. - DOI - PubMed
    1. Takiyama Y. Autosomal recessive spastic ataxia of Charlevoix-Saguenay. Neuropathology. 2006;26:368–75. doi: 10.1111/j.1440-1789.2006.00664.x. - DOI - PubMed
    1. Vermeer S, et al. ARSACS in the Dutch population: a frequent cause of early-onset cerebellar ataxia. Neurogenetics. 2008;9:207–14. doi: 10.1007/s10048-008-0131-7. - DOI - PMC - PubMed
    1. Synofzik M, et al. Autosomal recessive spastic ataxia of Charlevoix Saguenay (ARSACS): expanding the genetic, clinical and imaging spectrum. Orphanet J. Rare Dis. 2013;8:41. doi: 10.1186/1750-1172-8-41. - DOI - PMC - PubMed
    1. Baets J, et al. Mutations in SACS cause atypical and late-onset forms of ARSACS. Neurology. 2010;75:1181–8. doi: 10.1212/WNL.0b013e3181f4d86c. - DOI - PubMed

Publication types

MeSH terms

Supplementary concepts