. 2019 Oct;121(7):556-566.
doi: 10.1038/s41416-019-0542-2. Epub 2019 Aug 16.

Acidity promotes tumour progression by altering macrophage phenotype in prostate cancer

Affiliations

Acidity promotes tumour progression by altering macrophage phenotype in prostate cancer

Asmaa El-Kenawi et al. Br J Cancer. 2019 Oct.

Erratum in

Abstract

Background: Tumours rapidly ferment glucose to lactic acid even in the presence of oxygen, and coupling high glycolysis with poor perfusion leads to extracellular acidification. We hypothesise that acidity, independent from lactate, can augment the pro-tumour phenotype of macrophages.

Methods: We analysed publicly available data of human prostate cancer for linear correlation between macrophage markers and glycolysis genes. We used zwitterionic buffers to adjust the pH in series of in vitro experiments. We then utilised subcutaneous and transgenic tumour models developed in C57BL/6 mice as well as computer simulations to correlate tumour progression with macrophage infiltration and to delineate role of acidity.

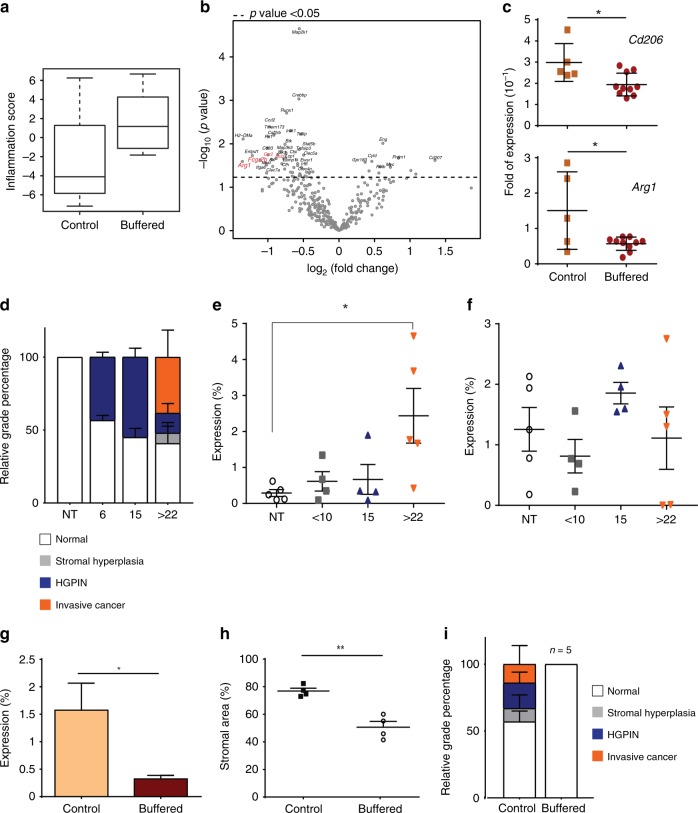
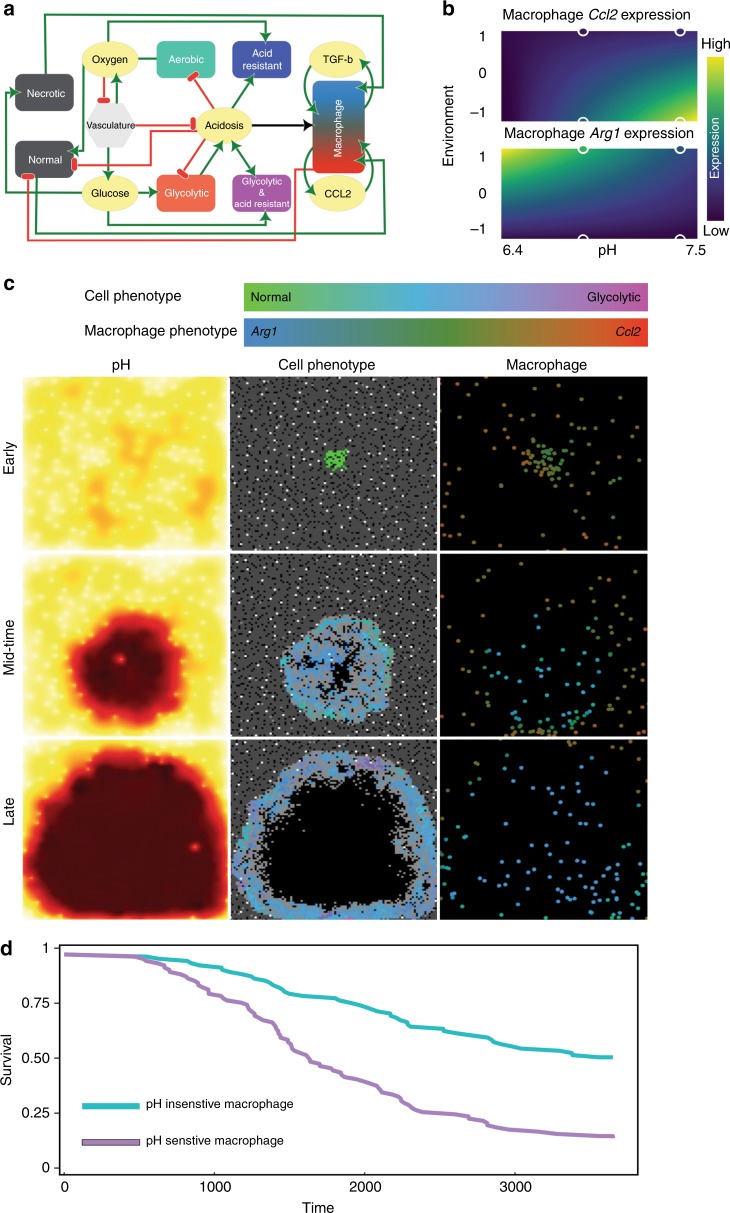
Results: Activating macrophages at pH 6.8 in vitro enhanced an IL-4-driven phenotype as measured by gene expression, cytokine profiling, and functional assays. These results were recapitulated in vivo wherein neutralising intratumoural acidity reduced the pro-tumour phenotype of macrophages, while also decreasing tumour incidence and invasion in the TRAMP model of prostate cancer. These results were recapitulated using an in silico mathematical model that simulate macrophage responses to environmental signals. By turning off acid-induced cellular responses, our in silico mathematical modelling shows that acid-resistant macrophages can limit tumour progression.

Conclusions: This study suggests that tumour acidity contributes to prostate carcinogenesis by altering the state of macrophage activation.


Conflict of interest statement

R. Gillies has a sponsored research support from Helix Biopharma. The other authors declare no competing interests.

Figures

Fig. 1
Fig. 1
Macrophage infiltration correlates with MCT4 expression. Correlation between CSF1R/CD206 and MCT4 mRNA expression in early-stage patients (Gleason score = 3+3) and advanced prostate (Gleason score = 3+4, 4+3 and ≥8) retrieved from TCGA PRAD333: R = 0.719 and 0.643, respectively
Fig. 2
Fig. 2
Extracellular acidosis alters macrophage activation in vitro. a mRNA expression of Nos2, Ccl2 and Il-6. b mRNA expression of Cd206, Arg1 and Reltna in bone marrow-derived macrophage stimulated for 24 h with lipopolysaccharide (LPS)/interferon (IFN)-γ (M1) or interleukin (IL)-4 (M2) or left untreated (M0) at either pH 7.4 or 6.8. Data are presented as mean ± SEM. Two-way analysis of variance was utilised for statistical analysis; *p < 0.05, **p < 0.01, ****p < 0.0001. c Expression of inducible nitric oxide synthase (iNOS) in LPS/IFN-γ activated macrophages at pH 7.4 or 6.8 using flow cytometry. d Western blot analysis of iNOS in LPS/IFN-γ activated macrophages at pH 7.4 and 6.8. α-Tubulin was used as a loading control. e Nitrite level in the supernatant of LPS/IFN-γ activated macrophages at pH 7.4 and 6.8, as measured by Griess reagent. Data are presented as mean ± SEM. Student’s t test was utilised for statistical analysis; ****p < 0.0001. f Confocal immunofluorescent analysis of CD206 expression in IL-4 activated macrophages at pH 7.4 or 6.8. CD206 (green), Phalloidin (red) and Dapi (blue). g Western blot analysis of CD206 expression in macrophages stimulated for 24 h with IL-4 (M2) at pH 7.4 and 6.8. α-tubulin was used as loading control. h Heatmap of the top differentially expressed genes (determined by p value and ranked by fold change) in LPS/IFN-γ activated macrophages at pH 7.4 or 6.8. nCounter PanCancer Immune Profiling that measures the expression of 770 genes was used to assess difference in gene expression (n = 2)
Fig. 3
Fig. 3
Extracellular acidosis enhances a tumour-promoting macrophage phenotype. a Relative mRNA level of Arg1 in macrophages treated with 30% TRAMP-C2, TRAMP-C3 conditioned medium at either pH 7.4 or 6.8 or left untreated as control (M0). Data are presented as mean ± SEM. Two-way analysis of variance was utilised for statistical analysis; *p < 0.05, ****p < 0.0001. b Relative mRNA level of Cd206 in macrophages directly co-cultured with TRAMP-C2 for 4 days at pH 7.4 or 6.8, then sorted and processed for RNA extraction. Data are presented as mean ± SEM. Student’s t test was utilised for statistical analysis; **p < 0.01. c Flow cytometric analysis of CD206 expression in macrophages incubated at pH 7.4 or 6.8 for 24 h, then either cultured alone or with TRAMP-C2 at pH 7.4 for another 24 h. F4/80 staining was used to gate out tumour cells. d Flow cytometric quantification of fluorescently labelled ovalbumin uptake in lipopolysaccharide (LPS)/interferon (IFN)-γ activated macrophages at either pH 7.4 or 6.8 for 24 h. Graph represents relative increase in fluorescently labelled ovalbumin uptake (n = 5). Data are presented as mean ± SEM. Student’s t test was utilised for statistical analysis; ****p < 0.0001. e Conditioned media from macrophage–tumour co-culture at pH 7.4 or 6.8 were processed for cytokine determination using the mouse XL cytokine array. Densitometric analysis was then done using the Image J software and pixel density was graphed as heatmap (n = 2). f TRAMP-C2 cells were co-cultured with or without macrophages in neutral or acidic medium for 24 h. Cells were then labelled with 5-ethynyl-2′-deoxyuridine (EdU) for 2 h, collected and processed for flow cytometric analysis. SSC vs. EdU fluorescence of TRAMP-C2 tumour cells in each culture condition was plotted. Fold change was calculated by dividing the EdU-incorporating cell count with macrophages by the corresponding values of tumour cells alone (n = 6). g Macrophages were activated with LPS/IFN-γ (M1) at pH 7.4 or 6.8 for 24 h or left unstimulated as M0. Differentially activated macrophages were then co-cultured with TRAMP-C3 cells and lactate dehydrogenase in the supernatants was measured 24 h later to estimate cytotoxicity. Data are presented as mean ± SEM. Two-way analysis of variance was utilised for statistical analysis; **p < 0.01
Fig. 4
Fig. 4
Buffering tumour-secreted acids alters tumour associated macrophage (TAM) phenotype in vivo and reduces tumour progression. a Inflammation score and b Volcano plot generated by the nSolver software 3.0 using gene expression data from nCounter PanCancer Immune profiling of CD11b+F4/80+ TAMs sorted from control or sodium bicarbonate-treated (buffered) TRAMP-C2-bearing mice (n = 4–5). c Fold expression of Cd206 and Arg1 in CD11b+F4/80+ TAMs sorted from independent cohort of control or sodium bicarbonate-treated (buffered) TRAMP-C2-bearing mice (n = 5–10). d Histopathological analysis of haematoxylin & eosin (H&E) samples from 6-, 15-, 22-, 23- and 25-week-old TRAMP mice. e, f Quantification of F4/80 (macrophage) and α-smooth muscle actin (fibroblast) staining in serial sections of paraffin-embedded prostates, isolated from 6-, 15-, 22-, 23- and 25-week-old TRAMP mice. g TRAMP mice were treated with sodium bicarbonate buffer starting from 4 weeks of age (buffered) or kept on tap water as control. F4/80-stained sections were digitally quantified and the percentage of F4/80 staining intensity in stroma of prostate tissue were plotted (n > 4). h Mean area of segmented stromal compartment (n = 4). i Histopathological analysis of H&E slides of buffered and control TRAMP mice. Data are presented as mean ± SEM. Student’s t test was utilised for statistical analysis; *p < 0.05, **p < 0.01
Fig. 5
Fig. 5
Acid-responsive macrophages promote tumour growth in silico. a Interaction network for agent-based model illustrating how macrophages and cells interact with, and are affected by, the microenvironment, which is composed of glucose, oxygen, acid, necrotic cells and pro- and anti-inflammatory cytokines. Green lines reflect promotion, while red lines indicate inhibitory interactions. b Output of linear model fitting of Arg1 and Ccl2 expression represented as heatmap. For each phenotypic trait, a linear model allows to predict expression under a variety of conditions. Here, −1 is a tumour-rich inflammatory environment, while 1 is environment with necrosis and anti-inflammatory cytokines. The circles outlined in white are the actual in vitro data. c Snapshots from agent-based model. In the pH window, low pH is dark red, while high pH is yellow. In the cell window, grey pixels are normal cells, white are vessels, and tumour cells are coloured by their phenotype. In the macrophage window, each macrophage is coloured by the mix of CCL2 and ARG1 expressed. Top panel is early in the simulation, bottom panel is when the tumour has taken >90% of the domain and the simulation is stopped. d Simulated survival curves generated after running the simulation under two scenarios, one hundred times each. The “pH Insensitive Macrophage” scenario is where macrophages are not affected by pH, while macrophage behaviour is affected by acid in the “pH Sensitive Macrophage” scenario. Here survival time is the amount of time it took the tumour to take >90% of the domain, given a maximum amount of time of 10 years. Mantel–Haenszel test reveals that these survival curves are significantly different, with p < 0.05

Comment in

References

    1. Ittmann M, Huang J, Radaelli E, Martin P, Signoretti S, Sullivan R, et al. Animal models of human prostate cancer: the consensus report of the New York meeting of the Mouse Models of Human Cancers Consortium Prostate Pathology Committee. Cancer Res. 2013;73:2718–2736. - PMC - PubMed
    1. Gatenby RA, Gillies RJ. Why do cancers have high aerobic glycolysis? Nat. Rev. Cancer. 2004;4:891–899. - PubMed
    1. Schornack PA, Gillies RJ. Contributions of cell metabolism and H+ diffusion to the acidic pH of tumors. Neoplasia. 2003;5:135–145. - PMC - PubMed
    1. Silva AS, Yunes JA, Gillies RJ, Gatenby RA. The potential role of systemic buffers in reducing intratumoral extracellular pH and acid-mediated invasion. Cancer Res. 2009;69:2677–2684. - PMC - PubMed
    1. Estrella V, Chen T, Lloyd M, Wojtkowiak J, Cornnell HH, Ibrahim-Hashim A, et al. Acidity generated by the tumor microenvironment drives local invasion. Cancer Res. 2013;73:1524–1535. - PMC - PubMed

Publication types

MeSH terms