. 2019 Jun 21:12:1749-1761.
doi: 10.2147/IDR.S200213. eCollection 2019.

Evaluation of gut bacterial community composition and antimicrobial resistome in pregnant and non-pregnant women from Saudi population

Affiliations

Evaluation of gut bacterial community composition and antimicrobial resistome in pregnant and non-pregnant women from Saudi population

Imran Khan et al. Infect Drug Resist. .

Abstract

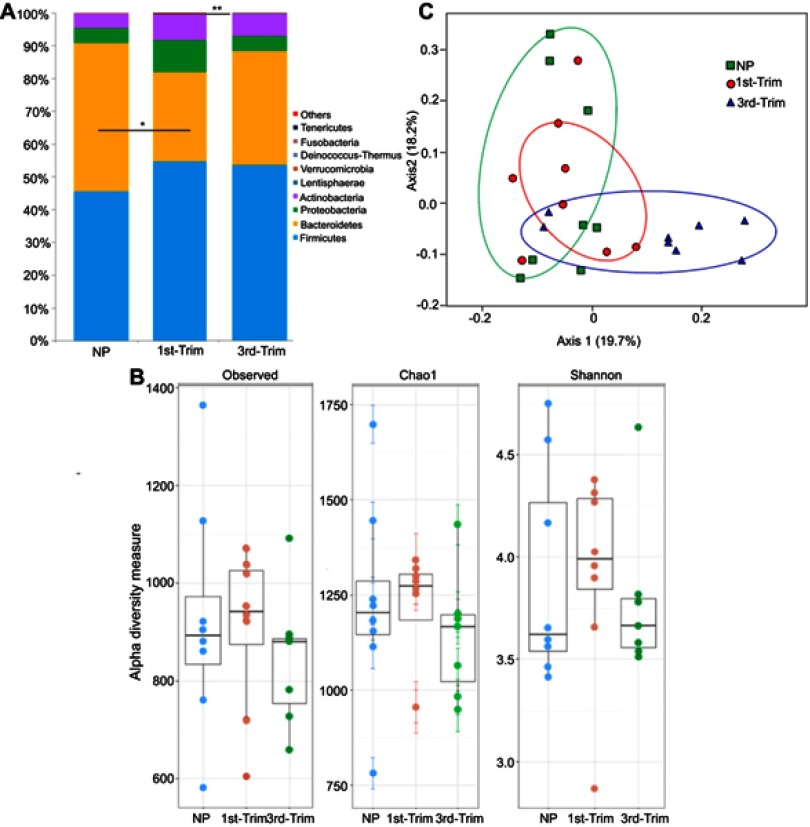
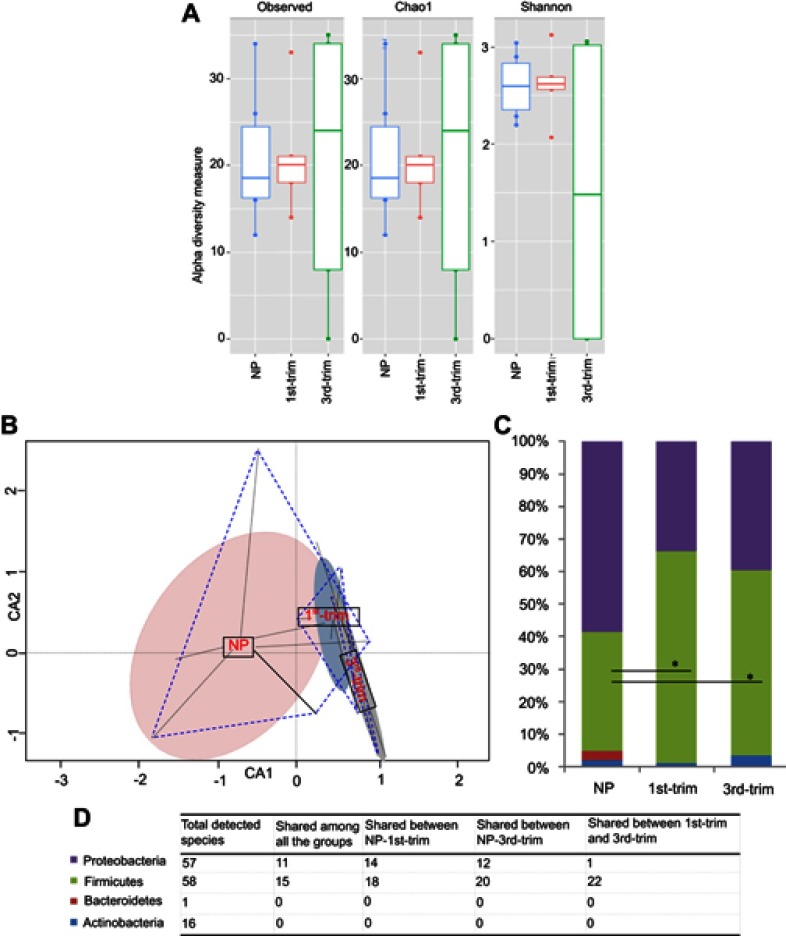
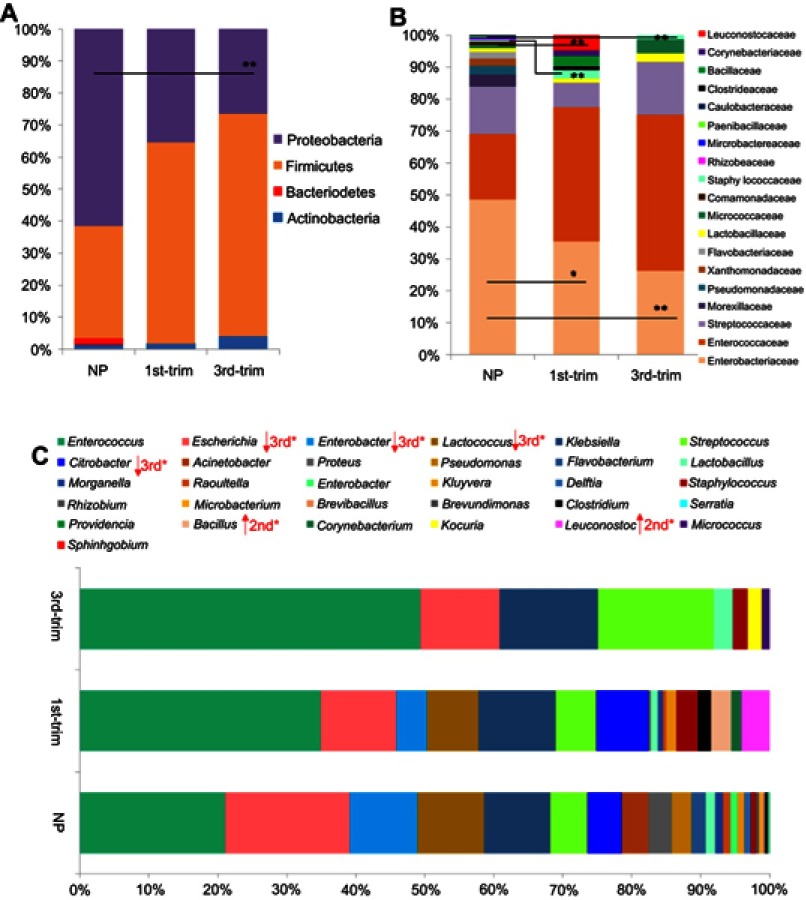
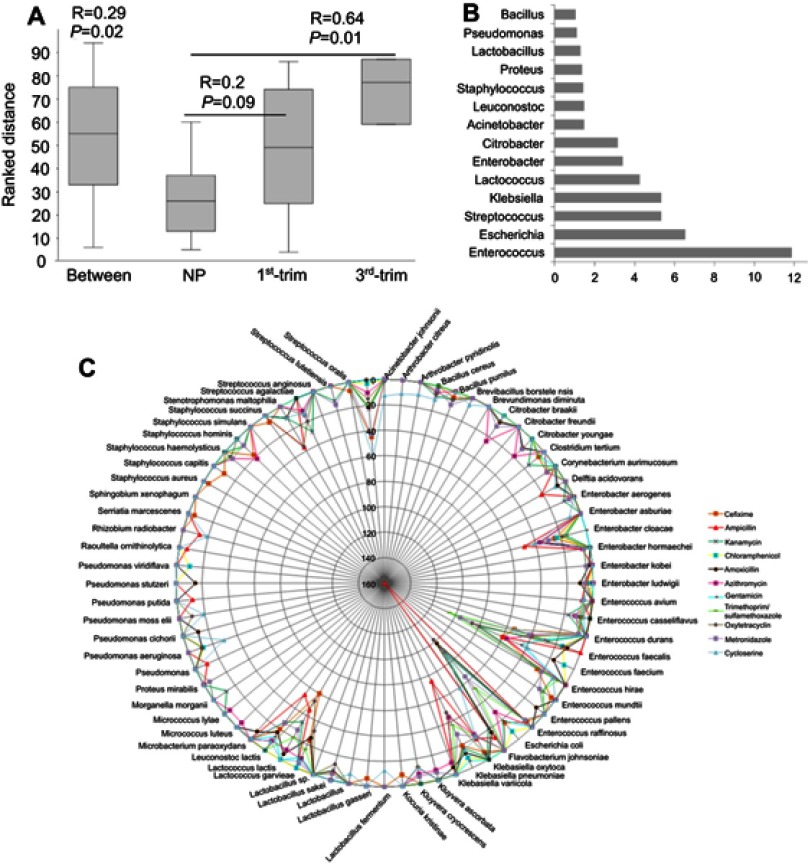
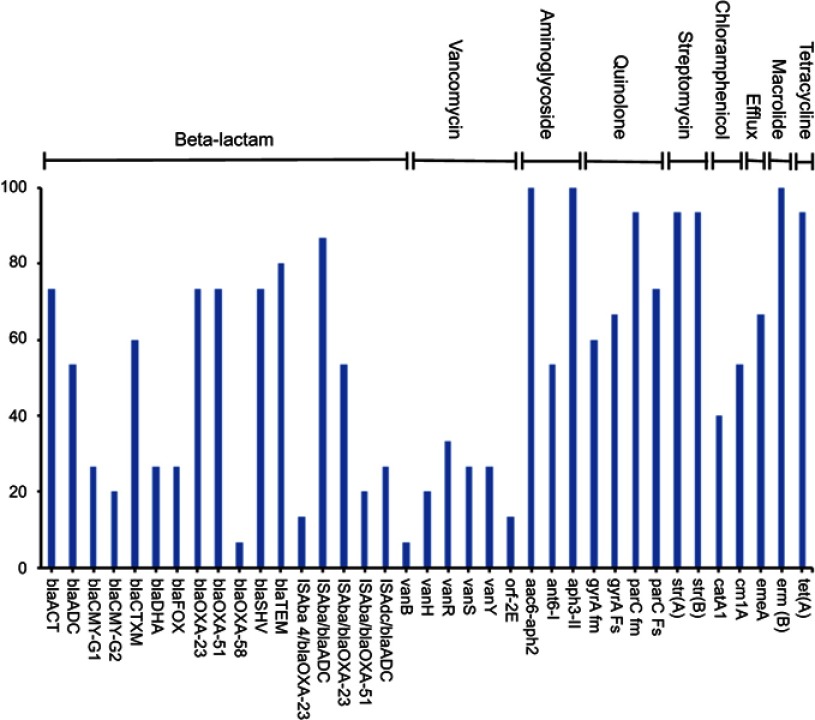
Background: Gut microbiota (GM) has recently been described as a functional reservoir of antimicrobial resistant genes (ARGs). However, the ARG-carrying bacterial species in the human gut has been poorly studied. This study, for the first time, is reporting bacterial communities' composition and antimicrobial resistome in the stool samples of pregnant and non-pregnant (NP) Saudi females. Methods: Gut bacterial community composition was analyzed by 16S amplicon sequencing and culturomics. High throughput MALDI-TOF technique was used for identification of the isolates from stool samples and evaluated for resistance against 13 antibiotics using the agar dilution method. Clinically important ARGs were PCR amplified from genomic DNA of the stool samples using gene-specific primers. Results: 16S amplicon sequencing revealed that GM of pregnant and NP women were predominantly comprised of phyla Firmicutes, Bacteroidetes, Proteobacteria, and Actinobacteria. Bacterial diversity decreased in pregnant groups, whereas phylum Bacteroidetes declined significantly (p<0.05) in the first trimester. We noticed a relatively high abundance of butyrate-producing bacteria (eg, Faecalibacterium spp. and Eubacterium spp.) in the gut of pregnant women, whereas Prevotella copri was found at significantly (p<0.01) higher abundance in NP women. Moreover, about 14,694 isolates were identified and classified into 132 distinct species. The majority of the species belonged to phyla Firmicutes and Proteobacteria. About 8,125 isolates exhibited resistance against antibiotics. Out of 73 resistant-species, Enterococcus was the most diverse genus and Escherichia coli was the highly prevalent bacterium. The majority of the isolates were resistant to antibiotics; trimethoprim/sulfamethoxazole, cycloserine, and cefixime. ARGs encoding resistance against aminoglycoside, macrolide, quinolone, β-lactam, and tetracycline antibiotics were predominantly found in genomic DNA of the stool samples. Conclusion: We conclude that pregnancy-associated GM modulations may help to sustain a healthy pregnancy, but a higher proportion of antibiotic resistance could be deleterious for both maternal and fetal health.

Keywords: Saudi Arabia; antimicrobial resistance; culturomics; gut microbiota; metagenomics; pregnancy.


Conflict of interest statement

The authors report no conflicts of interest in this work.

Figures

Figure 1
Figure 1
(A) Graphical presentation of average relative densities of detected phyla in percentage. The x-axis shows group name and y-axis indicates average abundance in percentage. Others indicate minor phyla. *Significant at p<0.05. **Highly significant at p≤0.01. (B) Alpha diversity analysis of 16S amplicon data. The first trimester group (1st-Trim) exhibited greater diversity and richness (shown by observed and Chao1 indices), and higher Shannon index compared to third trimester (3rd-Trim) and non-pregnant (NP) groups. (C) Weighted UniFrac analysis of 100 most abundant operational taxonomic units. The variation percentage explained by the correspondence coordinates is indicated on the axes. Dots represent sample relative positions and respective group samples are interlinked. Groups are respectively colored. Abbreviations: NP, non-pregnant group; 1st-Trim, first trimester; 3rd-Trim, third trimester.
Figure 2
Figure 2
Diversity, structural, and compositional changes observed according to trimester using a culturomic approach. (A) Alpha diversity analysis of culturomic data. (B) Constrained ordination analysis. Species' occurrence and abundance differed among the groups. The non-pregnant (NP) group had comparatively more diverse and abundant species. Projecting lines from each group correspond to samples. (C) Average relative percentage abundance of phyla. Annotation of phyla is same as shown in the D-section of the plot. Count data were first transformed with the Hellinger transformation method. After normality test, statistical significance was performed with ANOVA, and Bonferroni correction was applied. *Significant at p<0.05. (D) Tabular presentation of total species' identified in each phyla and study group. Abbreviations: NP, non-pregnant group; 1st-Trim, first trimester; 3rd-Trim, third trimester.
Figure 3
Figure 3
Comparisons of the relative abundance of antibiotic-resistant taxa. (A) A comparison of the relative abundance of antibiotic-resistant phyla. (B) A comparison of the relative abundance of antibiotic-resistant families. (C) A comparison of the relative abundance of antibiotic-resistant genera. Data are shown as percentile abundances in each group. Before statistical analysis, count data were transformed with the Hellinger method and analyzed for normality. Taxa with normal distribution were analyzed using ANOVA with Dunnett's post hoc test, while non-normal data were analyzed with Kruskal–Wallis and p-values were corrected. Abbreviations: NP, non-pregnant group; 1st-Trim, first trimester; 3rd-Trim, third trimester.
Figure 4
Figure 4
Similarity analysis among the groups on the basis of antibiotic-resistant genera and list of total resistant bacteria. (A) ANOSIM was performed using Euclidean similarity with permutation N=9999. Pairwise p-values were corrected with sequential Bonferroni tests. (B) SIMPER test was performed to determine major bacteria that differentiate the antibiotic-resistance profiles of the studied groups. (C) Network presentation of total resistant species with abundance for resistance to antimicrobials. The circular lines are scaled to show the corresponding abundance of each species. The color of the lines represents different antimicrobials. Abbreviations: ANOSIM, Analysis of similarities; NP, non-pregnant group; 1st-Trim, first trimester; 3rd-Trim, third trimester.
Figure 5
Figure 5
Percentage abundance of the antimicrobial resistance genes amplified from the stool samples.

References

    1. Gohir W, Whelan FJ, Surette MG, Moore C, Schertzer JD, Sloboda DM. Pregnancy-related changes in the maternal gut microbiota are dependent upon the mother’s periconceptional diet. Gut Microbes. 2015;6(5):310–320. doi:10.1080/19490976.2015.1086056 - DOI - PMC - PubMed
    1. Koren O, Goodrich JK, Cullender TC, et al. Host remodeling of the gut microbiome and metabolic changes during pregnancy. Cell. 2012;150(3):470–480. doi:10.1016/j.cell.2012.07.008 - DOI - PMC - PubMed
    1. Carding S, Verbeke K, Vipond DT, Bm C, Lj O. Dysbiosis of the gut microbiota in disease. Microb Ecol Health Dis. 2015;26:26191. - PMC - PubMed
    1. Dethlefsen L, Relman DA. Incomplete recovery and individualized responses of the human distal gut microbiota to repeated antibiotic perturbation. Proc Natl Acad Sci U S A. 2011;108 Suppl 1:4554–4561. doi:10.1073/pnas.1000087107 - DOI - PMC - PubMed
    1. Pedersen HK, Gudmundsdottir V, Nielsen HB, et al. Human gut microbes impact host serum metabolome and insulin sensitivity. Nature. 2016;535(7612):376–381. doi:10.1038/nature18646 - DOI - PubMed