. 2019 Jul 30:6:99.
doi: 10.3389/fcvm.2019.00099. eCollection 2019.

Comparative Analysis of Microfluidics Thrombus Formation in Multiple Genetically Modified Mice: Link to Thrombosis and Hemostasis

Affiliations

Comparative Analysis of Microfluidics Thrombus Formation in Multiple Genetically Modified Mice: Link to Thrombosis and Hemostasis

Magdolna Nagy et al. Front Cardiovasc Med. .

Abstract

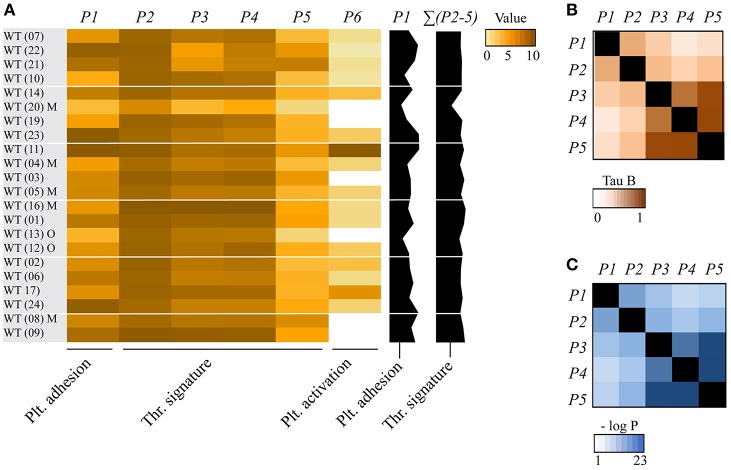
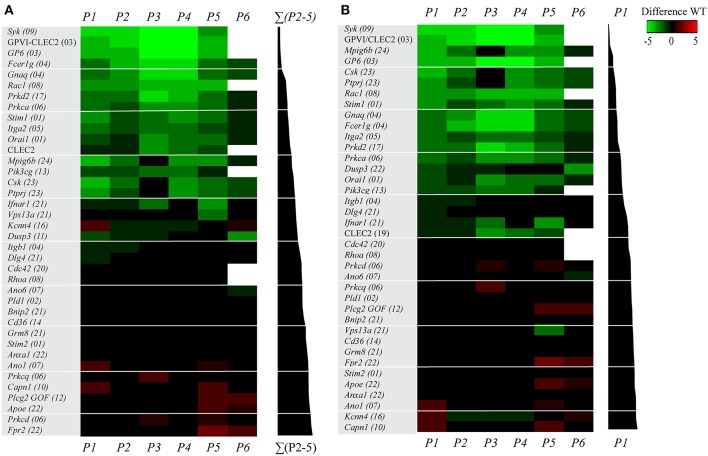
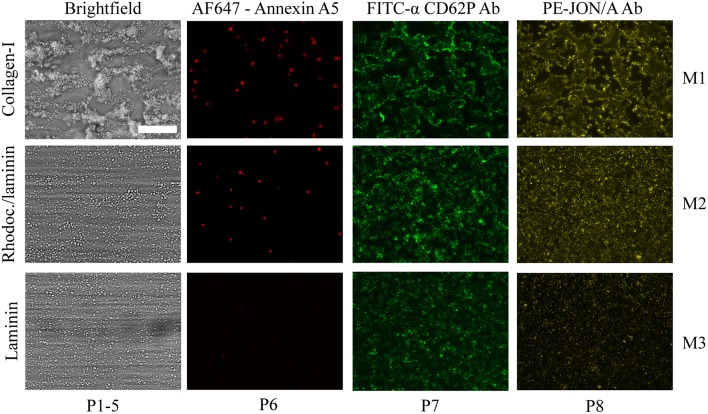
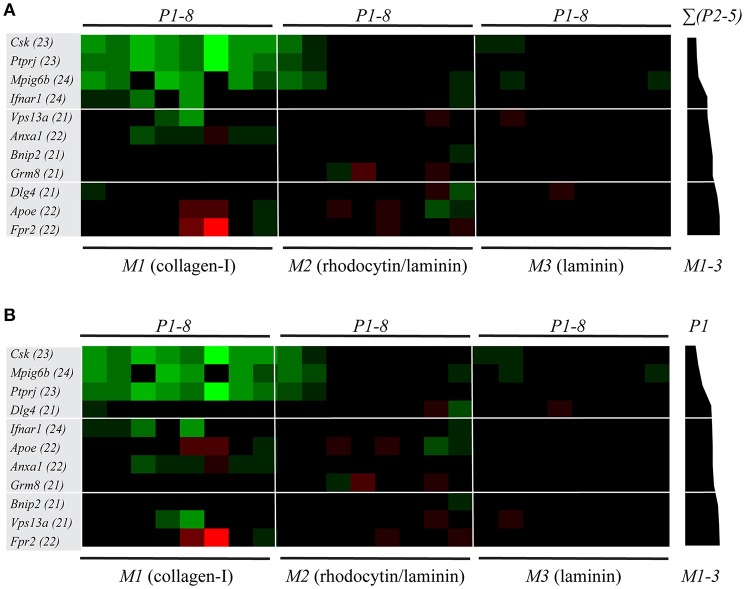
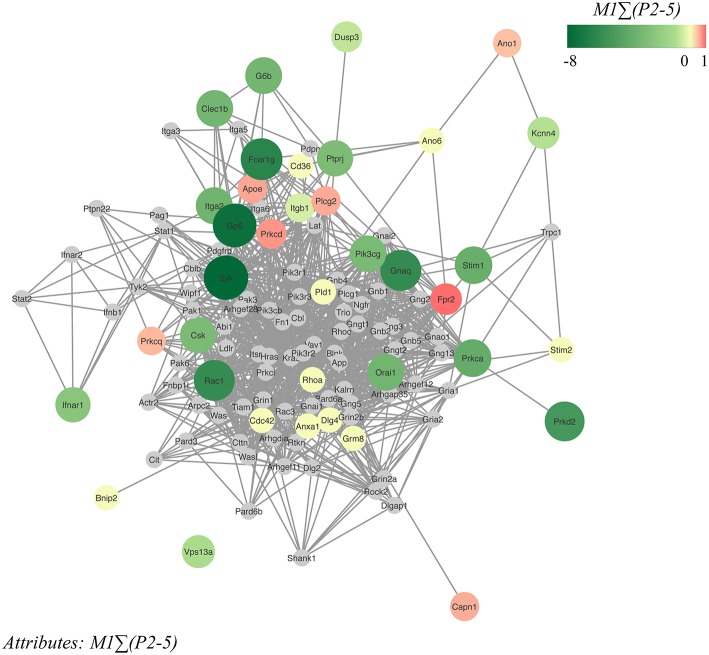
Genetically modified mice are indispensable for establishing the roles of platelets in arterial thrombosis and hemostasis. Microfluidics assays using anticoagulated whole blood are commonly used as integrative proxy tests for platelet function in mice. In the present study, we quantified the changes in collagen-dependent thrombus formation for 38 different strains of (genetically) modified mice, all measured with the same microfluidics chamber. The mice included were deficient in platelet receptors, protein kinases or phosphatases, small GTPases or other signaling or scaffold proteins. By standardized re-analysis of high-resolution microscopic images, detailed information was obtained on altered platelet adhesion, aggregation and/or activation. For a subset of 11 mouse strains, these platelet functions were further evaluated in rhodocytin- and laminin-dependent thrombus formation, thus allowing a comparison of glycoprotein VI (GPVI), C-type lectin-like receptor 2 (CLEC2) and integrin α6β1 pathways. High homogeneity was found between wild-type mice datasets concerning adhesion and aggregation parameters. Quantitative comparison for the 38 modified mouse strains resulted in a matrix visualizing the impact of the respective (genetic) deficiency on thrombus formation with detailed insight into the type and extent of altered thrombus signatures. Network analysis revealed strong clusters of genes involved in GPVI signaling and Ca2+ homeostasis. The majority of mice demonstrating an antithrombotic phenotype in vivo displayed with a larger or smaller reduction in multi-parameter analysis of collagen-dependent thrombus formation in vitro. Remarkably, in only approximately half of the mouse strains that displayed reduced arterial thrombosis in vivo, this was accompanied by impaired hemostasis. This was also reflected by comparing in vitro thrombus formation (by microfluidics) with alterations in in vivo bleeding time. In conclusion, the presently developed multi-parameter analysis of thrombus formation using microfluidics can be used to: (i) determine the severity of platelet abnormalities; (ii) distinguish between altered platelet adhesion, aggregation and activation; and (iii) elucidate both collagen and non-collagen dependent alterations of thrombus formation. This approach may thereby aid in the better understanding and better assessment of genetic variation that affect in vivo arterial thrombosis and hemostasis.

Keywords: arterial thrombus formation; bleeding; collagen; glycoprotein VI; microfluidics; platelets.


Figures

Figure 1
Figure 1
Consistency of collagen-dependent thrombus formation between multiple wild-type mouse datasets. Blood from wild-type (WT) mice (databases as indicated in brackets) was perfused over collagen at a shear rate of 1000 s−1 (in two cases 1700 s−1), and parameters of thrombus formation were obtained by re-analysis of random brightfield images. Investigated wild-type mice (n = 22) had a C57Bl6 genetic background or, where indicated, a mixed C57Bl6 x 129SV background (M) or other background (O). For full details, see Table 1. (A) Heatmap of mean parameters, univariate scaled (0–10) across all mouse strains. Parameter clustering was as follows: platelet adhesion: P1 (platelet SAC%); thrombus signature: P2 (platelet aggregate SAC%), P3 (thrombus morphology score), P4 (thrombus multilayer score), P5 (thrombus contraction score); and platelet activation: P6 (PS exposure). Also indicated (black bars on the right) are the overall scaled values of platelet adhesion (P1) and thrombus signature (ΣP2-5). The wild-type datasets were arranged based on the alphabetical order of the (genetically) modified mice. (B,C) Correlations between parameters of thrombus formation for all cohorts of mice strains. Shown are Kendall's tau-b correlation coefficients (B) and corresponding p-values (C).
Figure 2
Figure 2
Multi-parameter comparison of collagen-dependent thrombus formation for 38 (genetically) deficient mice. Whole blood from mice with indicated genetic or antibody-induced defects as well as from corresponding wild-type mice was perfused over collagen-I. Parameters of thrombus formation were as indicated in Figure 1. For detailed information on mouse strains, see Table 1. Mean parameters per strain were scaled (0–10) across all wild-types (n = 22) and (genetically) modified mice (n = 38), as for Figure 1. Subtraction heatmaps showing differences between indicated genetic (or antibody-mediated) deficiency in comparison to wild-type, after filtering for differences outside the range of (composite) mean ± SD, to select relevant changes. (A) Ranking of genes based on effect on thrombus signature (ΣP2-5), as shown in black bars on the right. Colors indicate unchanged (black), decreased (green) or increased (red) parameters. (B) Ranking of genes based on effect on platelet adhesion (P1), as indicated in black bars. Colors represent unchanged (black), decreased (green) or increased (red) parameters. Non-subtracted heatmap values are provided in Supplementary Figure 2.
Figure 3
Figure 3
Microscopic imaging of whole blood thrombus formation on adjacent microspots. Whole blood from wild-type mice (DB 24) was flowed for 3.5 min at 1000 s−1 over three consecutive microspots of collagen-I (M1, upper row), rhodocytin/laminin/VWF-BP (M2, middle row), and laminin/VWF-BP (M3, lower row). Shown are representative brightfield and fluorescence microscopic images of the thrombi formed. Triple staining was performed with AF647-annexin A5, FITC-anti-CD62P Ab, and PE-JON/A Ab. Also indicated are the types of parameters (P1-8) taken from the image sets. Bar, 50 μm.
Figure 4
Figure 4
Multi-parameter comparison of thrombus formation on three microspots for 11 mouse strains with genetic deficiencies. Whole blood from mice with indicated genetic defects or corresponding wild-types was perfused over three microspots (M1-3), as for Figure 3. Brightfield images (P1-5) and fluorescence images (P6, AF647-annexin A5; P7, FITC anti-CD62P Ab; P8, PE-JON/A Ab) were analyzed for each microspot. Per microspot, parameter values were univariate scaled (0-10) across all mouse strains. (A) Subtraction heatmap of differences between deficient and wild-type strains, filtered for changes outside the range of (composite) mean ± SD, to select relevant changes. Genes were ranked based on effects on thrombus signature (ΣP2-5) across microspots M1-3, as shown in black bars. Colors represent unchanged (black), decreased (green) or increased (red) parameters. (B) Subtraction heatmap with ranking based on gene effects on platelet adhesion (P1), as indicated in right black bars.
Figure 5
Figure 5
Effects of genetic modification on arterial thrombosis and tail bleeding in comparison to collagen-dependent thrombus formation using microfluidics. Effects of genetic or antibody-induced defects of concerning mouse strains on arterial thrombosis and tail bleeding was obtained from the literature (see Table 1). Effects were classified as being unchanged (black), antithrombotic/prolonged bleeding (green) or prothrombotic/shortened bleeding (red), according to procedures described before (23). White color indicates that information is lacking. Heat mapped data were ranked based on summative effects on all thrombus formation parameters (ΣP1-5) from surface M1.
Figure 6
Figure 6
Network of protein-protein interactions in collagen-dependent thrombus formation. Network, constructed from the STRING database and visualized in Cytoscape, of murine protein-protein interactions with as seed the 37 investigated core genes. The network contained 117 nodes (37 core nodes, 80 novel nodes) and 1142 edges. Core nodes of the network were color- and size-coded based on altered thrombus signature (ΣP2-5) at surface M1. Green color intensity (larger size) of nodes points to a stronger reducing effect, and red color intensity (large size) to a stronger stimulating effect in comparison to wild-type. Novel nodes are indicated in gray.

References

    1. Ruggeri ZM, Mendolicchio GL. Adhesion mechanisms in platelet function. Circ Res. (2007) 100:1673–85. 10.1161/01.RES.0000267878.97021.ab - DOI - PubMed
    1. Stegner D, Nieswandt B. Platelet receptor signaling in thrombus formation. J Mol Med. (2011) 89:109–21. 10.1007/s00109-010-0691-5 - DOI - PubMed
    1. Versteeg HH, Heemskerk JW, Levi M, Reitsma PH. New fundamentals in hemostasis. Physiol Rev. (2013) 93:327–58. 10.1152/physrev.00016.2011 - DOI - PubMed
    1. Van der Meijden PE, Heemskerk JW. Platelet biology and functions: new concepts and future clinical perspectives Nat. Rev Cardiol. (2019) 16:166–79. 10.1182/blood-2008-07-171066 - DOI - PubMed
    1. Nieswandt B, Brakebusch C, Bergmeier W, Schulte V, Bouvard D, Mokhtari-Nejad R, et al. Glycoprotein VI but not α2β1 integrin is essential for platelet interaction with collagen. EMBO J. (2001) 20:2120–30. 10.1093/emboj/20.9.2120 - DOI - PMC - PubMed