. 2019 Nov;52(6):e12673.
doi: 10.1111/cpr.12673. Epub 2019 Aug 16.

Inhibition of CREB-mediated ZO-1 and activation of NF-κB-induced IL-6 by colonic epithelial MCT4 destroys intestinal barrier function

Affiliations

Inhibition of CREB-mediated ZO-1 and activation of NF-κB-induced IL-6 by colonic epithelial MCT4 destroys intestinal barrier function

Shunxian Zhang et al. Cell Prolif. 2019 Nov.

Abstract

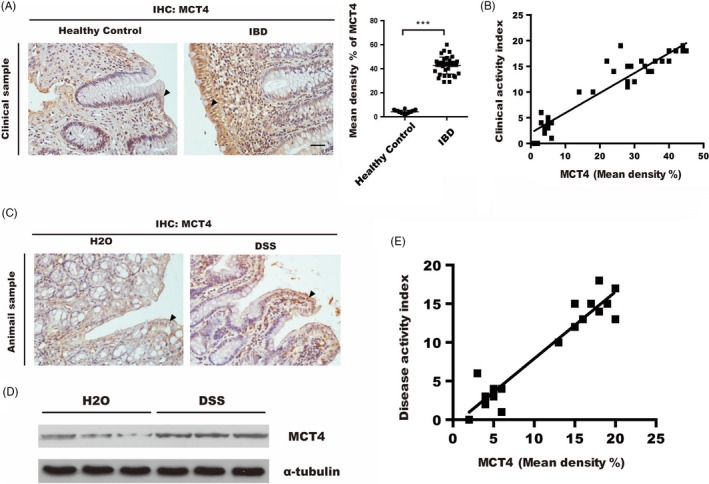
Objective: Inflammatory bowel disease (IBD) is a disorder intestinal inflammation and impaired barrier function, associated with increased epithelial expression of monocarboxylate transporter 4 (MCT4). However, the specific non-metabolic function and clinical relevance of MCT4 in IBD remain to be fully elucidated.

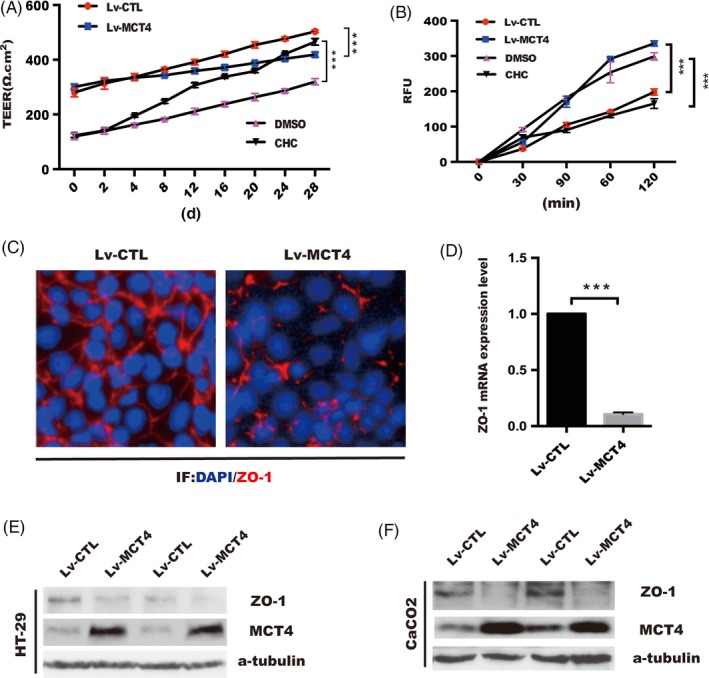
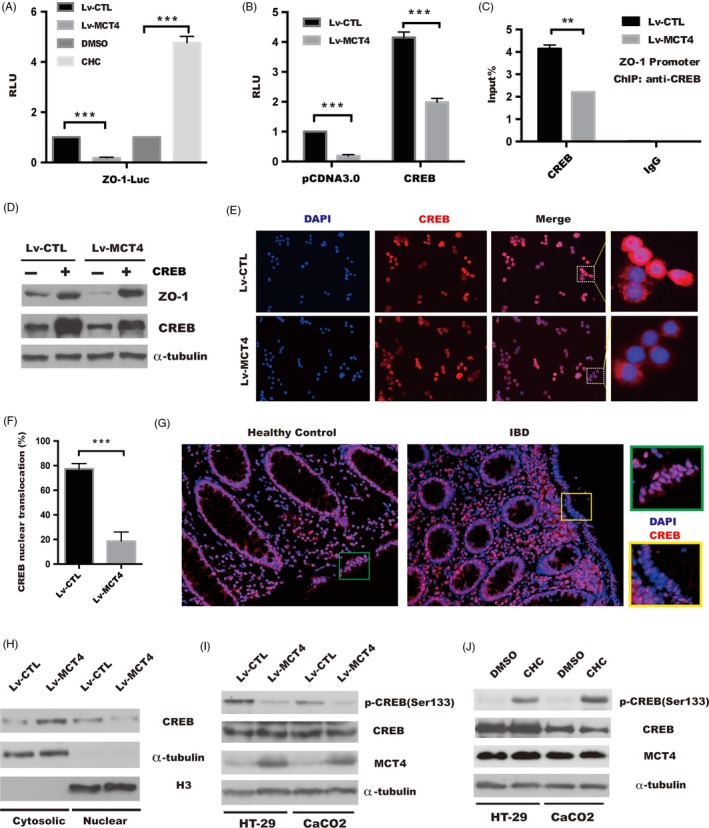
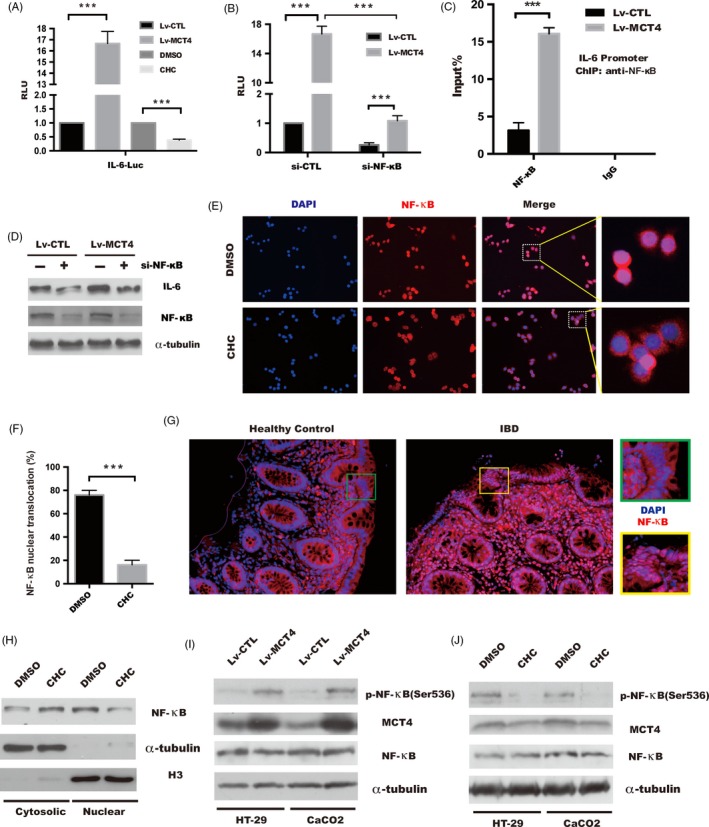
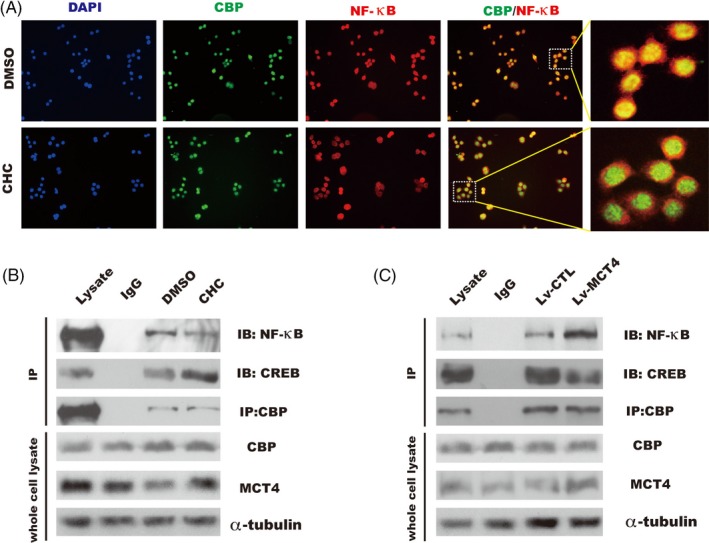
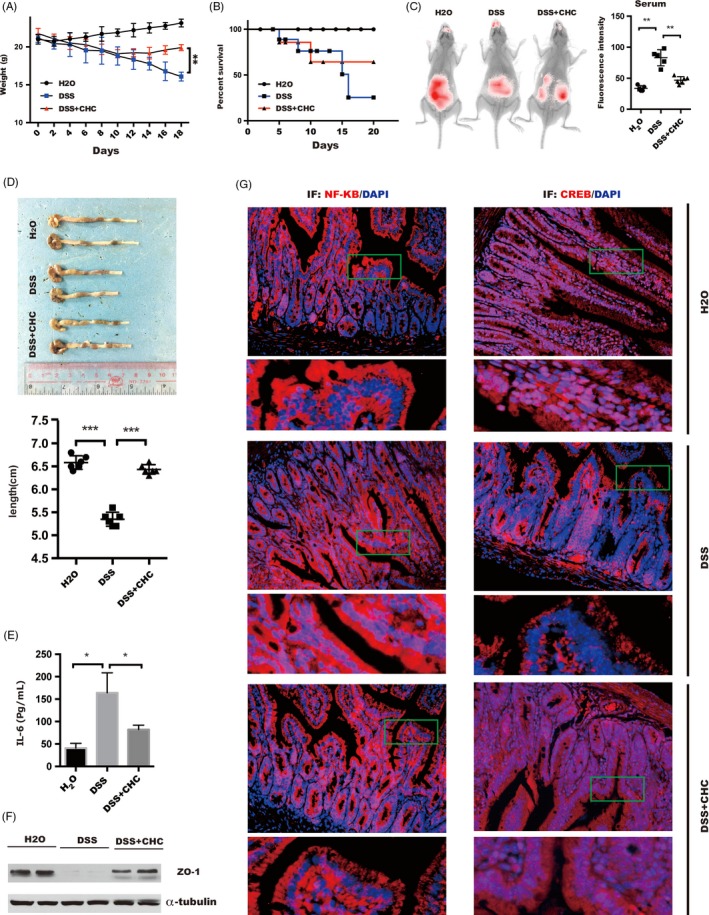
Methods: Lentivirus-mediated overexpression of MCT4 was used to assess the role of MCT4 in transcriptionally regulating ZO-1 and IL-6 expression by luciferase assays, WB and ChIP. IP was used to analyse the effect of MCT4 on the interaction NF-κB-CBP or CREB-CBP, and these MCT4-mediated effects were confirmed in vivo assay.

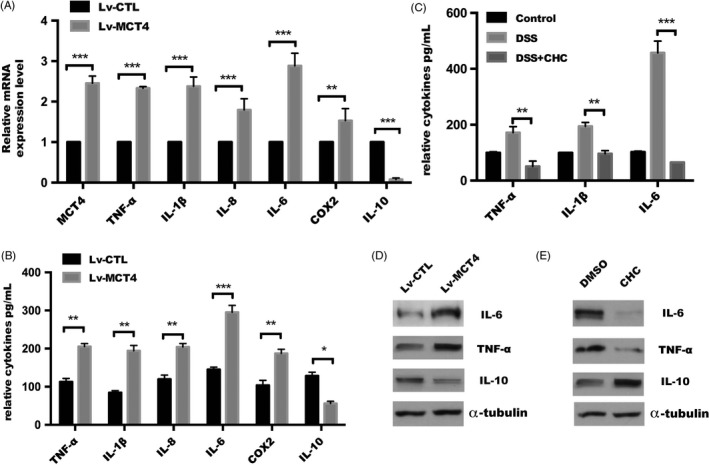
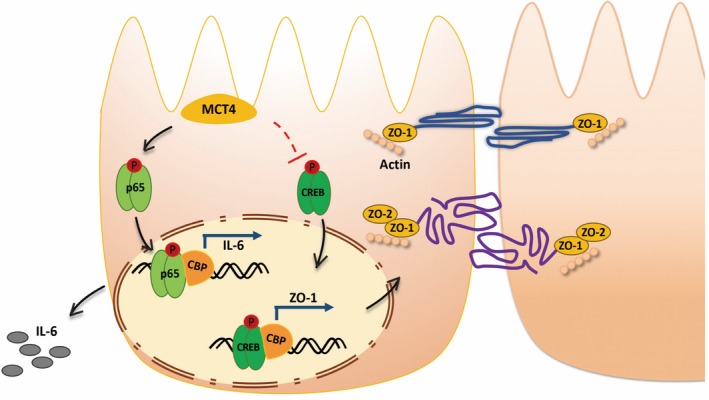
Results: We showed that ectopic expression of MCT4 inhibited ZO-1 expression, while increased pro-inflammatory factors expression, leading to destroy intestinal epithelial barrier function in vitro and in vivo. Mechanistically, MCT4 contributed NF-κB p65 nuclear translocation and increased the binding of NF-κB p65 to the promoter of IL-6, which is attributed to MCT4 enhanced NF-κB-CBP interaction and dissolved CREB-CBP complex, resulting in reduction of CREB activity and CREB-mediated ZO-1 expression. In addition, treatment of experimental colitis with MCT4 inhibitor α-cyano-4-hydroxycinnamate (CHC) ameliorated mucosal intestinal barrier function, which was due to attenuation of pro-inflammation factors expression and enhancement of ZO-1 expression.

Conclusion: These findings suggested a novel role of MCT4 in controlling development of IBD and provided evidence for potential targets of IBD.

Keywords: CREB; IL-6; ZO-1; inflammatory bowel disease; monocarboxylate transporter 4; nuclear factor-κB.


Conflict of interest statement

The authors declared that they have no conflict of interests.

Figures

Figure 1
Figure 1
MCT4 is increased in human UC and DSS‐induced experimental colitis. A, Representative sections were prepared from colonic mucosa of healthy control and inflammatory bowel disease (IBD) patients and stained for MCT4 expression, ***P < .001, scale bar: 50 μm. B, Correlation between MCT4 in colon biopsies and clinical activity index. C‐D, MCT4 expression was analysed via IHC and immunoblotting in indicated treatment. E, Correlation between MCT4 in DSS‐induced colitis and disease activity index. Scale bar: 50 μm
Figure 2
Figure 2
MCT4 destroys epithelial barrier function and inhibits ZO‐1 expression. A, Transepithelial electrical resistance was detected over time in CaCO2 cells treated as indicated. B, Cy7‐dextran paracellular intestinal epithelial permeability was performed at 28 days post incubation. C, Immunofluorescence staining of tight junction protein ZO‐1 in CaCO2 cells was grown to confluence in indicated group. D, ZO‐1 mRNA level was analysed in real‐time PCR analysis in CaCO2 cells, scale bar: 50 μm. E‐F, Western blotting was employed to detect ZO‐1 expression in stable HT‐29 and CaCO2 cells with MCT4 overexpression
Figure 3
Figure 3
MCT4 inhibits phosphorylation of CREB(Ser133) and attenuates CREB‐mediated ZO‐1 transactivity. A, Luciferase activity in cells which was transiently transfected with the pGL4.17‐ZO‐1 promoter plasmid together with renilia plasmid in stable HT‐29 cells or in HT‐29 cell treated as indicated. The Renilla luciferase activities were used as internal controls. One‐way analysis of variance (ANOVA) and Dunnett's multiple comparison test, ***P < .001, n = 3; error bars indicate s.d. B, pGL4.17‐ZO‐1 promoter plasmid together with pCDNA 3.0 or CREB plasmid was transfected into indicated stable HT‐29 cells, and the Renilla luciferase activities were used as internal controls. Two‐way analysis of variance (ANOVA) and Dunnett's multiple comparison test, ***P < .001, n = 3; error bars indicate s.d. C, ChIP analysis of binding of CREB protein to ZO‐1 gene promoter in CaCO2 cells treated as indicated. Student's t test, **P < .05, n = 3; error bars indicated s.d. D, Western blotting was performed to analyse ZO‐1 expression in indicated CaCO2 cells transfected with CREB or control plasmid, α‐tubulin served as internal control. E, Immunofluorescence was employed to detect CREB nuclear translocation in indicated HT‐29 cells, scale bar: 200 μm. F, Percentage of cells that exhibited CREB nuclear translocation. Data represent the means ± s.d. of three independent experiments and were analysed by t test, ***P < .05. G, CREB nuclear location in intestinal tissue from patients with IBD and healthy control was performed by IF, scale bar: 100 μm. H, Levels of nuclear (Nuclear) and cytosolic (Cytosolic) CREB were determined by immunoblotting analysis. α‐tubulin and H3 were used as internal controls for the cytosolic and nuclear fractions, respectively. I‐J, Whole cell lysates were separated by SDS‐PAGE and assayed with the antibodies against the indicated proteins, inducing pCREB(Ser133), CREB and MCT4, in indicated group of HT‐29 and CaCO2 cells, and α‐tubulin was determined to ensure equal loading
Figure 4
Figure 4
MCT4 modulates various inflammatory cytokines expression. (A) Real‐time PCR and (B) ELISA assay were performed to detect a serial of genes expression in CaCO2 cells. (C) Relative cytokines in serum levels assayed in mice treated as indicated. (D‐E) Western blotting was performed to detect relative cytokines expression in indicated group
Figure 5
Figure 5
Increased phosphorylation of NF‐κB(Ser536) and NF‐κB‐induced IL‐6 transactivity in response to MCT4 overexpression. A, Luciferase activity was performed by transiently transfecting with the pGL4.17‐IL‐6 promoter plasmid together with renilia plasmid in stable CaCO2 cells or in CaCO2 cells treated as indicated, respectively. The Renilla luciferase activities were used as internal controls. One‐way analysis of variance (ANOVA) and Dunnett's multiple comparison test, ***P < .001, n = 3; error bars indicate s.d. B, pGL4.17‐IL‐6 promoter plasmid together with si‐CTL or si‐NF‐κB was transfected into indicated stable HT‐29 cells, and the Renilla luciferase activities were used as internal controls. Two‐way analysis of variance (ANOVA) and Dunnett's multiple comparison test, ***P < .001, n = 3; error bars indicate s.d. C, ChIP analysis of binding of NF‐κB protein to IL‐6 gene promoter in stable CaCO2 cells. Student's t test, ***P < .001, n = 3; error bars indicated s.d. D, Immunoblotting was performed to analyse IL‐6 expression in indicated stable CaCO2 cells transfected with si‐CTL or si‐NF‐κB, respectively, and α‐tubulin was used as internal control. E, Immunofluorescence of NF‐κB location in indicated HT‐29 cells treated by DMSO or CHC 1 hour, scale bar: 200 μm. F, Percentage of cells that exhibited NF‐κB nuclear translocation. Data represent the means ± s.d. of three independent experiments and were analysed by t test, ***P < .001. G, Immunofluorescence of NF‐κB nuclear location in intestinal tissue from patient with IBD and healthy control, scale bar: 100 μm. H, Analysis of subcellular fractionation of NF‐κB by immunoblotting analysis in CaCO2 cell treated with DMSO or CHC, respectively. α‐tubulin and H3 served as internal controls for the cytosolic and nuclear fractions, respectively. I‐J, Whole cell lysates were subjected to SDS‐PAGE and assayed with the antibodies against the indicated proteins in indicated group of HT‐29 and CaCO2 cells, and α‐tubulin was determined to ensure equal loading
Figure 6
Figure 6
MCT4 modulates the interaction of CBP and NF‐κB or CREB. A, Co‐localization of endogenous CBP and NF‐κB by immunofluorescence performed in HT‐29 cells treated as indicated, respectively, scale bar: 200 μm. B, CaCO2 cells were grown to 80% confluence and replaced with medium without serum for 18 h, and then stimulated with DMSO or CHC for 1 h; whole cell lysates were immunoprecipitated (IP) with antibodies against endogenous CBP; and NF‐κB and CREB were detected by immunoblotting. C, Indicated stable CaCO2 cells were grown to 80% confluence, whole cell lysates were immunoprecipitated (IP) with antibodies against endogenous CBP, and co‐precipitates with NF‐κB/CREB were detected by immunoblotting
Figure 7
Figure 7
Administration of CHC ameliorates DSS‐induced colitis in mice. Two groups of DSS‐exposed mice (n = 15) were administered intraperitoneally with CHC (10 mmol/L, 100 μL) or vehicle daily starting on day 5‐20 after DSS induction. Another group of mice without receiving water treatment (n = 15) daily on the same schedule as positive controls. (A) The changes in body weight and (B) overall survival were expressed as the percentage of initial survival rate at the start of the experiments as 100%. **P < .01. (C) In vivo detection of orally administered tracer (10 kDa dextran) for 1 hour. Representative in vivo live imaging is shown on the left and quantitation of fluorescent in serum on the right. Data represent the means ± s.d. of three independent experiments and were analysed by one ANOVA, **P < .01. (D) Representative colon length of mice in group treated as indicated (upper panel), and statistical significance was performed by one‐way ANOVA, ***P < .001(lower panel). (E) The concentration of IL‐6 level in serum was measured in different groups by ELISA assay and analysed by One‐way ANOVA, *P < .05. (F) ZO‐1 expression was analysed via immunoblotting in indicated group. (G) The nuclear location of NF‐κB (left panel) or CREB (right panel) was detected by immunofluorescence, scale bar: 100 μm
Figure 8
Figure 8
Schematic illustration for the crosstalk of MCT4 and CREB or NF‐κB in regulation of IBD. On one hand, MCT4 primarily mediates phosphorylation of CREB (Ser133) and leads to reduce CREB nuclear translocation and DNA binding to the promoter of ZO‐1. On the other hand, MCT4 leads to NF‐κB p65 phosphorylation and directs NF‐κB p65 nuclear translocation, and DNA binding to IL‐6 promoter. Most importantly, MCT4 contributes to interaction of NF‐κB p65 with CBP, which in turn to disrupt CREB‐CBP complex, depicting the alteration of MCT4 is critical to modulate shift balance between NF‐κB‐CBP and CREB‐CBP complex, and these results implied proper expression of MCT4 is critical to improve IBD

References

    1. Knowles SR, Graff LA, Wilding H, Hewitt C, Keefer L, Mikocka‐Walus A. Quality of life in inflammatory bowel disease: a systematic review and meta‐analyses‐part I. Inflamm Bowel Dis. 2018;24(4):742‐751. - PubMed
    1. Taylor K, Scruggs PW, Balemba OB, Wiest MM, Vella CA. Associations between physical activity, resilience, and quality of life in people with inflammatory bowel disease. Eur J Appl Physiol. 2018;118(4):829‐836. - PubMed
    1. Holmberg F, Pedersen J, Jorgensen P, Soendergaard C, Jensen KB, Nielsen OH. Intestinal barrier integrity and inflammatory bowel disease: Stem cell‐based approaches to regenerate the barrier. J Tissue Eng Regen Med. 2018;12(4):923‐935. - PubMed
    1. Henderson P, van Limbergen JE, Schwarze J, Wilson DC. Function of the intestinal epithelium and its dysregulation in inflammatory bowel disease. Inflamm Bowel Dis. 2011;17(1):382‐395. - PubMed
    1. Mentrup HL, Hartman A, Thames EL, Basheer WA, Matesic LE. The ubiquitin ligase ITCH coordinates small intestinal epithelial homeostasis by modulating cell proliferation, differentiation, and migration. Differentiation. 2018;99:51‐61. - PMC - PubMed

MeSH terms

LinkOut - more resources