

The Copenhagen Sarcopenia Study: lean mass, strength, power, and physical function in a Danish cohort aged 20-93 years
- PMID: 31419087
- PMCID: PMC6903448
- DOI: 10.1002/jcsm.12477
The Copenhagen Sarcopenia Study: lean mass, strength, power, and physical function in a Danish cohort aged 20-93 years
Abstract
Background: Despite no international consensus on the diagnostic criteria for sarcopenia, low lean mass, muscle strength, and physical function are important risk factors for disability, frailty, and mortality in older individuals, as well as in a wide range of patients with muscle loss. Here, we provide a population-based reference material of total and regional lean body mass, muscle strength/power parameters, and physical function in a healthy cohort of Danish men and women across the lifespan.
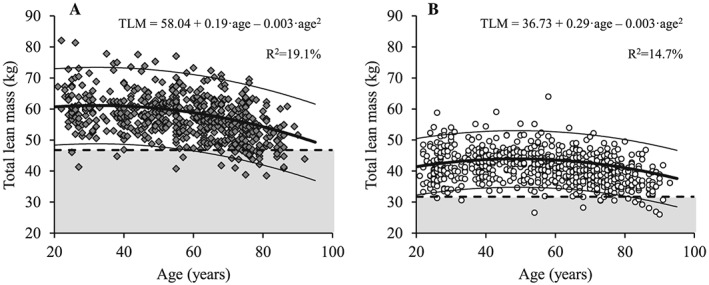
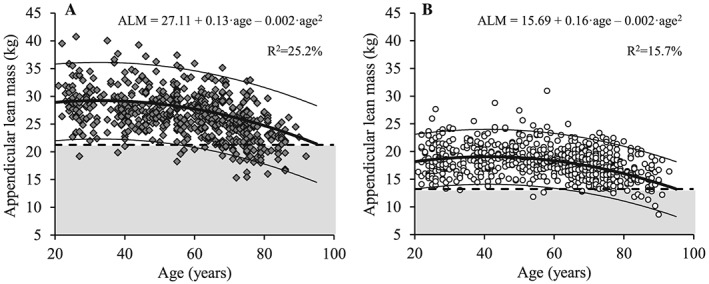
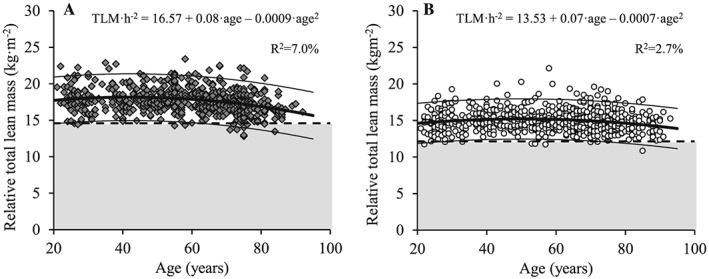
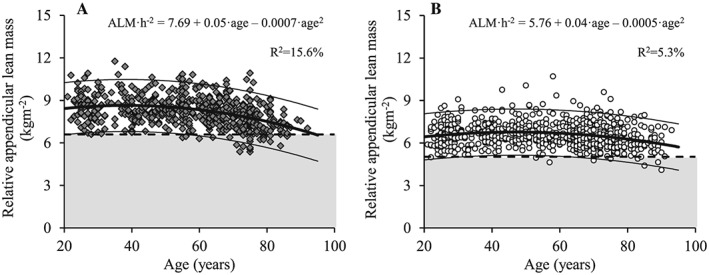
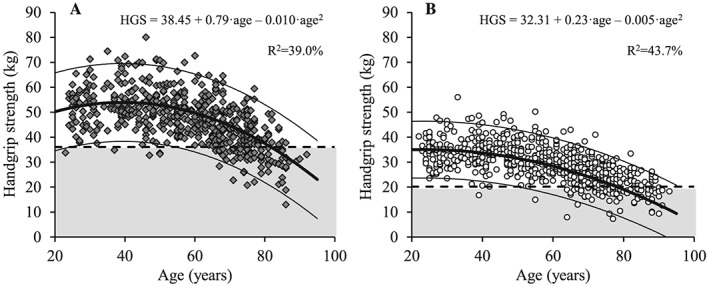
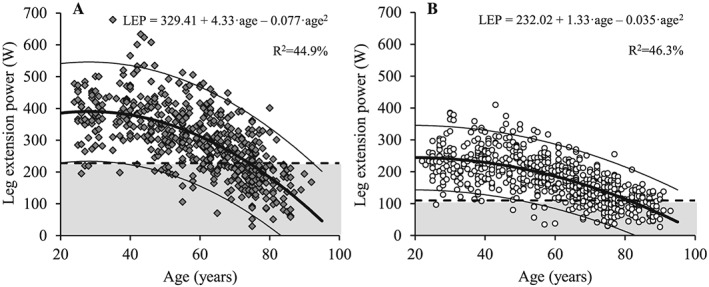
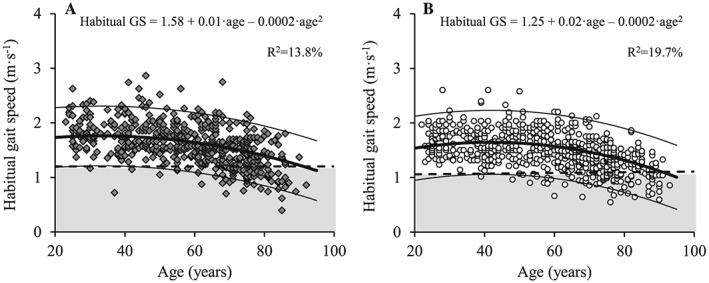
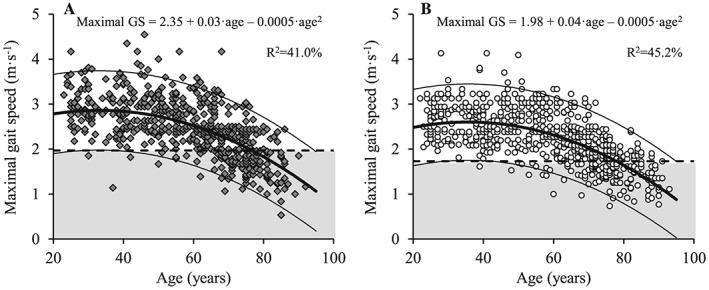
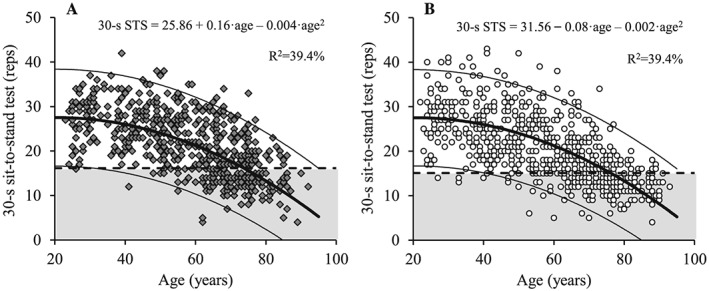
Methods: Volunteers aged 20-93 years from the Copenhagen City Heart Study were invited to establish a Danish reference material (Copenhagen Sarcopenia Study) on lean mass characteristics [appendicular lean mass (ALM), iDXA, GE Lunar], muscle function [handgrip strength (HGS), Jamar dynamometer and leg extension power (LEP), Nottingham Power Rig], and physical function [30 s sit-to-stand test (STS), 10-m maximal and habitual gait speed (GS)].
Results: A total of 1305 participants [729 women (age: 56.4 ± 18.9 years, height: 1.66 ± 0.01 m, body mass index: 24.6 ± 4.3 kg/m2 and 576 men, age: 57.0 ± 17.5 years, height: 1.80 ± 0.07 m, body mass index: 26.0 ± 3.9 kg/m2 ] completed all measurements and were included in the present analysis. Lean mass characteristics (TLM, ALM, and ALM/h2 ) decreased with increasing age in both men and women (P < 0.001). Men demonstrated larger absolute and relative total ALM and higher HGS and LEP compared with women at all age intervals (P < 0.001). HGS and LEP decreased progressively with age in both men and women (P < 0.01); 30 s STS performance, habitual GS, and maximal GS decreased at an accellerated rate of decline with increasing age in both men and women (P < 0.001). Habitual GS was reduced in men and women aged ≥70 years, while maximal GS was reduced from the age of ≥60 years compared with young adults (P < 0.001). Regardless of sex, 30 s STS was reduced from the age of ≥50 years compared with the young reference group (P < 0.001) CONCLUSIONS: While the power-based measurements (LEP and 30 s STS) started to decline already at age +50 years, less power-based parameters (GS and HGS) and lean mass characteristics (TLM, ALM, and ALM/h2 ) remained unaltered until after the age of +70 years. Notably, the cut-off thresholds derived in the present study differed from earlier reference data, which underlines the importance of obtaining updated and local reference materials.
Keywords: Body composition; DXA; Handgrip strength; Lean mass; Leg power; Sarcopenia.
© 2019 The Authors Journal of Cachexia, Sarcopenia and Muscle published by John Wiley & Sons Ltd on behalf of Society on Sarcopenia, Cachexia and Wasting Disorders.
Conflict of interest statement
The authors declare that they have no conflict of interests and certify that they comply with the ethical guidelines for authorship and publishing in the
Figures
References
-
- Rosenberg IH. Sarcopenia: origins and clinical relevance. J Nutr 1997. May;127:990S–991S, Review. - PubMed
-
- Baumgartner RN, Koehler KM, Gallagher D, Romero L, Heymsfield SB, Ross RR, et al. Epidemiology of sarcopenia among the elderly in New Mexico. Am J Epidemiol 1998;147:755–763. - PubMed
-
- Cruz‐Jentoft AJ, Baeyens JP, Bauer JM, Boirie Y, Cederholm T, Landi F, et al. European Working Group on Sarcopenia in Older People. Sarcopenia: European consensus on definition and diagnosis: report of the European Working Group on Sarcopenia in Older People. Age Ageing 2010. Jul;39:412–423. - PMC - PubMed
-
- Chen LK, Liu LK, Woo J, Assantachai P, Auyeung TW, Bahyah KS, et al. Sarcopenia in Asia: consensus report of the Asian Working Group for Sarcopenia. J Am Med Dir Assoc 2014. Feb;15:95–101. - PubMed
MeSH terms
LinkOut - more resources
Full Text Sources
Medical
Miscellaneous
