Comparative Study
. 2019 Aug 16;13(8):e0007673.
doi: 10.1371/journal.pntd.0007673. eCollection 2019 Aug.

Transcriptional blood signatures for active and amphotericin B treated visceral leishmaniasis in India

Affiliations
Comparative Study

Transcriptional blood signatures for active and amphotericin B treated visceral leishmaniasis in India

Michaela Fakiola et al. PLoS Negl Trop Dis. .

Abstract

Amphotericin B provides improved therapy for visceral leishmaniasis (VL) caused by Leishmania donovani, with single dose liposomal-encapsulated Ambisome providing the best cure rates. The VL elimination program aims to reduce the incidence rate in the Indian subcontinent to <1/10,000 population/year. Ability to predict which asymptomatic individuals (e.g. anti-leishmanial IgG and/or Leishmania-specific modified Quantiferon positive) will progress to clinical VL would help in monitoring disease outbreaks. Here we examined whole blood transcriptional profiles associated with asymptomatic infection, active disease, and in treated cases. Two independent microarray experiments were performed, with analysis focussed primarily on differentially expressed genes (DEGs) concordant across both experiments. No DEGs were identified for IgG or Quantiferon positive asymptomatic groups compared to negative healthy endemic controls. We therefore concentrated on comparing concordant DEGs from active cases with all healthy controls, and in examining differences in the transcriptome following different regimens of drug treatment. In these comparisons 6 major themes emerged: (i) expression of genes and enrichment of gene sets associated with erythrocyte function in active cases; (ii) strong evidence for enrichment of gene sets involved in cell cycle in comparing active cases with healthy controls; (iii) identification of IFNG encoding interferon-γ as the major hub gene in concordant gene expression patterns across experiments comparing active cases with healthy controls or with treated cases; (iv) enrichment for interleukin signalling (IL-1/3/4/6/7/8) and a prominent role for CXCL10/9/11 and chemokine signalling pathways in comparing active cases with treated cases; (v) the novel identification of Aryl Hydrocarbon Receptor signalling as a significant canonical pathway when comparing active cases with healthy controls or with treated cases; and (vi) global expression profiling support for more effective cure at day 30 post-treatment with a single dose of liposomal encapsulated amphotericin B compared to multi-dose non-liposomal amphotericin B treatment over 30 days. (296 words; 300 words allowed).


Conflict of interest statement

The authors have declared that no competing interests exist.

Figures

Fig 1
Fig 1. Principal components analysis (PCA) and hierarchical clustering of top 500 most variable probes.
(A) PC1 by PC2 and (B) PC1 by PC3 in experiment 1, and (D) PC1 by PC2 and (E) PC1 by PC3 in experiment 2. Z-score transformed expression levels of the 500 most variable probes across all samples are represented as a heatmap for (C) experiment 1 and (F) experiment 2. Hierarchical clustering results based on Pearson’s correlation are shown as dendrograms on the top and left side of the matrix. Columns represent individual samples and rows individual probes. Experimental groups are color coded on the upper part of the heatmap. Active (= case) and treated (= treated) cases, as well as aymptomatics (= Quantiferon or HighAb positive individuals) and endemic healthy controls (= EHC), are colour coded as per the keys provided.
Fig 2
Fig 2. Heatmaps for top differentially expressed genes between active cases and healthy controls.
(A) top 10 “induced” and (B) top 10 “repressed” genes for differential expression between active cases (N = 10) and healthy controls (N = 16) in experiment 1. (C) and (D) show heatmaps for the same genes in active cases (N = 10) and healthy controls (N = 25) using data from experiment 2. Columns represent individuals and rows represent individual genes, coloured to indicate expression levels based on post-QC normalised and log2-trasnformed data as indicated by the legend to the left of each figure. LogFC = log2 fold-change.
Fig 3
Fig 3. Gene network for concordant genes comparing active cases and healthy controls.
The network was generated in IPA for 254 (of 391) genes concordant across experiments 1 and 2 for differential expression (adjusted p-value ≤0.05; ≥2-fold change) when comparing active cases and healthy controls. Genes in red have increased expression and genes in green have decreased expression when comparing active cases with healthy controls. The more intense the colour the larger the fold change values. Expression values are based in experiment 1, representative of similar results obtained for concordant genes across the two experiments.
Fig 4
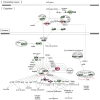
Fig 4. Schematic representation of the core Aryl Hydrocarbon Receptor (AHR) Signalling pathway.
The pathway was generated in IPA using data for concordant differentially expressed (Padj<0.05) genes across the two experiments. Molecules outlined in purple achieved fold-change >2. Genes in green have decreased expression in active cases compared to healthy controls, genes in red have increased expression. The more intense the colour the larger the fold change values. Expression values are based in experiment 1, representative of similar results obtained for concordant genes across the two experiments.
Fig 5
Fig 5. Heatmaps for top differentially expressed genes between active cases and treated cases.
(A) top 10 “induced” and (B) top 10 “repressed” genes for differential expression between active cases (N = 10) and treated cases (N = 10) in experiment 1. (C) and (D) show heatmaps for the same genes in active cases (N = 11) and treated cases (N = 12) using data from experiment 2. Columns represent individuals and rows represent individual genes, coloured to indicate expression levels based on post-QC normalised and log2-transformed data as indicated by the legend to the left of each figure. LogFC = log2 fold-change.
Fig 6
Fig 6. Gene network for concordant genes comparing active cases and treated cases.
The network was generated in IPA for 85 (of 210) genes concordant across experiments 1 and 2 for differential expression (adjusted p-value ≤0.05) when comparing active cases and treated cases. Genes in red have increased expression and genes in green have decreased expression when comparing active cases with treated cases. The more intense the colour the larger the fold change values. Expression values are based in experiment 1, representative of similar results obtained for concordant genes across the two experiments.

References

    1. Alvar J, Velez ID, Bern C, Herrero M, Desjeux P, Cano J, et al. Leishmaniasis worldwide and global estimates of its incidence. PLoS ONE. 2012;7(5):e35671 Epub 2012/06/14. 10.1371/journal.pone.0035671 . - DOI - PMC - PubMed
    1. Sundar S, Singh A. Recent developments and future prospects in the treatment of visceral leishmaniasis. Ther Adv Infect Dis. 2016;3(3–4):98–109. 10.1177/2049936116646063 . - DOI - PMC - PubMed
    1. Croft SL, Sundar S, Fairlamb AH. Drug resistance in leishmaniasis. Clin Microbiol Rev. 2006;19(1):111–26. Epub 2006/01/19. 10.1128/CMR.19.1.111-126.2006 . - DOI - PMC - PubMed
    1. Singh OP, Hasker E, Boelaert M, Sundar S. Elimination of visceral leishmaniasis on the Indian subcontinent. Lancet Infect Dis. 2016;16(12):e304–e9. 10.1016/S1473-3099(16)30140-2 . - DOI - PMC - PubMed
    1. Hasker E, Kansal S, Malaviya P, Gidwani K, Picado A, Singh RP, et al. Latent infection with Leishmania donovani in highly endemic villages in Bihar, India. PLoS Negl Trop Dis. 2013;7(2):e2053 10.1371/journal.pntd.0002053 . - DOI - PMC - PubMed

Publication types