. 2020 Apr;153(1):33-50.
doi: 10.1111/jnc.14854. Epub 2019 Nov 28.

Fast serotonin voltammetry as a versatile tool for mapping dynamic tissue architecture: I. Responses at carbon fibers describe local tissue physiology

Affiliations

Fast serotonin voltammetry as a versatile tool for mapping dynamic tissue architecture: I. Responses at carbon fibers describe local tissue physiology

Aya Abdalla et al. J Neurochem. 2020 Apr.

Abstract

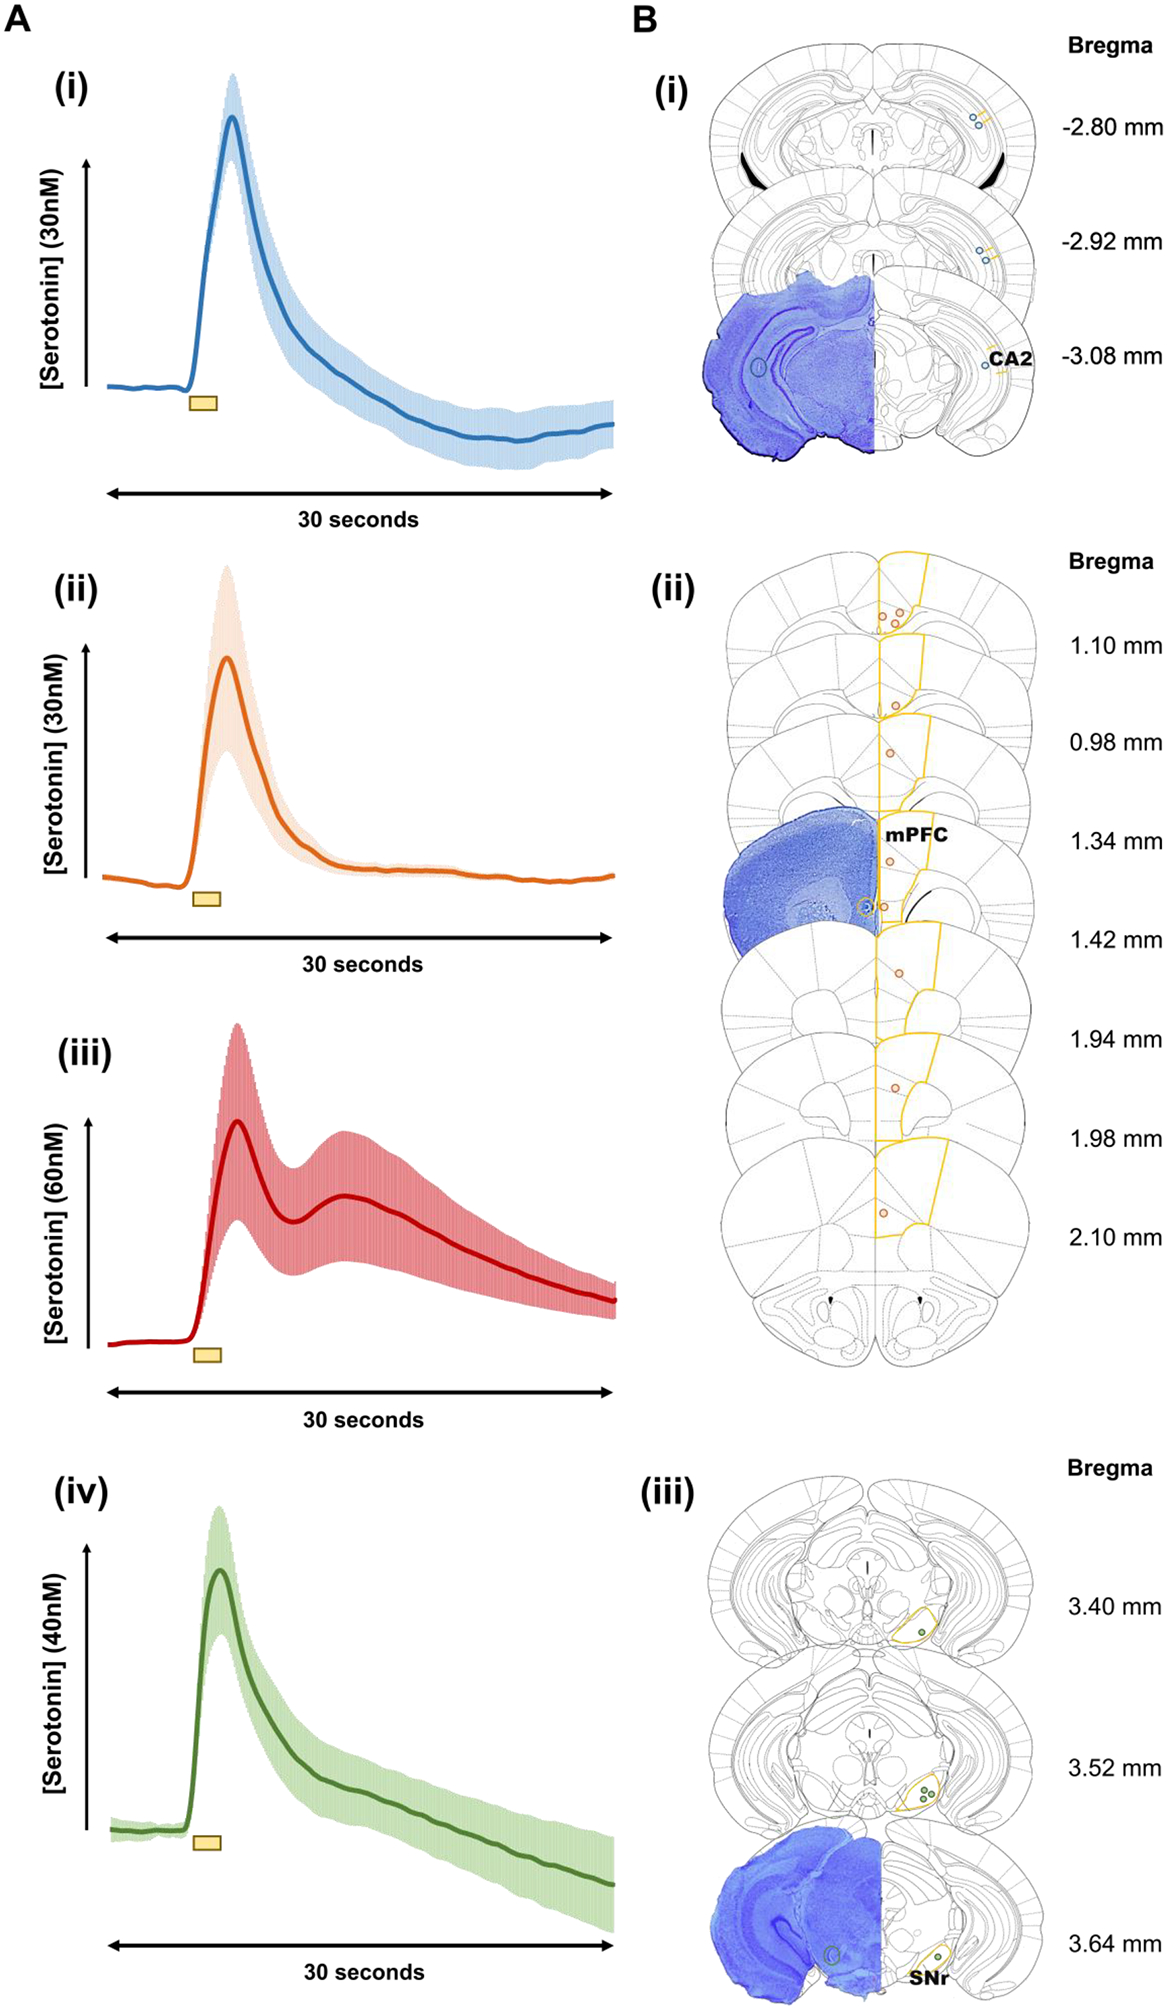
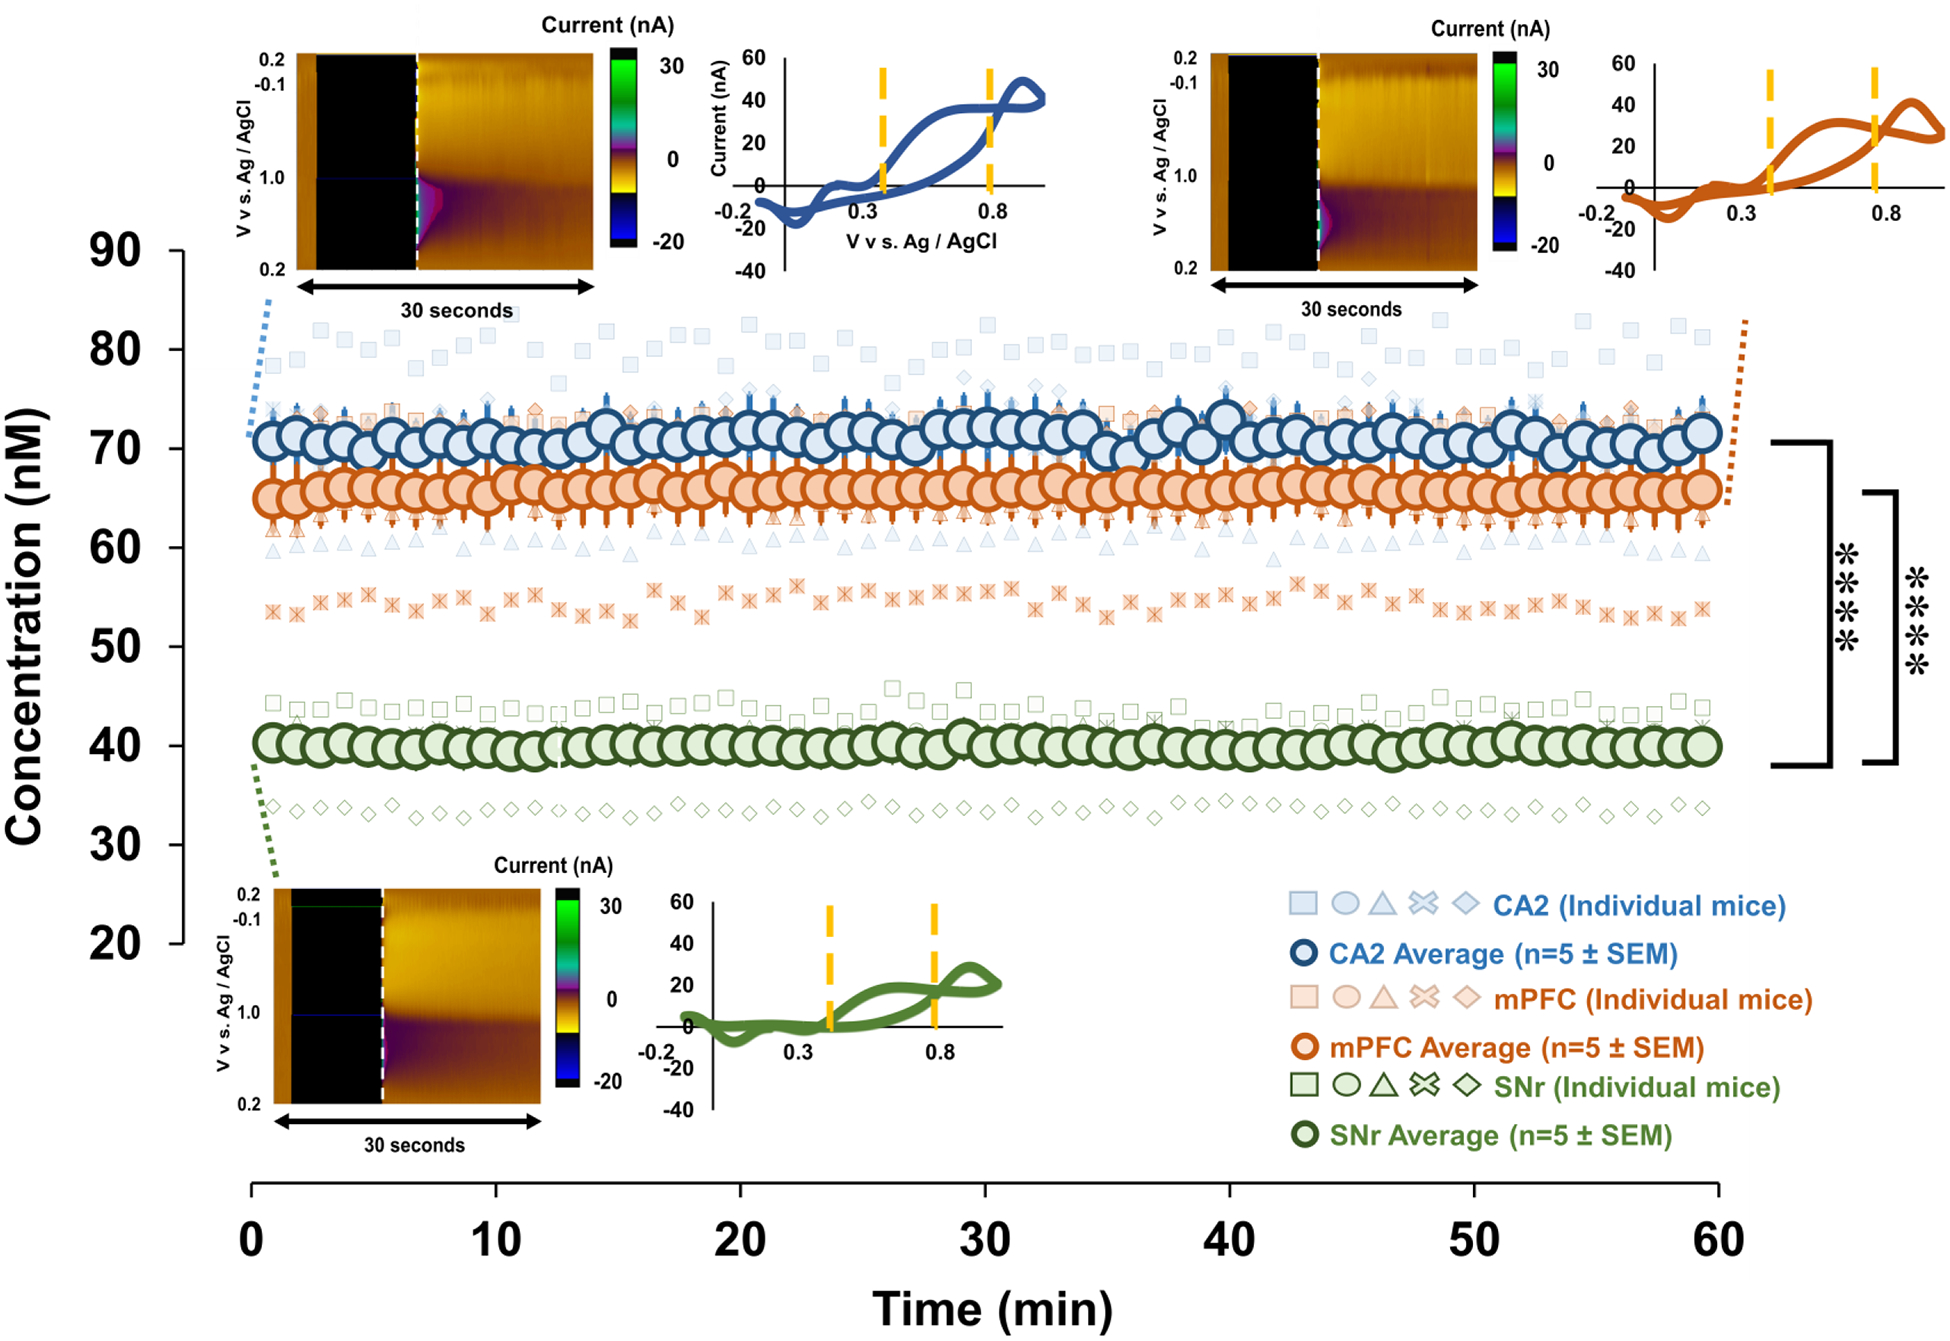
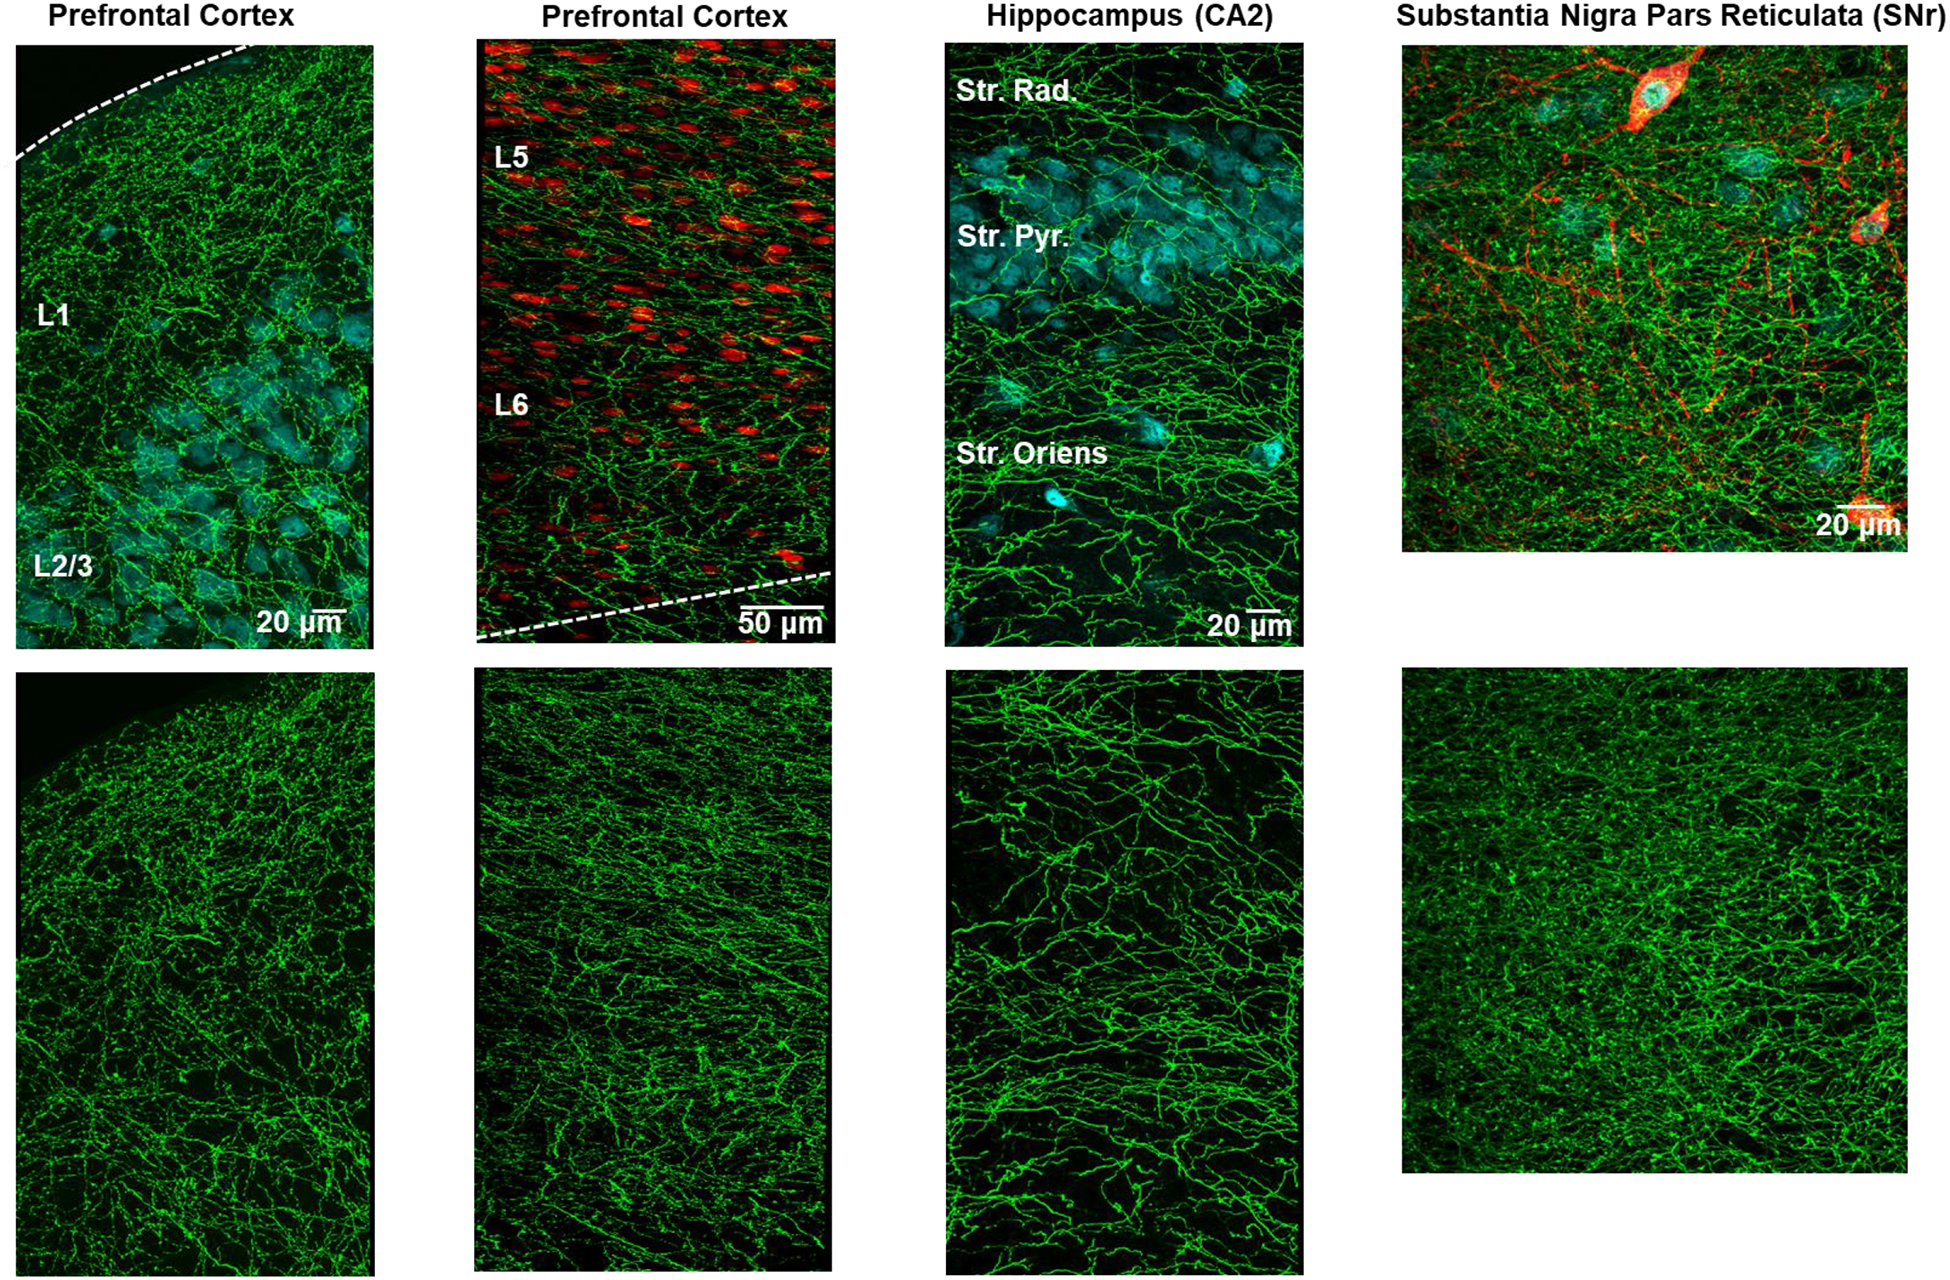
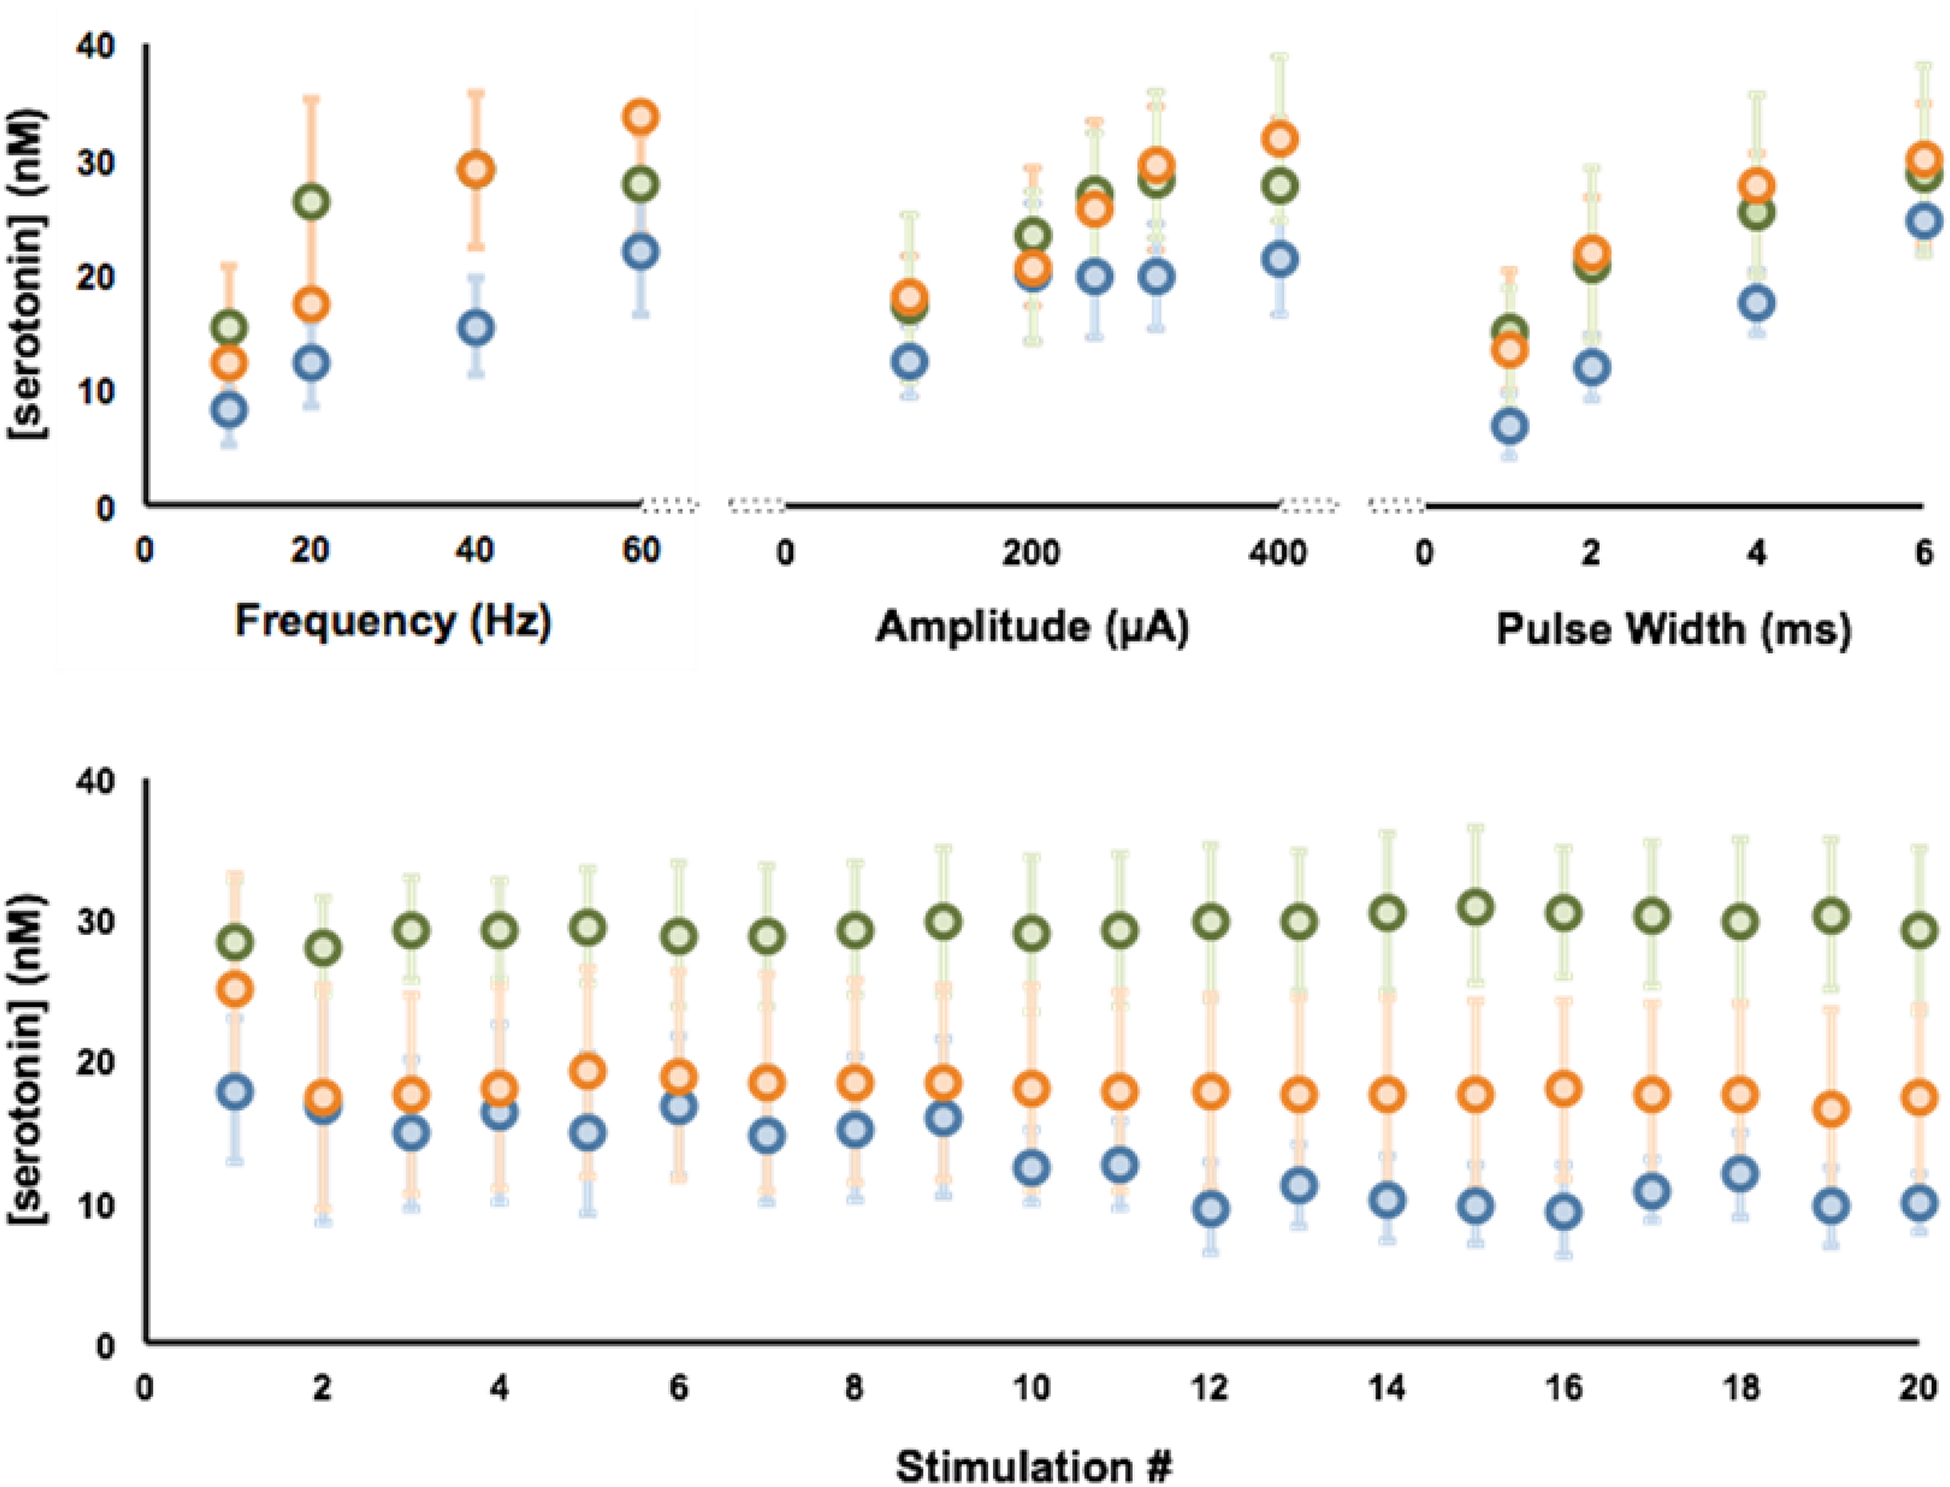
It is important to monitor serotonin neurochemistry in the context of brain disorders. Specifically, a better understanding of biophysical alterations and associated biochemical functionality within subregions of the brain will enable better of understanding of diseases such as depression. Fast voltammetric tools at carbon fiber microelectrodes provide an opportunity to make direct evoked and ambient serotonin measurements in vivo in mice. In this study, we characterize novel stimulation and measurement circuitries for serotonin analyses in brain regions relevant to psychiatric disease. Evoked and ambient serotonin in these brain areas, the CA2 region of the hippocampus and the medial prefrontal cortex, are compared to ambient and evoked serotonin in the substantia nigra pars reticulata, an area well established previously for serotonin measurements with fast voltammetry. Stimulation of a common axonal location evoked serotonin in all three brain regions. Differences are observed in the serotonin release and reuptake profiles between these three brain areas which we hypothesize to arise from tissue physiology heterogeneity around the carbon fiber microelectrodes. We validate this hypothesis mathematically and via confocal imaging. We thereby show that fast voltammetric methods can provide accurate information about local physiology and highlight implications for chemical mapping. Cover Image for this issue: doi: 10.1111/jnc.14739.

Keywords: FSCV; confocal microscopy; hippocampus; medial forebrain bundle; prefrontal cortex; substantia nigra.


Figures

Figure 1.
Figure 1.
In each of the three brain regions (CA2, SNr, mPFC) serotonin measurements were taken using either FSCV or FSCAV. The three main methods, outlined here, led to the collection of evoked control (SNr: n=5, CA2: n=5, mPFC: n=10), evoked stimulation parameter experiments (SNr: n=5, CA2: n=5, mPFC: n=5), and basal (SNr: n=5, CA2: n=5, mPFC: n=5) serotonin measurements, and staining of serotonin axons (SNr: n=1, CA2: n=1, mPFC: n=1) in each of the three regions of interest. (n= number of animals)
Figure 2.
Figure 2.
(i) Representation of a sagittal section of a mouse brain. WE shows the position of the working electrode and STIM shows the stimulating electrode. Green track represents the serotonergic axons that originate in the raphe nucleus and traverse the MFB to innervate different brain regions. (ii) Representative FSCV color plots of the CA2 (A) (n=5), the mPFC (B) (n=5) and (C) (n=5), and the SNr (D) (n=5). The red bar below the color plots denote the stimulation period (2 s) iii) Cyclic voltammograms extracted from the vertical dashed lines in A(ii), B(ii), C(ii), and D(ii) with current on the y-axis and voltage vs. Ag / AgCl on the x-axis. Red and yellow stars on C(ii) denote the two successive oxidation events seen in the mPFC. Cyclic voltammograms extracted at both these positions are seen in C(iii), marked with their respective stars. (n=number of animals)
Figure 3.
Figure 3.
(A) Averaged [Serotonin] – time profiles (n=5 ± SEM) i) CA2, ii) mPFC single peak response, and iii) mPFC double peak response, and iv) SNr. Yellow bars beneath the plot denote the stimulation period (2 s). (B) Thionin stained representative brains displayed on the left with a colored circle denoting the actual placement of the CFM. On the right, yellow lines represent the outlines of the i) CA2 ii) mPFC, and iii) SNr regions. Blue, orange, and green circles denote the placement of the CFM in each individual mouse, for the CA2 (n=5), the SNr (n=5), and the mPFC (n=10), respectively. Coordinates with respect to Bregma are shown to the right of each coronal slice. Region specific coordinates are explained in the methods section. (n=number of animals)
Figure 4.
Figure 4.
Blue, orange and green circles represent the weighted averaged response (n=5 mice each region ± SEM), and faint blue, orange, and green markers represent individual mice responses. Files were collected for 60 mins to obtain a baseline reading. Representative FSCAV color plots and CVs (extracted from vertical dashed lines) are inset, on top left for the CA2, top right for the mPFC, and at the bottom for SNr. Yellow lines on the CV denote the limits of integration. ****p<0.0001.
Figure 5.
Figure 5.
The [Serotonin] vs. time plots display the experimental data (solid) and model curves (dotted) for each region: CA2 (A), mPFC layers 5–6 (B), mPFC layers 1–3 (C), and the SNr (D). The table below outlines the parameters used to generate the model curves for each region.
Figure 6.
Figure 6.
Immunohistochemistry for GFP in serotonin transporter-EGFP BAC transgenic mice reveals serotonin axon density across brain regions (n=1 mouse per region). Top panels: The SERT signal is shown in green with NeuN in cyan in all regions except the prefrontal cortex layer 5 and 6 where NeuN is shown in red. Layers 1–6 are all clearly defined in the prefrontal cortex and the stratum radiatum (Str. Rad.), stratum pyrimidale (Str. Pyr.), and the stratum oriens are labeled in the hippocampus. In the SNr, the red immunofluorescence is signal from an antibody directed against tyrosine hydroxylase, a marker of dopamine neurons. The top panels show single photon confocal micrographs of axonal innervation in the three brain areas. The bottom panels show the green channel alone to allow for the clear comparison of serotonin axon density.
Figure 7.
Figure 7.
Top Panel– Averaged serotonin responses (n=5, ± SEM), CA2 (blue), mPFC (orange) and in the SNr (green) with variation in the stimulation frequency (top left), stimulation amplitude (middle), and stimulation pulse width (top right). Bottom Panel – Average serotonin response (n=5, ±SEM) to a stimulation train for 20 mins at 60 Hz, 4 ms pulse width, and 360μA in the SNr (green), CA2 (blue), and mPFC (orange). (n=number of animals)
Figure 8.
Figure 8.
The averages from each region have been normalized such that the maximum amplitude of each curve is at the horizontal blue dotted line. This allows for simple visual comparison of the reuptake curves.

References

    1. Abdalla A, Atcherley CW, Pathirathna P, Samaranayake S, Qiang B, Pena E, Morgan SL, Heien ML and Hashemi P (2017) In Vivo Ambient Serotonin Measurements at Carbon-Fiber Microelectrodes. Anal Chem 89, 9703–9711. - PMC - PubMed
    1. Abi-Dargham A, Laruelle M, Aghajanian GK, Charney D and Krystal J (1997) The role of serotonin in the pathophysiology and treatment of schizophrenia. J Neuropsychiatry Clin Neurosci 9, 1–17. - PubMed
    1. Bremner JD, Narayan M, Anderson ER, Staib LH, Miller HL and Charney DS (2000) Hippocampal volume reduction in major depression. Am J Psychiatry 157, 115–118. - PubMed
    1. Bremner JD, Vythilingam M, Vermetten E, Nazeer A, Adil J, Khan S, Staib LH and Charney DS (2002) Reduced volume of orbitofrontal cortex in major depression. Biol Psychiatry 51, 273–279. - PubMed
    1. Charan J and Kantharia ND (2013) How to calculate sample size in animal studies? J Pharmacol Pharmacother 4, 303–306. - PMC - PubMed

Publication types

MeSH terms