. 2019 Dec;71(6):1216-1228.
doi: 10.1016/j.jhep.2019.08.005. Epub 2019 Aug 13.

Microbiota-driven gut vascular barrier disruption is a prerequisite for non-alcoholic steatohepatitis development

Affiliations

Microbiota-driven gut vascular barrier disruption is a prerequisite for non-alcoholic steatohepatitis development

Juliette Mouries et al. J Hepatol. 2019 Dec.

Abstract

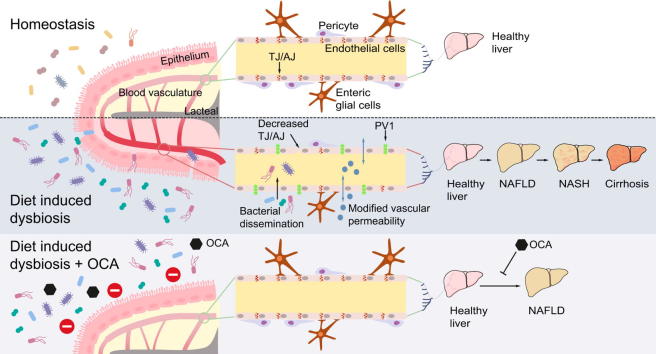
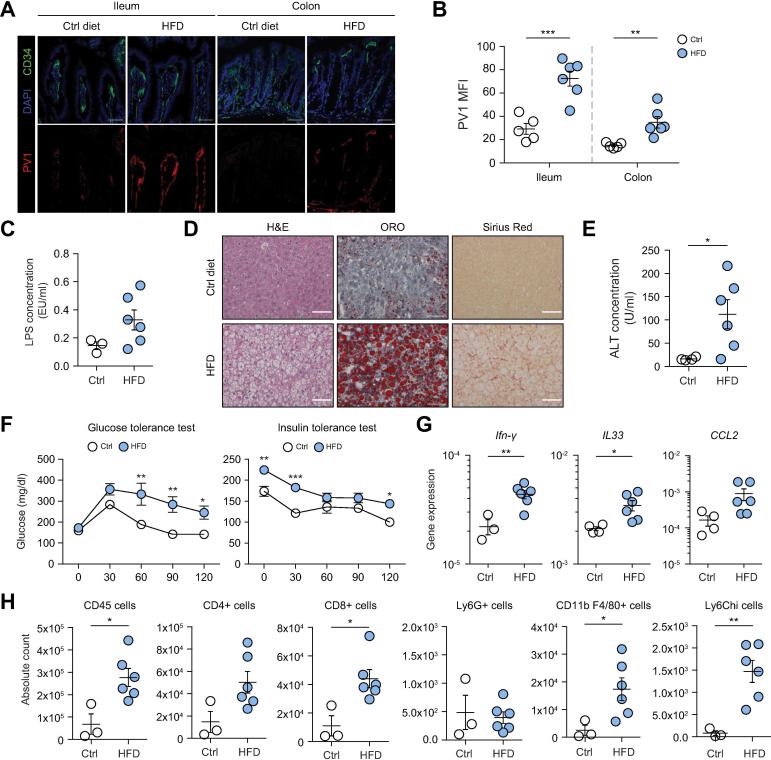
Background & aims: Fatty liver disease, including non-alcoholic fatty liver (NAFLD) and steatohepatitis (NASH), has been associated with increased intestinal barrier permeability and translocation of bacteria or bacterial products into the blood circulation. In this study, we aimed to unravel the role of both intestinal barrier integrity and microbiota in NAFLD/NASH development.

Methods: C57BL/6J mice were fed with high-fat diet (HFD) or methionine-choline-deficient diet for 1 week or longer to recapitulate aspects of NASH (steatosis, inflammation, insulin resistance). Genetic and pharmacological strategies were then used to modulate intestinal barrier integrity.

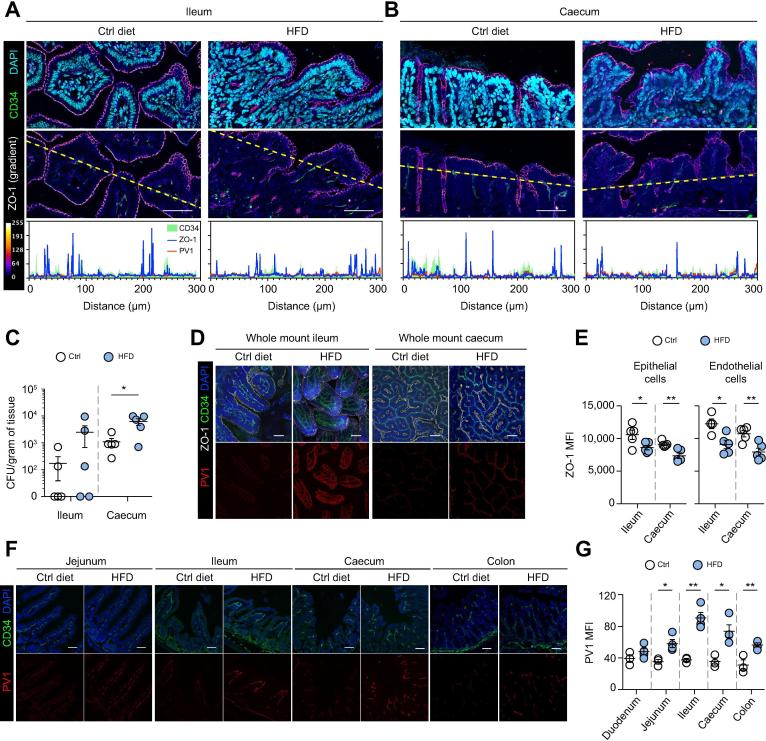
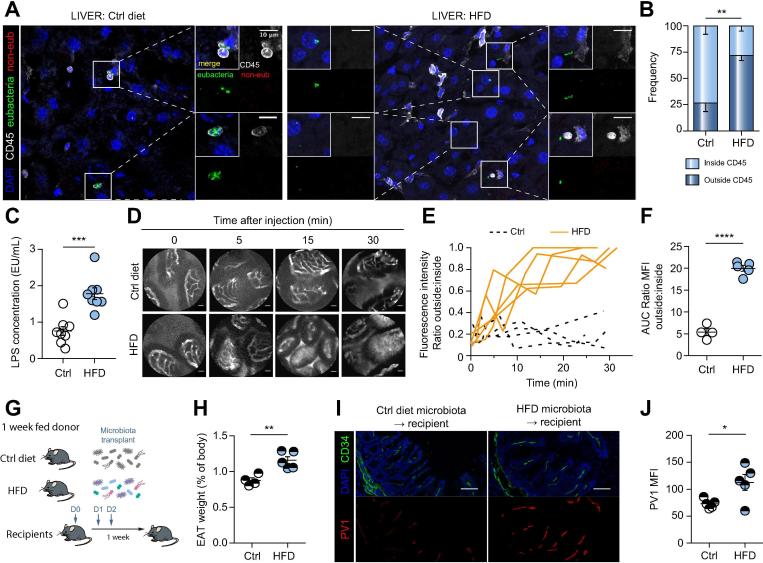
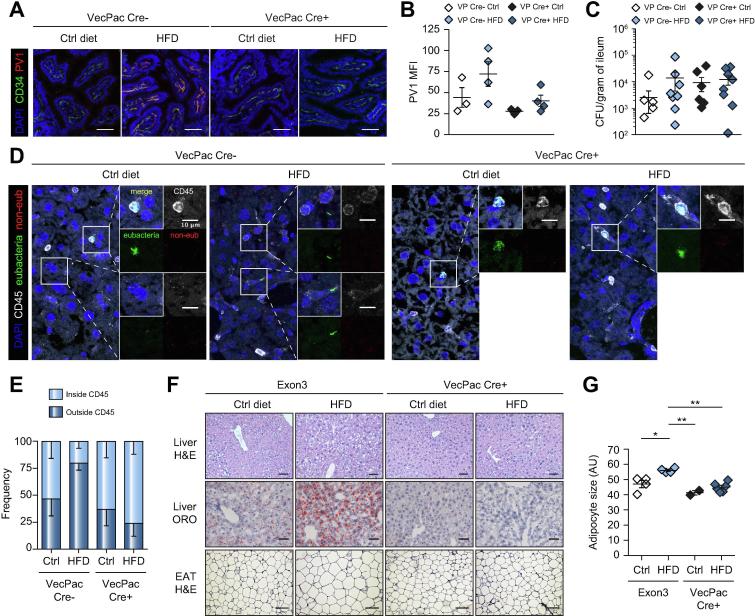
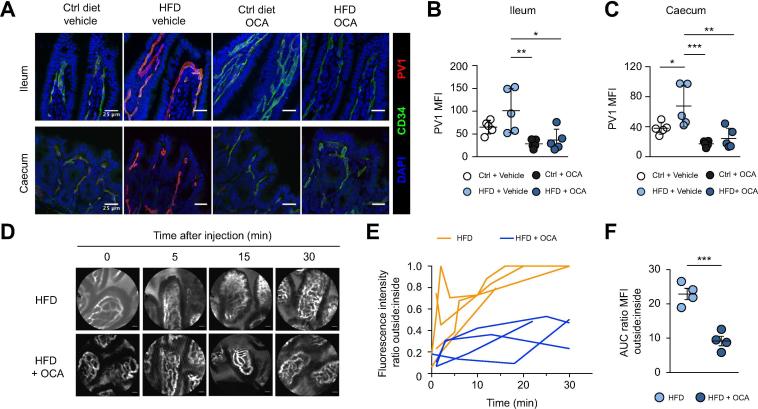
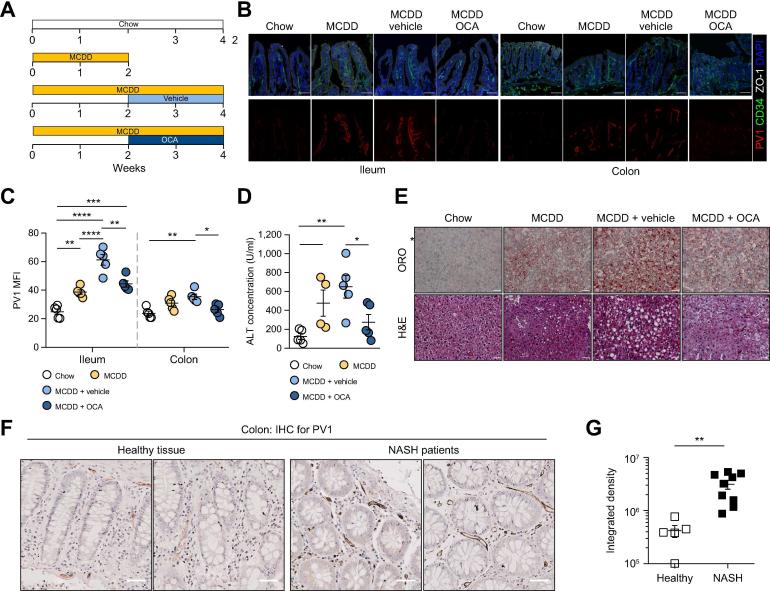
Results: We show that disruption of the intestinal epithelial barrier and gut vascular barrier (GVB) are early events in NASH pathogenesis. Mice fed HFD for only 1 week undergo a diet-induced dysbiosis that drives GVB damage and bacterial translocation into the liver. Fecal microbiota transplantation from HFD-fed mice into specific pathogen-free recipients induces GVB damage and epididymal adipose tissue enlargement. GVB disruption depends on interference with the WNT/β-catenin signaling pathway, as shown by genetic intervention driving β-catenin activation only in endothelial cells, preventing GVB disruption and NASH development. The bile acid analogue and farnesoid X receptor agonist obeticholic acid (OCA) drives β-catenin activation in endothelial cells. Accordingly, pharmacologic intervention with OCA protects against GVB disruption, both as a preventive and therapeutic agent. Importantly, we found upregulation of the GVB leakage marker in the colon of patients with NASH.

Conclusions: We have identified a new player in NASH development, the GVB, whose damage leads to bacteria or bacterial product translocation into the blood circulation. Treatment aimed at restoring β-catenin activation in endothelial cells, such as administration of OCA, protects against GVB damage and NASH development.

Lay summary: The incidence of fatty liver disease is reaching epidemic levels in the USA, with more than 30% of adults having NAFLD (non-alcoholic fatty liver disease), which can progress to more severe non-alcoholic steatohepatitis (NASH). Herein, we show that disruption of the intestinal epithelial barrier and gut vascular barrier are early events in the development of NASH. We show that the drug obeticholic acid protects against barrier disruption and thereby prevents the development of NASH, providing further evidence for its use in the prevention or treatment of NASH.


Figures

None
Graphical abstract
Fig. 1
Fig. 1
One week of HFD feeding is sufficient to induce leakage of the gut vascular barrier. (A–C) Mice were fed with control (Ctrl) diet or HFD for 48 h before their intestines were harvested. (A) Ileum and (B) cecum sections were stained for CD34 (green), PV1 (red), ZO-1 (gradient), and DAPI (cyan) expression. First row shows the merged images. Second row is only showing CD34 and ZO-1 with a gradient (as indicated in the legend), and a dotted line indicating where fluorescent intensity was measured. Scale bar indicates 50 µm. Third row displays the intensity profiles of each marker. CFUs in ileum and cecum were determined, as indicated in C, as described in Materials and methods. (D–G) Intestine from mice fed for 1 week was imaged as (D) whole mount or (F) sections. (E) Cell suspension from cecum and ileum was also analyzed by FACS for ZO-1 expression. (G) Quantification of PV1 was performed on CD34+ area. Scale bar indicates 50 µm. *p <0.05; **p <0.005; unpaired 2-tailed t test. CFUs, colony-forming units; HFD, high-fat diet; MFI, mean fluorescence intensity.
Fig. 2
Fig. 2
Long-term HFD feeding induces GVB disruption and liver inflammation and steatosis. (A–H) Mice were fed with control (Ctrl) diet or HFD for 24 weeks before their intestines and livers were harvested. (A) Ileum and colon sections were stained for CD34 (green), PV1 (red) and DAPI (blue) expression, scale bar indicates 50 µm. (B) Quantification of PV1 MFI was performed on CD34+ area. (C) LPS levels were measured in the serum of Ctrl or HFD-fed mice. (D) Liver sections were analyzed by H&E, ORO or Sirius Red staining, as indicated. Scale bar indicates 100 µm. (E) ALT serum concentration in Ctrl or HFD-fed mice. (F) Glucose tolerance test and insulin tolerance test were performed after 6 h of fasting and intraperitoneal injection of glucose (2 g/kg mouse) and insulin (0.2 IU/kg mouse) respectively. (G) Analysis of gene expression (normalized to PPIA gene) by qPCR in the liver of Ctrl or HFD-fed mice. (H) FACS staining of immune cells in the liver of Ctrl or HFD-fed mice represented as absolute numbers. *p <0.05; **p <0.005; ***p <0.0005; unpaired 2-tailed t test or 2-way ANOVA in panel F. ALT, alanine aminotransferase; GVB, gut-vascular barrier; HFD, high-fat diet; LPS, lipopolysaccharide; MFI, mean fluorescence intensity; ORO, Oil Red O.
Fig. 3
Fig. 3
GVB leakage allows the passage of large molecules and bacteria. (A–F) Mice were fed with control (Ctrl) diet or HFD for 1 week, and (A) liver sections were submitted to eubacteria (green) and non-eub (red) FISH, before CD45 (white) and DAPI (blue) staining. Side images show merged and individual staining of enlarged areas demarcated by squares in the main picture, scale bar indicates 10 µm. (B) Bacteria were enumerated for each mouse, and percentage of bacteria inside or outside CD45+ cells was determined. (C) LPS levels were measured in the serum of 1-week HFD-fed mice. (D–F) One-week-fed mice were injected i.v. with 500 kDa FITC-dextran and imaged by intravital probe-based confocal microscopy. Representative photograms from the endomicroscopy video at indicated time points are shown in C, scale bar indicates 20 µm. Quantification of the fluorescence was measured as described in materials and methods. (E) The fluorescence ratio was plotted over time and (F) the AUC was calculated for each individual mouse. Fecal microbiota transplant of 1-week-fed donors was performed according to the schema in G and as described in materials and methods. Recipients were analyzed 1 week later. (H) Organ and body weight were determined and EAT weight (% of body) was calculated. (I) Cecum was stained for PV1 (red), CD34 (green) and DAPI (blue), scale bar indicates 50 µm. Quantification of PV1 was performed on CD34+ area (j). *p <0.05; **p <0.005; ***p <0.0005; ****p <0.0001 unpaired 2-tailed t test. AUC, area under the curve; EAT, epididymal adipose tissue; FISH, fluorescence in situ hybridization; GVB, gut vascular barrier; HFD, high-fat diet; LPS, lipopolysaccharide; MFI, mean fluorescence intensity.
Fig. 4
Fig. 4
Endothelium-specific gain-of-function mice are resistant to steatosis induction. (A–E) β-catenin gain-of-function mice were fed for 2 days with tamoxifen to induce recombination, before being fed with either Ctrl diet or HFD for 1 week or (F,G) 18 weeks. (A,B) Ileum sections were analyzed for the expression of PV1, scale bar indicates 50 µm; and (C) CFUs were determined. (D,E) Liver sections were submitted to eubacteria (green) and non-eub (red) FISH hybridization before CD45 (white) and DAPI (blue) staining. Side images show merged and individual staining of enlarged areas demarcated by squares in the main picture, scale bar indicates 10 µm. Bacteria were enumerated for each mouse, and (E) the percentage of bacteria inside or outside CD45+ cells was determined. (F) After 18 weeks of feeding, EAT and liver sections were analyzed by H&E or ORO staining, as indicated. First row, liver hematoxylin and eosin staining, scale bar indicates 100 µm; second row, liver ORO staining, scale bar indicates 50 µm; third row EAT hematoxylin and eosin staining, scale bar indicates 50 µm. Adipocyte diameter was measured and displayed in G. *p <0.05; **p <0.005; Bonferroni 1-way ANOVA. CFUs, colony-forming units; EAT, epididymal adipose tissue; FISH, fluorescence in situ hybridization; HFD, high-fat diet; LPS, lipopolysaccharide; MFI, mean fluorescence intensity; ORO, Oil Red O.
Fig. 5
Fig. 5
FXR activation controls GVB tightness. (A–F) Mice were fed with Ctrl diet or HFD supplemented or not with OCA for 1 week. (A–C) Ileum and cecum sections were analyzed for PV1 expression, scale bar indicates 25 µm. (D–F) Alternatively, mice were i.v. injected with 500 kDa FITC-dextran and imaged by intravital probe-based confocal microscopy. Representative photograms from the endomicroscopy video at indicated time points are shown in D, scale bar indicates 20 µm. (E) The outside/inside fluorescence ratio was plotted over time and (F) the AUC was calculated for each individual mouse. *p <0.05; **p <0.005; ***p <0.0005; Bonferroni 1-way ANOVA (B,C). ***p <0.0005; unpaired 2-tailed t test (F). AUC, area under the curve; GVB, gut vascular barrier; HFD, high-fat diet; LPS, lipopolysaccharide; MFI, mean fluorescence intensity; OCA, obeticholic acid.
Fig. 6
Fig. 6
Obeticholic acid treatment ameliorates the GVB and liver damage in MCDD model. (A) Mice were fed with chow diet or MCDD for 2 weeks before OCA or its vehicle was administered. (B) Ileum and colon sections were stained for CD34 (green), PV1 (red), ZO-1 (white), and DAPI (blue) expression, scale bar indicates 50 µm. (C) Quantification of PV1 MFI was performed on CD34+ area. (D) Measurement of ALT concentration in the serum of mice fed with chow or MCDD and treated or not with OCA. (E) Liver sections were analyzed by H&E or ORO staining, as indicated. Scale bar indicates 100 µm. (F) Healthy tissue or colon from patients with NASH were stained for PV1, scale bar indicates 50 µm. (G) PV1 staining was quantified for both groups. *p <0.05; **p <0.005; ***p <0.0005; ****p <0.0001; unpaired 2-tailed t test or 1-way ANOVA in panel C. ALT, alanine aminotransferase; GVB, gut vascular barrier; MCDD, methionine-choline-deficient diet; MFI, mean fluorescence intensity; NASH, non-alcoholic steatohepatitis; OCA, obeticholic acid; ORO, Oil Red O.

References

    1. Tanaka N., Aoyama T., Kimura S., Gonzalez F.J. Targeting nuclear receptors for the treatment of fatty liver disease. Pharmacol Ther. 2017;179:142–157. - PMC - PubMed
    1. Cohen J.C., Horton J.D., Hobbs H.H. Human fatty liver disease: old questions and new insights. Science. 2011;332:1519–1523. - PMC - PubMed
    1. Caligiuri A., Gentilini A., Marra F. Molecular pathogenesis of NASH. Int J Mol Sci. 2016;17:1575. - PMC - PubMed
    1. Tilg H., Moschen A.R. Evolution of inflammation in nonalcoholic fatty liver disease: the multiple parallel hits hypothesis. Hepatology. 2010;52:1836–1846. - PubMed
    1. Suzuki A., Diehl A.M. Nonalcoholic steatohepatitis. Annu Rev Med. 2017;68:85–98. - PubMed

Publication types

MeSH terms