. 2019 Nov 4;216(11):2602-2618.
doi: 10.1084/jem.20190679. Epub 2019 Aug 16.

The Nlrp6 inflammasome is not required for baseline colonic inner mucus layer formation or function

Affiliations

The Nlrp6 inflammasome is not required for baseline colonic inner mucus layer formation or function

Joana K Volk et al. J Exp Med. .

Abstract

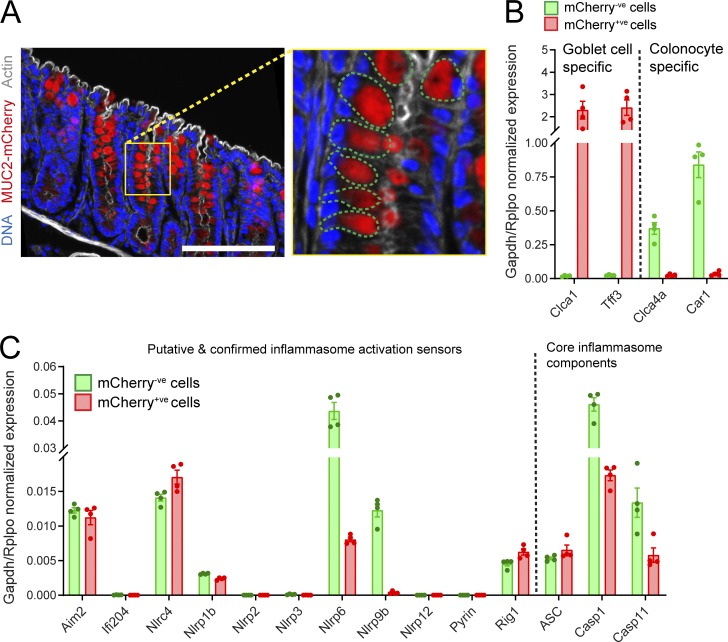
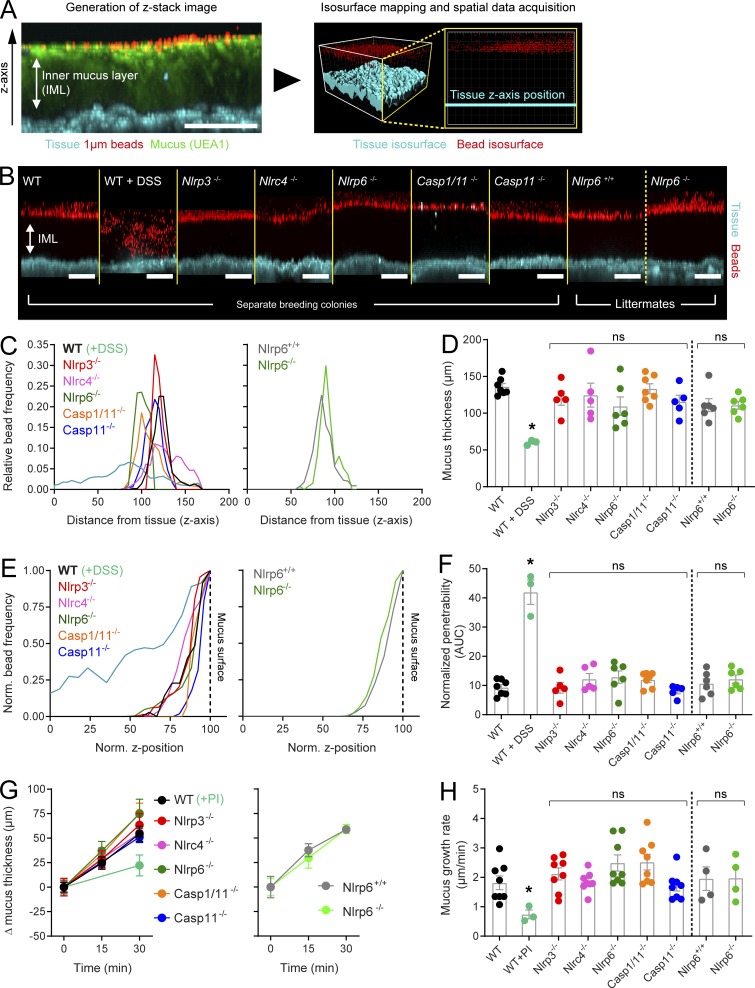
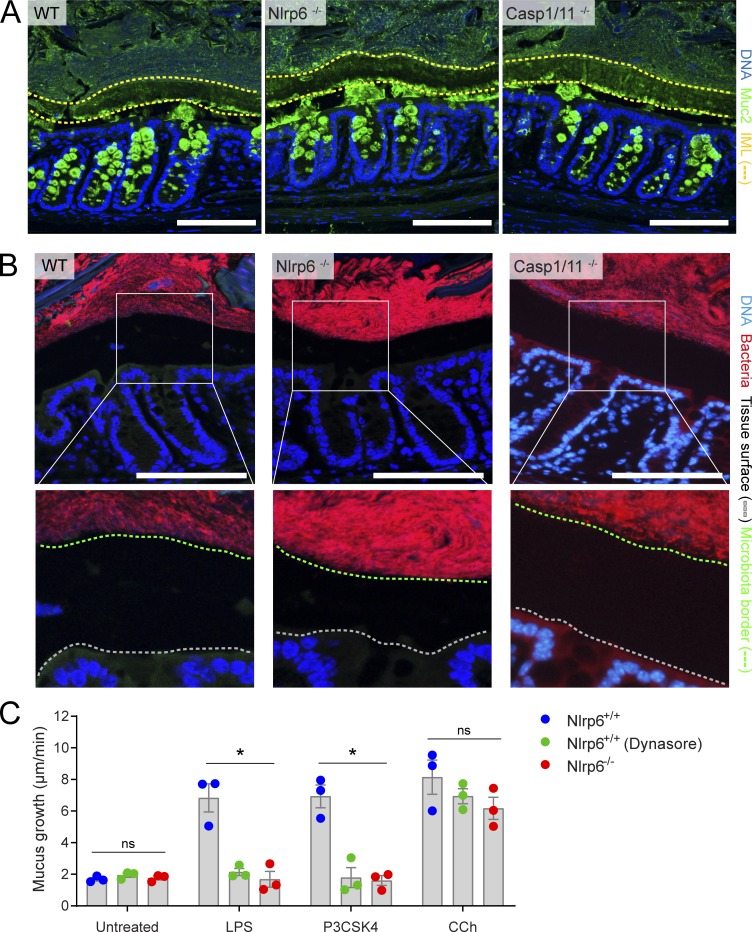
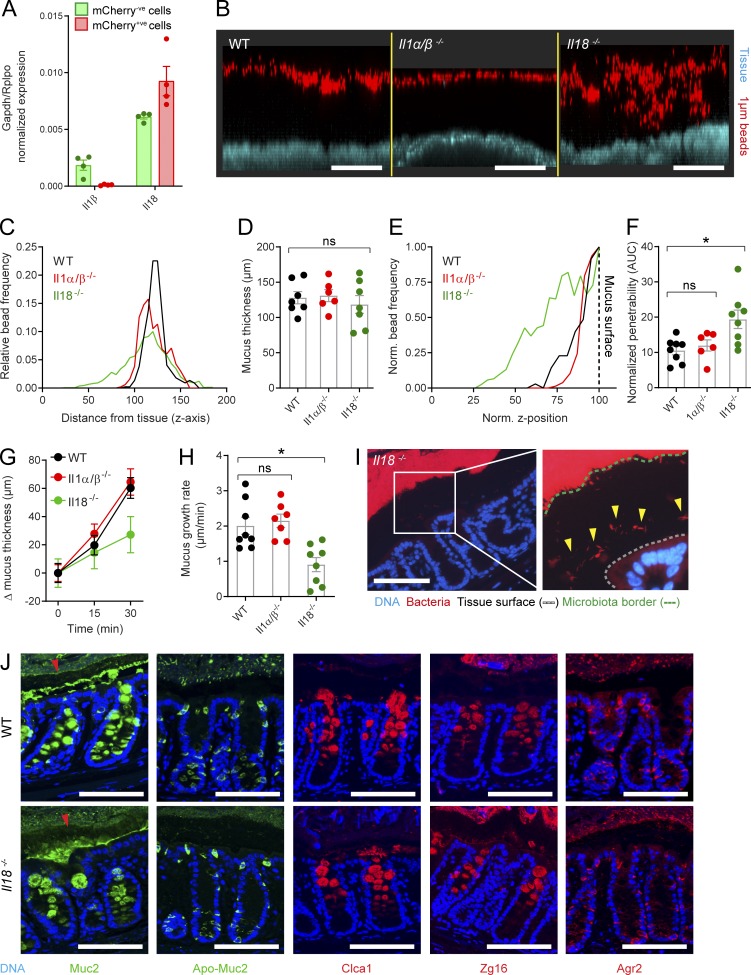
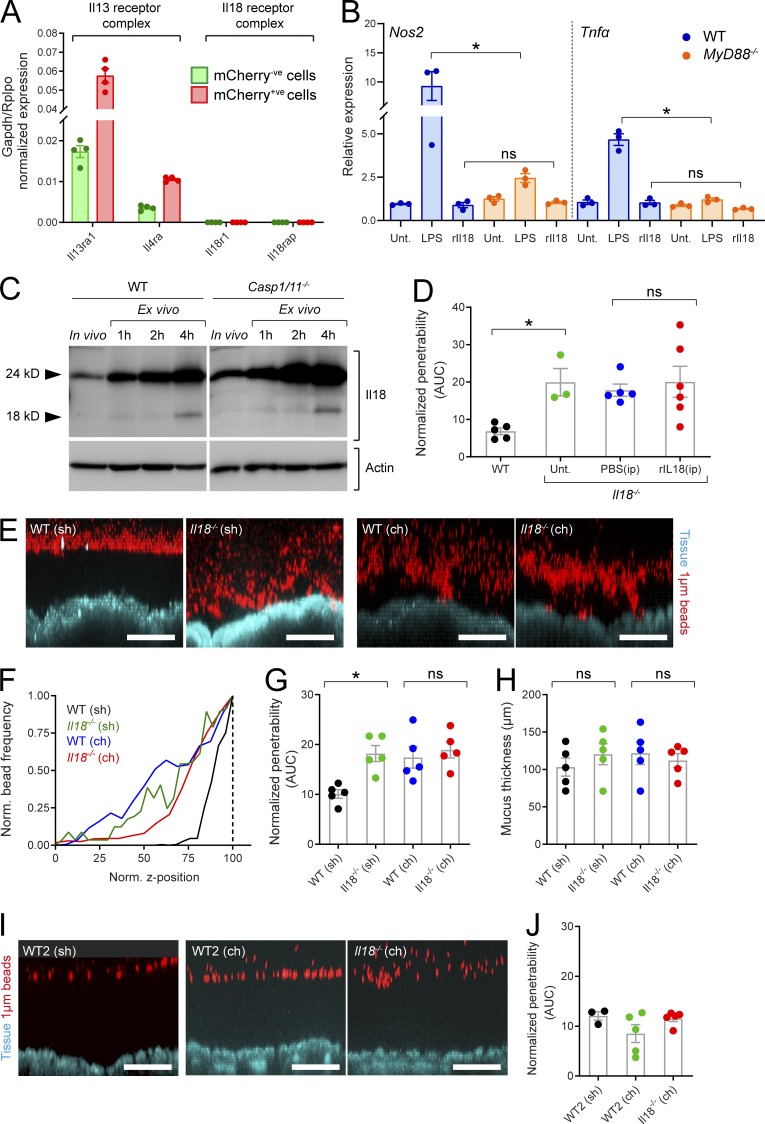
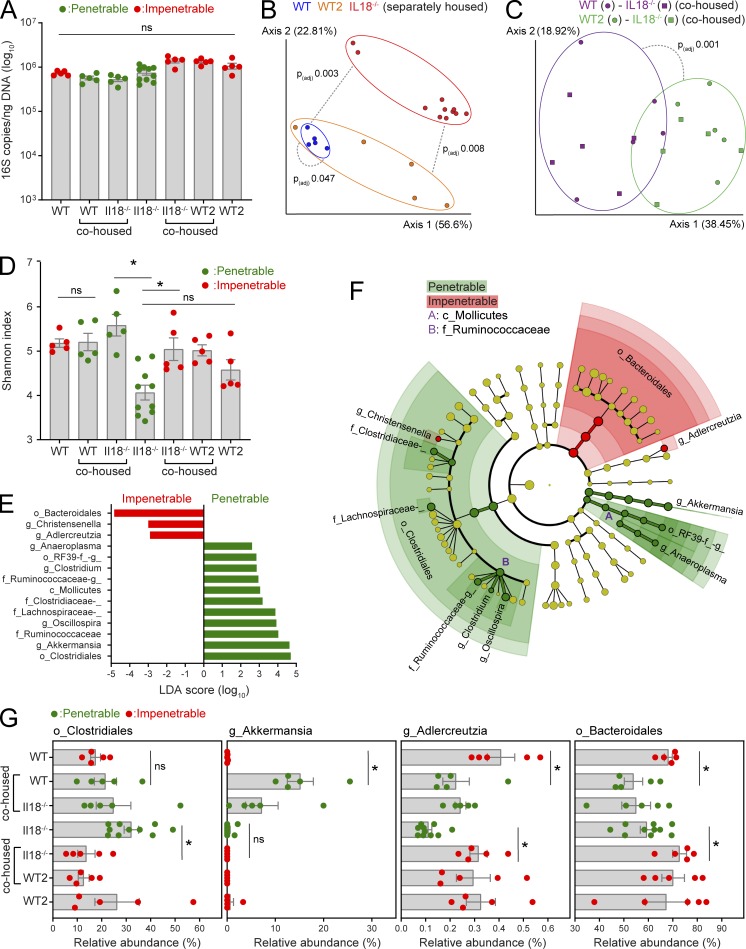
The inner mucus layer (IML) is a critical barrier that protects the colonic epithelium from luminal threats and inflammatory bowel disease. Innate immune signaling is thought to regulate IML formation via goblet cell Nlrp6 inflammasome activity that controls secretion of the mucus structural component Muc2. We report that isolated colonic goblet cells express components of several inflammasomes; however, analysis of IML properties in multiple inflammasome-deficient mice, including littermate-controlled Nlrp6-/- , detect a functional IML barrier in all strains. Analysis of mice lacking inflammasome substrate cytokines identifies a defective IML in Il18-/- mice, but this phenotype is ultimately traced to a microbiota-driven, Il18-independent effect. Analysis of phenotypic transfer between IML-deficient and IML-intact mice finds that the Bacteroidales family S24-7 (Muribaculaceae) and genus Adlercrutzia consistently positively covary with IML barrier function. Together, our results demonstrate that baseline IML formation and function is independent of inflammasome activity and highlights the role of the microbiota in determining IML barrier function.


Figures

Figure 1.
Figure 1.
Inflammasome expression in the distal colonic epithelium. (A) Confocal micrograph of cryosection from RedMUC298trTg distal colon; magnified upper crypt (yellow box) highlighting individual goblet cells (green dashed lines), DNA (blue), mCherry-MUC2 (red), and actin (gray). Scale bar, 100 μm. (B) Expression of goblet cell or colonocyte-specific genes detected by qRT-PCR of sorted epithelial cell RNA; goblet cells/mCherry+ve (red) and remaining epithelial cells/mCherry−ve (green). (C) Expression of inflammasome components detected in sorted epithelial cells; error bars represent SEM of qRT-PCR data from n = 4 animals. All data are pooled from four independent experiments (one animal per experiment).
Figure 2.
Figure 2.
Ex vivo analysis of IML formation and function in inflammasome-deficient mice. (A) Ex vivo data acquisition; confocal z-stack acquired in ex vivo WT distal colon tissue showing x/z-axis cross section through the IML (left panel): tissue (blue), 1-µm beads (red), UEA-1 stained mucus (green). Isosurfaces mapped to fluorescent signal from tissue and beads (right panel) allowing spatial data collection: tissue isosurface (blue), bead isosurfaces (red). (B) Representative confocal z-stacks acquired in WT, DSS-treated, and different inflammasome knockout colonic tissue; mice from separate breeding colonies and littermates are indicated; tissue (blue), 1-µm beads (red). (C) Representative bead spatial data plots generated from z-stacks shown in B; left graph, separate breeding colony mice; right graph, littermated mice. (D) Quantification of IML thickness based on data shown in C; the dashed line separates data from separate breeding colony and littermated mice. (E) Representative normalized bead spatial data plots of separate breeding colony mice (left graph) and littermated mice (right graph); the normalized z-axis position corresponding to the mucus surface is indicated (dashed line). (F) Quantification of IML penetrability based on data shown in E; the dashed line separates data from separate breeding colony and littermated mice. (G) Mucus growth curves over 30-min ex vivo incubation in tissue from WT, protease inhibitor (PI)–treated, and different inflammasome knockout colonic tissue; left graph, separate breeding colony mice; right graph, littermated mice. (H) Mucus growth rates calculated from data shown in G. (D and F–H) Error bars are SEM of n = 3–8 animals as indicated; ns, not significant; *, P < 0.05, significance determined by Kruskal–Wallis and uncorrected Dunn’s multiple comparison. Scale bars, 100 µm. All data pooled from two independent experiments (three or four animals per experiment). AUC, area under the curve.
Figure 3.
Figure 3.
In vivo IML formation and ex vivo senGC secretory responses. (A) Micrographs of tissue sections from WT, Nlrp6−/−, and Casp1/11−/− distal colon stained to detect Muc2; DNA (blue), Muc2 (green), IML (yellow dashed lines). (B) Micrographs of the same tissues shown in A stained to detect bacterial 16S by FISH, with magnified images highlighting bacterial separation from epithelium (white boxes); DNA (blue), bacteria (red), epithelial tissue surface (gray dashed line), microbiota border (green dashed line). Scale bars, 100 µm. (C) Mucus growth rates in Nlrp6+/+ (with or without Dynasore inhibitor) and Nlrp6−/− littermate distal colon after induction of senGC-dependent (LPS and P3CSK4) or senGC-independent (carbachol [CCh]) secretory responses. Error bars represent SEM of n = 3 animals/group; *, P < 0.05, significance determined by two-way ANOVA and Dunnet’s multiple comparison. Images in A and B are representative of three independent experiments; data in C are representative of two independent experiments (three animals per experiment). ns, not significant.
Figure 4.
Figure 4.
Ex vivo/in vivo analysis of IML function in mice lacking inflammasome substrate cytokines. (A) Expression of inflammasome substrate cytokines detected by qRT-PCR of FACS-sorted goblet cells/mCherry+ve (red) and remaining epithelial cells/mCherry-ve (green) isolated from RedMUC298trTg distal colon (Fig. 1, A and B). (B) Representative confocal z-stacks showing x/z-axis cross sections through the IML of WT, Il1αβ−/−, and Il18−/− colonic tissue; tissue (blue), 1-µm beads (red). (C) Representative bead spatial data plots generated from z-stacks shown in B. (D) Quantification of IML thickness based on data shown in C. (E) Representative normalized bead spatial data plots; normalized z-axis position corresponding to the mucus surface is indicated (dashed line). (F) Quantification of IML penetrability based on data shown in E. (G) Mucus growth curves over 30-min ex vivo incubation in WT, Il1αβ−/−, and Il18−/− colonic tissue. (H) Mucus growth rates calculated from data shown in G. (I) Micrographs of tissue sections from Il18−/− distal colon stained to detect bacterial 16S by FISH; magnified images highlighting bacterial proximity to the epithelium (white box); DNA (blue), bacteria (red), epithelial tissue surface (gray dashed line), microbiota border (green dashed line), bacteria penetrating into IML (yellow arrows). (J) Micrographs of tissue sections from WT and Il18−/− distal colon stained to detect Muc2 and Apo-Muc2 (green) and Clca1, Zg16, and Agr2 (red); secreted Muc2 forming the IML is indicated (arrowheads). Error bars represent SEM of n = 4 (A) or n = 8 (D, F, G, and H) animals; ns, not significant; *, P < 0.05 significance determined by Kruskal–Wallis and uncorrected Dunn’s multiple comparison. Scale bars, 100 µm. Data in A are pooled from four independent experiments (one animal per experiment); data in C–H are pooled from two independent experiments (three or four animals per experiment); images in B, I, and J are representative of two independent experiments (three or four animals per experiment). AUC, area under the curve.
Figure 5.
Figure 5.
Analysis of factors contributing to the IML phenotype in Il18−/− mice. (A) Expression of Il13 and Il18 receptor complex components detected by qRT-PCR of FACS-sorted goblet cells/mCherry+ve (red) and remaining epithelial cells/mCherry-ve (green) isolated from RedMUC298trTg distal colon (Fig. 1, A and B). (B) Relative expression of Nos2 and Tnfα in WT and MyD88−/− colonic organoids treated with LPS or rIl18 quantified by qRT-PCR; all data relative to untreated (Unt.) control samples. (C) Western blots of SDS-PAGE resolved protein extracted from WT or Casp1/11−/− fresh (in vivo) distal colonic tissue or tissue incubated for 1, 2, or 4 h ex vivo; anti-Il18 (upper blot), anti-actin (lower blot). (D) Quantification of IML penetrability (D) in tissue from WT and Il18−/− mice with or without intraperitoneal (ip) treatment with rIl18 or PBS. (E) Representative confocal z-stacks showing x/z-axis cross sections through the IML of tissue obtained from separately housed (sh) or cohoused (ch) WT and Il18−/− mice; tissue (blue), 1-µm beads (red). (F) Representative normalized bead spatial data plots generated from z-stacks shown in E; normalized z-axis position corresponding to the mucus surface is indicated (dashed line). (G) Quantification of IML penetrability based on data shown in D. (H) Quantification of IML thickness based on bead spatial data acquired from z-stacks shown in C. (I) Representative confocal z-stacks showing x/z-axis cross sections through the IML of tissue obtained from separately housed (sh) or cohoused (ch) WT colony 2 (WT2) and Il18−/− mice; tissue (blue), 1-µm beads (red). (J) Quantification of IML penetrability based on normalized bead spatial data acquired from z-stacks shown in G. Error bars are SEM of n = 4 (A) or n = 3–5 (C, D, G, H, and J) animals or organoid cultures as indicated; ns, not significant; *, P < 0.05, significance determined by Kruskal–Wallis and uncorrected Dunn’s multiple comparison. Scale bars, 100 µm. Data in A are pooled from four independent experiments (one animal per experiment); data in B are pooled from three independent experiments (one culture per experiment); images in C representative of two independent experiments (two animals per experiment); data in D, F–H, and J are pooled from two independent experiments (two or three animals per experiment); images in E and I are representative of two independent experiments (two or three animals per experiment). AUC, area under the curve.
Figure 6.
Figure 6.
Microbiota profiling in mice with divergent IML phenotypes. Total bacterial load and relative abundance of bacterial taxa were determined by analysis of 16S rRNA genes in fecal DNA extractions from separately housed and cohoused WT, WT2, and Il18−/− mice with a penetrable (red) or impenetrable (green) IML phenotype. (A) Quantification of total bacterial 16S rRNA gene copy number by qPCR. ns, not significant. (B and C) Principal component analysis of β-diversity (weighted UniFrac) from bacterial communities in separately housed (B) or cohoused (C) mice. (D) α-diversity (Shannon index) of bacterial communities. ns, not significant. (E) Linear discriminant analysis (LDA) effect size identification of bacterial taxa cosegregating with IML phenotype. (F) Cladogram highlighting taxa identified in E. (G) Relative abundance of specific taxa identified by LEfSe in different experimental groups. (A, D, and G) Error bars represent SEM of n = 5–10 mice; *, P < 0.05, significance determined by Kruskal–Wallis and uncorrected Dunn’s multiple comparison. (B and C) Dashed lines indicate statistical comparisons between groups, analysis is described in experimental procedures. All data are pooled from two independent experiments (five animals per experiment).

References

    1. Bergstrom K.S., Kissoon-Singh V., Gibson D.L., Ma C., Montero M., Sham H.P., Ryz N., Huang T., Velcich A., Finlay B.B., et al. . 2010. Muc2 protects against lethal infectious colitis by disassociating pathogenic and commensal bacteria from the colonic mucosa. PLoS Pathog. 6:e1000902 10.1371/journal.ppat.1000902 - DOI - PMC - PubMed
    1. Bergstrom K., Fu J., Johansson M.E., Liu X., Gao N., Wu Q., Song J., McDaniel J.M., McGee S., Chen W., et al. . 2017. Core 1- and 3-derived O-glycans collectively maintain the colonic mucus barrier and protect against spontaneous colitis in mice. Mucosal Immunol. 10:91–103. 10.1038/mi.2016.45 - DOI - PMC - PubMed
    1. Bergström J.H., Berg K.A., Rodríguez-Piñeiro A.M., Stecher B., Johansson M.E., and Hansson G.C.. 2014. AGR2, an endoplasmic reticulum protein, is secreted into the gastrointestinal mucus. PLoS One. 9:e104186 10.1371/journal.pone.0104186 - DOI - PMC - PubMed
    1. Bergström J.H., Birchenough G.M., Katona G., Schroeder B.O., Schütte A., Ermund A., Johansson M.E., and Hansson G.C.. 2016. Gram-positive bacteria are held at a distance in the colon mucus by the lectin-like protein ZG16. Proc. Natl. Acad. Sci. USA. 113:13833–13838. 10.1073/pnas.1611400113 - DOI - PMC - PubMed
    1. Birchenough G.M., Nyström E.E., Johansson M.E., and Hansson G.C.. 2016. A sentinel goblet cell guards the colonic crypt by triggering Nlrp6-dependent Muc2 secretion. Science. 352:1535–1542. 10.1126/science.aaf7419 - DOI - PMC - PubMed

Publication types

MeSH terms