. 2019 Sep 3;116(36):17970-17979.
doi: 10.1073/pnas.1906512116. Epub 2019 Aug 16.

Diverse repertoire of human adipocyte subtypes develops from transcriptionally distinct mesenchymal progenitor cells

Affiliations

Diverse repertoire of human adipocyte subtypes develops from transcriptionally distinct mesenchymal progenitor cells

So Yun Min et al. Proc Natl Acad Sci U S A. .

Abstract

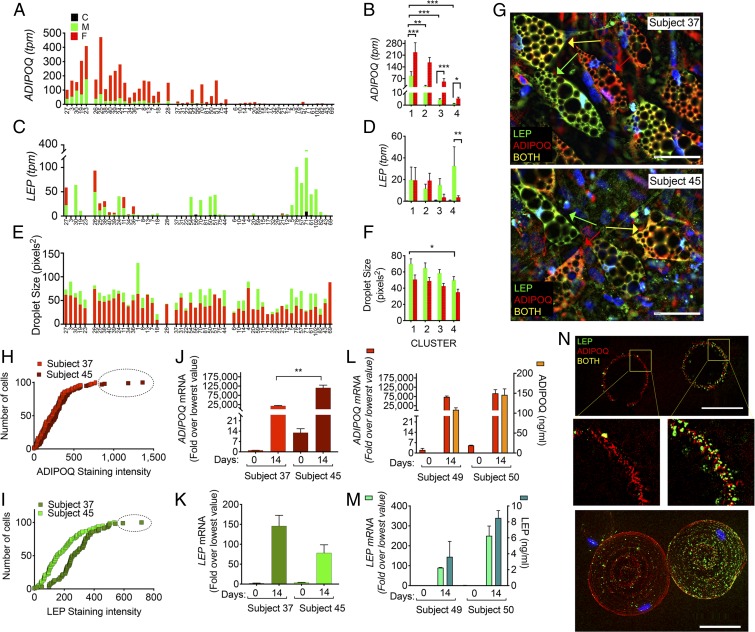
Single-cell sequencing technologies have revealed an unexpectedly broad repertoire of cells required to mediate complex functions in multicellular organisms. Despite the multiple roles of adipose tissue in maintaining systemic metabolic homeostasis, adipocytes are thought to be largely homogenous with only 2 major subtypes recognized in humans so far. Here we report the existence and characteristics of 4 distinct human adipocyte subtypes, and of their respective mesenchymal progenitors. The phenotypes of these distinct adipocyte subtypes are differentially associated with key adipose tissue functions, including thermogenesis, lipid storage, and adipokine secretion. The transcriptomic signature of "brite/beige" thermogenic adipocytes reveals mechanisms for iron accumulation and protection from oxidative stress, necessary for mitochondrial biogenesis and respiration upon activation. Importantly, this signature is enriched in human supraclavicular adipose tissue, confirming that these cells comprise thermogenic depots in vivo, and explain previous findings of a rate-limiting role of iron in adipose tissue browning. The mesenchymal progenitors that give rise to beige/brite adipocytes express a unique set of cytokines and transcriptional regulators involved in immune cell modulation of adipose tissue browning. Unexpectedly, we also find adipocyte subtypes specialized for high-level expression of the adipokines adiponectin or leptin, associated with distinct transcription factors previously implicated in adipocyte differentiation. The finding of a broad adipocyte repertoire derived from a distinct set of mesenchymal progenitors, and of the transcriptional regulators that can control their development, provides a framework for understanding human adipose tissue function and role in metabolic disease.

Keywords: adipocyte differentiation; brown adipocyte; human adipose tissue; mesenchymal stem cells; progenitor cells.


Conflict of interest statement

The authors declare no conflict of interest.

Figures

Fig. 1.
Fig. 1.
Single mesenchymal progenitors give rise to morphologically different adipocyte subtypes. (A) Mesenchymal progenitor cells from adipose tissue are induced to proliferate under proangiogenic conditions in a 3D hydrogel. Single cells are plated into single wells of 384-well multiwell plates, and proliferation allowed until near confluence, when they are split 1:3. One well is maintained in a nondifferentiated state (C), 2 wells are subjected to adipose differentiation (M), and 1 of the differentiate wells is stimulated with Fsk for the final 3 d of culture (F). Wells are then imaged and RNA extracted. (B) Example of a clone that failed to undergo adipose differentiation. (C) Example of a clone that underwent adipocyte differentiation but was unresponsive to Fsk as assessed by lipid droplet size. (D) Example of a clone that underwent adipocyte differentiation and responded to Fsk with decrease in lipid droplet size. (Scale bars: A, 200 μm; BD, 50 μm and enlargements, 100 μm.) (E) Frequency distribution of all lipid droplets measured in all clones in the M state. (F) Frequency distribution of the mean droplet size per clone. (G) Measurement of mean droplet sizes per clone comparing M and F states. (H) Frequency distribution of responsiveness to Fsk, where mean lipid droplet size is expressed as percent of droplet size in M for each clone.
Fig. 2.
Fig. 2.
Identification of thermogenic adipocytes within distinct adipocyte subtypes. (A) Principal component analysis of 52 clones in the C, M, or F states in black, green, and red symbols, respectively. (B) Unsupervised hierarchical clustering of 447 genes correlated with lipid-droplet size. Each row is independently scaled from blue (lower) to red (higher) values. (C and D) Transcripts per million (TPM) values for PPARG in each clone (C) and mean and SEM of TPM values in each cluster (D) in the C, M, and F states. Statistical comparison was done using 1-way ANOVA controlling for multiple comparison testing with the Holm–Sidak method. *P = 0.014; ***P < 0.0006; ****P < 0.0001. (E) RT-PCR of thermogenic genes at different times of exposure of heterogeneous adipocyte cultures to Fsk. Ct values for UCP1 were 29 to 31 at t = 0 and decreased to 20 to 22 at t = 6 h. Values represent fold relative to the lowest value. Shown are means and SEM of 2 independent experiments using cells from 2 independent subjects assayed in duplicate. (F) Immunofluorescence staining to mitochondrial Hsp70 (red) and UCP1 (green) without or with exposure to Fsk for 7 d. (Scale bars, 200 μm.) (GI) Mean and SEM of TPM values from each cluster for the genes indicated in the y axis. Statistical comparison was done as described in D. In G, **P = 0.0097; in H, **P = 0.0067, ****P < 0.0001. (JL) Volcano plot (J) and enrichment analysis (K and L) of differential expression comparing cluster 2 with all other clusters. (M) Hierarchical clustering of 1,175 genes showing the highest variance within adipocytes from neck (NeckSQ) or abdominal (AbdSQ) subcutaneous depots. (N) Values for genes indicated in the x axis in adipocytes from NeckSQ and AbdSQ. Red and green color text indicates genes decreased or increased, respectively in cluster 2 relative to other clusters. Red downward arrows and green upward arrows indicate whether the gene is decreased or increased respectively in NeckSQ relative to AbdSQ.
Fig. 3.
Fig. 3.
Functional differences in lipid-droplet dynamics in the brite/beige adipocyte subtype. (A) Concentration-dependent release of glycerol into the medium by adipocytes incubated with Fsk for 24 h. (B) Lipid droplets visualized in the same field after the indicated times in the presence of Fsk. Arrowhead points to an adipocyte refractory to Fsk containing a large lipid droplet, and arrows to adipocytes containing small multilocular droplets developing in response to Fsk. (C) PLIN1 staining of adipocytes incubated without (Upper) or with (Lower) Fsk for 7 d. Arrowhead points to an adipocyte refractory to Fsk containing a large lipid droplet, and arrows to adipocytes containing small multilocular droplets developing in response to Fsk. (Scale bars, 100 μm.) (D and E) TPM values for LINC00473 in each clone (D) and mean and SEM of TPM values in each cluster (E) in the M state. Statistical comparison was done using 1-way ANOVA controlling for multiple comparison testing with the Holm–Sidak method. (F) PLIN1 staining (red) following in situ hybridization of LINC00473 (green) in adipocytes stimulated with 10 μM Fsk for 6 h. (Scale bar, 50 μm.) (G) Mean number of LINC00473 spots in cells in 10 independent fields; LINC+ cells were defined as those with more than 10 spots. (H) Mean droplet size in LINC and LINC+ cells. Means and SEM are indicated. Statistical significance of differences between LINC and LINC+ were calculated using the Wilcoxon matched-pairs signed rank test as implemented in Prism 8.
Fig. 4.
Fig. 4.
Features of progenitor cells that give rise to the brite/beige adipocyte subtype. (A) Volcano plot of differential expression analysis comparing progenitors corresponding to cluster 2 with all others. (B) KEGG pathway analysis of genes underrepresented in cluster 2. (C) KEGG pathway analysis of genes overrepresented in cluster 2. (DH) Mean and SEM of TPM values from each cluster for the genes indicated in the y axis. Statistical comparison between each column was done using 1-way ANOVA with correction for multiple comparisons using the Holm–Sidak method as implemented in GraphPad Prism 7. *P < 0.05, **P < 0.01, ***P < 0.001, ****P < 0.0001.
Fig. 5.
Fig. 5.
Evidence for adipocyte subtypes specialized for ADIPOQ and LEP expression. (AF) TPM values for ADIPOQ (A) and LEP (C), and droplet-size values (E) in each clone, separated by clusters as indicate below the x axis. Black, green, and red bars represent values in the C, M, and F states, respectively. Mean and SEM of TPM values for ADIPOQ (B) and LEP (D) and droplet-size values (F) in each cluster in the C, M, and F states. Statistical comparison between columns was done using 1-way ANOVA with correction for multiple comparisons using the Holm–Sidak method as implemented in GraphPad Prism 7. *P < 0.05, **P < 0.01, ***P < 0.001. (G) Immunofluorescence staining of adipocytes from 2 individuals (subjects 37 and 45) after 14 d of differentiation. Arrows indicate adipocytes expressing mostly leptin (green), mostly adiponectin (red), or both (yellow). (Scale bars, 100 μm.) (H and I) Cumulative frequency distribution of staining intensities per cell for ADIPOQ (H) or LEP (I) from 100 cells in fields exemplified in G. (J and K) qRT-PCR for ADIPOQ (J) or LEP (K) in cultures exemplified in G, before or after 14 d of differentiation. Values are expressed as fold-difference relative to the lowest detectable value for each gene. **P < 0.001. (L and M) qRT-PCR for ADIPOQ (L, left y axis) or LEP (M, left y axis), and corresponding concentration of ADIPOQ (L, right axis) and LEP (M, right axis) in medium after 24 h of culture. Values represent the mean and SEM of 2 independent cultures assayed in duplicate for each subject. (N) Immunofluorescence staining of primary human adipocytes isolated by collagenase digestion. The single field shown includes 2 cells, 1 mostly expressing LEP (green) and the other ADIPOQ (red). (Scale bars: single optical section and projection, 100 μm.) Top and Middle are a single optical plane through the cells, and Bottom is the projection of all optical planes comprising the 3D volume of the cells. Nuclei are stained in blue.
Fig. 6.
Fig. 6.
Adipocyte subtypes specialized for ADIPOQ and LEP expression differ in metabolic and transcription factor gene expression. (A) Volcano plot comparing cluster 1 and cluster 4. Orange and blue symbols are genes enriched in cluster 1 or cluster 4, respectively. (B and C) KEGG pathway enrichment of enriched genes in cluster 1 or cluster 4, respectively. (DI) Correlation of transcription factors showing highest correlation with ADIPOQ, indicated in the y axis, with ADIPOQ (DF) or LEP (GI). (JM) Correlation of transcription factors showing highest correlation with LEP, indicated in the y axis, with LEP (J and K) or ADIPOQ (L and M).
Fig. 7.
Fig. 7.
Models derived from clustering and functional data. (A) Model for mechanism by which cytokine secretion by progenitors of beige/brite adipocytes create an immunological niche conductive to thermogenesis, different from that created by nonthermogenic adipocyte progenitor subtypes. (B) Model for mechanisms of regulation of adipokine levels, by modulating expression levels in all cells (Left), or by modulating the number of cells expressing each adipokine (Right).

References

    1. Kusminski C. M., Bickel P. E., Scherer P. E., Targeting adipose tissue in the treatment of obesity-associated diabetes. Nat. Rev. Drug Discov. 15, 639–660 (2016). - PubMed
    1. Nedergaard J., Cannon B., Brown adipose tissue as a heat-producing thermoeffector. Handb. Clin. Neurol. 156, 137–152 (2018). - PubMed
    1. Zwick R. K., Guerrero-Juarez C. F., Horsley V., Plikus M. V., Anatomical, physiological, and functional diversity of adipose tissue. Cell Metab. 27, 68–83 (2018). - PMC - PubMed
    1. Cinti S., The adipose organ: Morphological perspectives of adipose tissues. Proc. Nutr. Soc. 60, 319–328 (2001). - PubMed
    1. Sanchez-Gurmaches J., Guertin D. A., Adipocytes arise from multiple lineages that are heterogeneously and dynamically distributed. Nat. Commun. 5, 4099 (2014). - PMC - PubMed

Publication types