. 2019 Aug 16;8(9):44.
doi: 10.1038/s41389-019-0157-8.

DeepCC: a novel deep learning-based framework for cancer molecular subtype classification

Affiliations

DeepCC: a novel deep learning-based framework for cancer molecular subtype classification

Feng Gao et al. Oncogenesis. .

Abstract

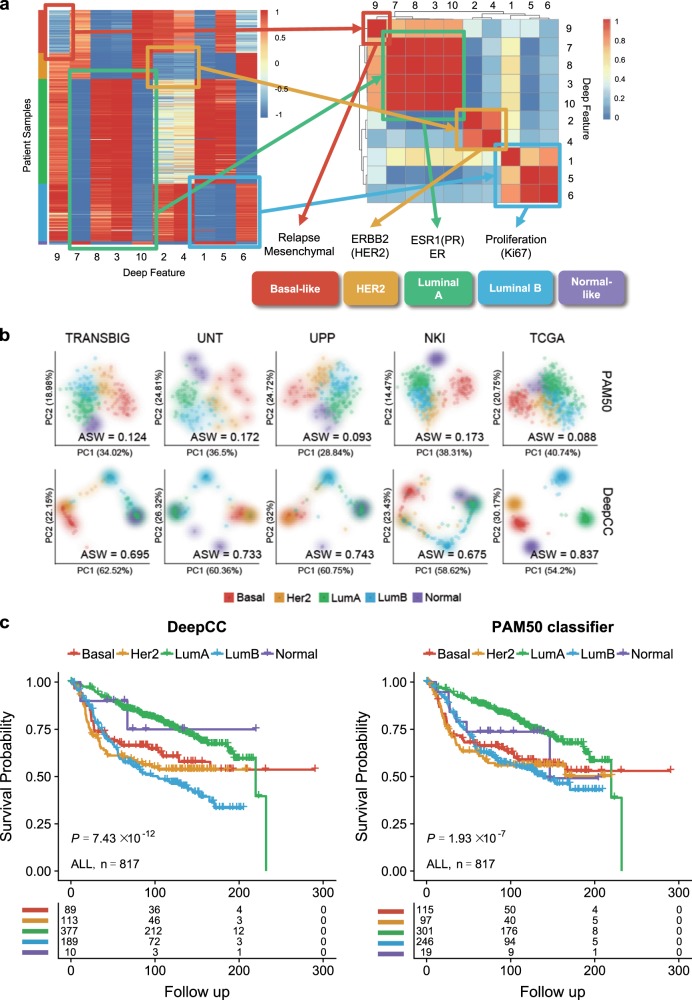
Molecular subtyping of cancer is a critical step towards more individualized therapy and provides important biological insights into cancer heterogeneity. Although gene expression signature-based classification has been widely demonstrated to be an effective approach in the last decade, the widespread implementation has long been limited by platform differences, batch effects, and the difficulty to classify individual patient samples. Here, we describe a novel supervised cancer classification framework, deep cancer subtype classification (DeepCC), based on deep learning of functional spectra quantifying activities of biological pathways. In two case studies about colorectal and breast cancer classification, DeepCC classifiers and DeepCC single sample predictors both achieved overall higher sensitivity, specificity, and accuracy compared with other widely used classification methods such as random forests (RF), support vector machine (SVM), gradient boosting machine (GBM), and multinomial logistic regression algorithms. Simulation analysis based on random subsampling of genes demonstrated the robustness of DeepCC to missing data. Moreover, deep features learned by DeepCC captured biological characteristics associated with distinct molecular subtypes, enabling more compact within-subtype distribution and between-subtype separation of patient samples, and therefore greatly reduce the number of unclassifiable samples previously. In summary, DeepCC provides a novel cancer classification framework that is platform independent, robust to missing data, and can be used for single sample prediction facilitating clinical implementation of cancer molecular subtyping.


Conflict of interest statement

The authors declare that they have no conflict of interest.

Figures

Fig. 1
Fig. 1. Overview of DeepCC.
a A deep learning-based cancer classification framework. DeepCC takes as input high-throughput gene expression data and transforms it to functional spectra using gene set enrichment analysis (GSEA). A feedforward artificial neural network is employed subsequently to perform feature learning and build a classifier for cancer classification. b Intersection of gene annotations (Entrez IDs) between three technical platforms: TCGA RNA-Seq data set, Affymetrix Human Genome U133 Plus 2.0 array, and Agilent Homo sapiens 37 K DiscoverPrint19742 microarray. c DeepCC’s classification performance on subsets of top variable genes, ranging from 1000 to 20,531, selected for calculating functional spectra on the TCGA CRC data set (n = 456). The classification performance was evaluated by overall accuracy, mean balanced accuracy, mean sensitivity, and mean specificity
Fig. 2
Fig. 2. CRC classification performance.
Bar plots of classification performance of DeepCC, compared to other signature gene-based approaches. The performance was evaluated on 13 independent validation data sets and the merged data set (ALL), by a balanced accuracy (calculated by the mean of balanced accuracy per class), b overall accuracy, c sensitivity (calculated by the mean of sensitivity per class), and d specificity (calculated by the mean of specificity per class)
Fig. 3
Fig. 3. Applying DeepCC to CRC classification.
a Bar plots of unclassified samples across multiple data sets demonstrating the superior classification performance of DeepCC. The TCGA data set was used to train DeepCC, DeepCC SSP, random forests, SVM, GBM, and multinomial logistic regression classifiers, which were applied to classify 13 independent data sets. In addition, the CMS classifier built by CRCSC was also included for a comparison. b Features learned by the hierarchical network of DeepCC showed increasing within-subtype compactness as the hidden layer goes deeper, as indicated by the distributions of CRC samples and average silhouette widths (ASWs) measured in the TCGA data set (n = 456). For visualization, the same set of samples were shown in the space of the first two principal components of features learned at each hidden layer (from 1 to 5). c Deep feature groups implicate the distinct biological functions associated with CRC subtypes. Deep features were obtained from the last hidden layer of the ANN trained with the TCGA data set (n = 456). Clustering of absolute Pearson correlation coefficients between the ten deep features identified three deep feature groups, which are highly correlated with microsatellite instability, metabolic dysregulation, and higher epithelial-to-mesenchymal transition, respectively. The order of deep features is in Fig. S4 and the detailed list of top correlated gene sets for each deep feature is in Table S5. d Visualization of patients from two independent validation cohorts in the space of the first two principal components (PCs) of expression data of the 273 CMS signature genes and the ten deep features, respectively. In both data sets, samples are much more tightly distributed within assigned subtypes in the deep feature space than the signature gene space, as quantified by average silhouette width (AWS)
Fig. 4
Fig. 4. Applying DeepCC to breast cancer data sets.
a Deep features of breast cancer learned from the TCGA data set (n = 517). In the left heatmap, rows represent patient samples, and are ordered by the four CMS subtypes. In the right heatmap, deep features were clustered by the absolute Pearson correlation coefficients between each other. b Visualization of patients in five independent breast cancer data sets. The top and bottom rows of figures visualize patients in the spaces of the first two principal components (PCs) of expression data of PAM50 signature genes and the ten deep features, respectively. In each independent data set (TANSBIG, UNT, UPP, NKI, and TCGA), samples are much more tightly distributed within assigned subtypes in the deep feature space than the signature gene space, as quantified by average silhouette width (AWS). c Kaplan–Meier survival curves of patients in all of four breast cancer data sets (TANSBIG, UNT, UPP, and NK). KM plots on the left and right were generated based on classification using DeepCC and the PAM50 classifier, respectively

References

    1. Breugom AJ, et al. Adjuvant chemotherapy and relative survival of patients with stage II colon cancer—A EURECCA international comparison between the Netherlands, Denmark, Sweden, England, Ireland, Belgium, and Lithuania. Eur. J. Cancer. 2016;63:110–117. doi: 10.1016/j.ejca.2016.04.017. - DOI - PubMed
    1. Dotan E, Cohen SJ. Challenges in the management of stage II colon cancer. Semin Oncol. 2011;38:511–520. doi: 10.1053/j.seminoncol.2011.05.005. - DOI - PMC - PubMed
    1. Jass JR. Classification of colorectal cancer based on correlation of clinical, morphological and molecular features. Histopathology. 2007;50:113–130. doi: 10.1111/j.1365-2559.2006.02549.x. - DOI - PubMed
    1. Linnekamp JF, Wang X, Medema JP, Vermeulen L. Colorectal cancer heterogeneity and targeted therapy: a case for molecular disease subtypes. Cancer Res. 2015;75:245–249. doi: 10.1158/0008-5472.CAN-14-2240. - DOI - PubMed
    1. Hoadley KA, et al. Multiplatform analysis of 12 cancer types reveals molecular classification within and across tissues of origin. Cell. 2014;158:929–944. doi: 10.1016/j.cell.2014.06.049. - DOI - PMC - PubMed