. 2019 Aug 15;11(15):5829-5847.
doi: 10.18632/aging.102190. Epub 2019 Aug 15.

Long non-coding RNA CASC19 is associated with the progression and prognosis of advanced gastric cancer

Affiliations

Long non-coding RNA CASC19 is associated with the progression and prognosis of advanced gastric cancer

Wen-Jie Wang et al. Aging (Albany NY). .

Abstract

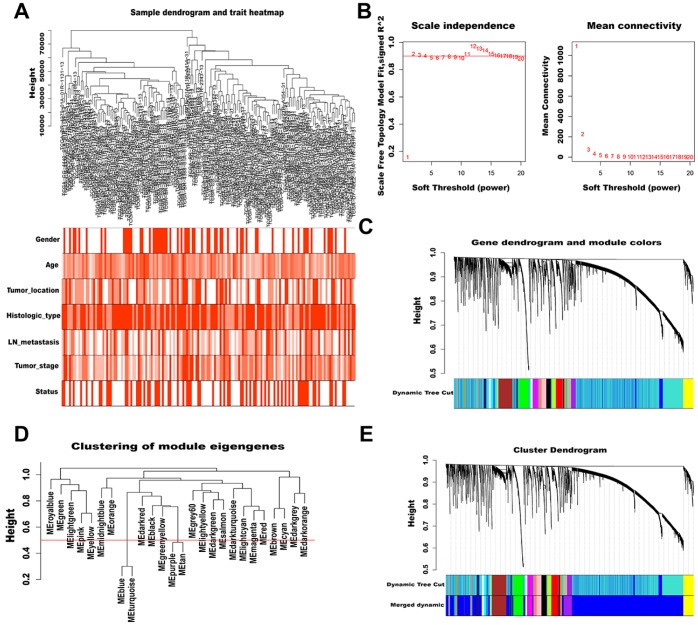
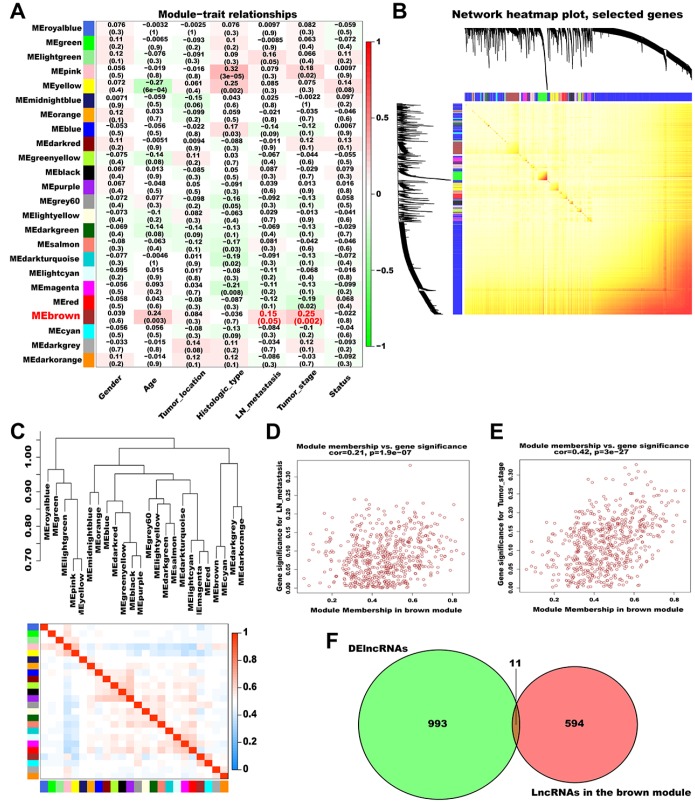
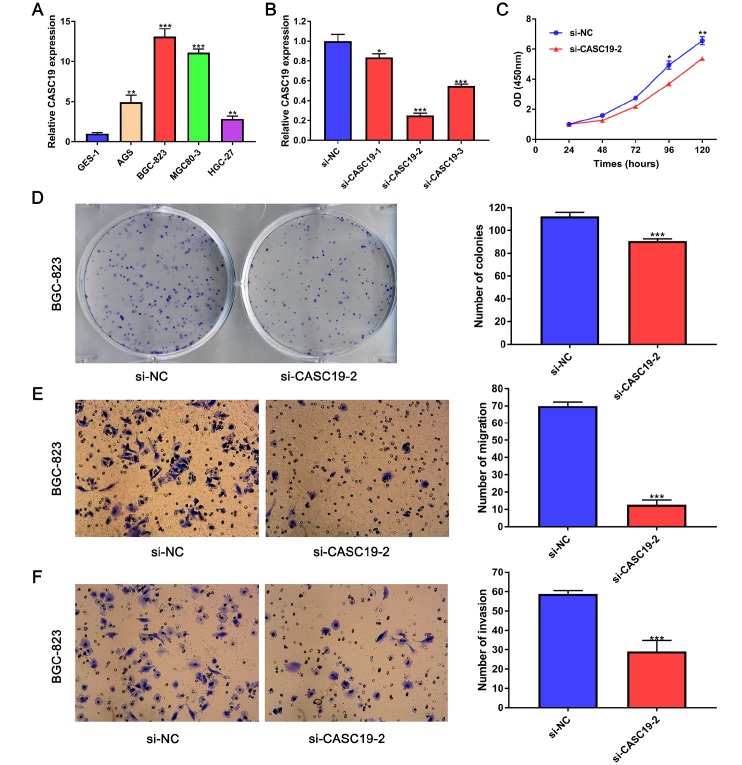
Evidence indicates that aberrantly expressed long non-coding RNAs (lncRNAs) are involved in the development and progression of advanced gastric cancer (AGC). Using RNA sequencing data and clinical information obtained from The Cancer Gene Atlas, we combined differential lncRNA expression profiling and weighted gene co-expression network analysis to identify key lncRNAs associated with AGC progression and prognosis. Cancer susceptibility 19 (CASC19) was the top hub lncRNA among the lncRNAs included in the gene module most significantly correlated with AGC's pathological variables. CASC19 was upregulated in AGC clinical samples and was significantly associated with higher pathologic TNM stage, pathologic T stage, lymph node metastasis, and poor overall survival. Multivariable Cox analysis confirmed that CASC19 overexpression is an independent prognostic factor for overall survival. Furthermore, quantitative real-time PCR assay confirmed that CASC19 expression in four human gastric cancer cells (AGS, BGC-823, MGC-803, and HGC-27) was significantly upregulated compared with human normal gastric mucosal epithelial cell line (GES-1). Functionally, CASC19 knockdown inhibited GC cell proliferation and migration in vitro. These findings suggest that CASC19 may be a novel prognostic biomarker and a potential therapeutic target for AGC.

Keywords: cancer susceptibility 19; gastric cancer; prognosis; progression; weighted gene co-expression network analysis.


Conflict of interest statement

CONFLICTS OF INTEREST: No potential conflicts of interests were reported by the authors.

Figures

Figure 1
Figure 1
Study analysis flowchart.
Figure 2
Figure 2
WGCNA of lncRNAs in AGC. (A) Sample dendrogram and trait heatmap (outliers and samples with incomplete clinical information were removed). Color depth is proportional to the strength of the correlation with clinical traits in each sample, with red and white representing highest and lowest correlation, respectively. (B) Soft-thresholding power analysis of scale independence and mean connectivity. The left graph shows the correlation coefficients that correspond to different soft-thresholding powers. The higher the coefficient, the more the network conforms to the distribution of scale-free networks. The right graph displays the mean coefficient of contiguous genes in the gene network corresponding to different soft-thresholding powers, which reflects the average connection level of the network. (C) The dynamic Tree Cut method classifies gene clustering trees. Different colors represent different gene modules, and gray indicates genes that do not belong to any known module. (D) Cluster dendrogram of module eigengenes. The value corresponding to the red line in the figure indicates the merge threshold. (E) Clustering dendrogram of genes by hierarchical clustering based on the dissimilarity TOM. Dynamic tree cut corresponds to the originally obtained module, and merged dynamic corresponds to the merged module finally obtained.
Figure 3
Figure 3
Identification of significant modules associated with clinical traits. (A) Relationships between module eigengenes and clinical traits of AGC. Each row in the figure corresponds to a module eigengene, and each column corresponds to a clinical trait. The correlation coefficient in each grid represents the correlation between the gene module and the clinical traits; red indicates positive correlation and green represents negative correlation. (B) TOM depicting the correlation of pairs of genes within each module. The heat map depicts the TOM from 1000 randomly selected genes from a weighted co-expression network. In the heat map, each row and column correspond to a gene; light colors indicate low topological overlap, and progressively darker yellow and red represent higher topological overlap. (C) Dendrogram heatmap of the association between modules and clinical traits. The dendrogram above shows the modules generated in the cluster analysis. Branches of the dendrogram combine positively correlated eigengenes. The heat map below shows the adjacencies in the eigengene network. Each row and column in the heat map corresponds to a module eigengene. Red indicates a positive correlation with high adjacency and blue indicates a negative correlation with low adjacency. The red square along the diagonal is the meta-module. (D) Scatter plot of MM versus GS for LN metastasis (cor = 0.21, P = 1.9e-07) in the brown module. (E) Scatter plot of MM versus GS for pathological TNM stage (cor = 0.42, P = 3e-27) in the brown module. (F) Venn plot of DElncRNAs and the lncRNAs in the brown module. Green represents the DElncRNAs and red represents the lncRNAs in the brown module.
Figure 4
Figure 4
Correlation between CASC19 expression and clinicopathologic parameters. (A) CASC19 expression comparison between AGC tissues and non-tumor tissues. (B) CASC19 expression comparison between AGC tissues and paired non-tumor tissues. (C) CASC19 expression comparison between different age groups. (D) CASC19 expression comparison between genders. (E) CASC19 expression comparison based on tumor histology. (F) and (G) CASC19 expression comparison between different pathologic T stages. (H) CASC19 expression based on metastatic LN status. (I) CASC19 expression based on distant metastasis status. (J) and (K) CASC19 expression comparison between different pathologic TNM stages. (L) Kaplan–Meier survival curves. AGC patients with high CASC19 expression (≥ 0.57) had significantly worse prognosis than those with low CASC19 expression (< 0.57) for overall survival.
Figure 5
Figure 5
GSEA identifies eight representative pathways enriched in AGC samples with high CASC19 expression.
Figure 6
Figure 6
CASC19 knockdown inhibits GC cell proliferation and metastasis. (A) qRT-PCR analysis of CASC19 expression in four GC cell lines (AGS, BGC-823, MGC-803, and HGC-27) and a normal gastric mucosal epithelial cell line (GES-1). (B) qRT-PCR showing successful CASC19 knockdown in BGC-823 cells using si-CASC19-2. (C) CASC19 knockdown inhibits proliferation in BGC-823 cells. (D) Colony formation is increased after CASC19 knockdown. (E) and (F) CASC19 silencing decreases cell migration in Transwell assays. All data are presented as mean ± standard deviation of three independent experiments. *P < 0.05;**P < 0.01; *** P < 0.001.

References

    1. Siegel RL, Miller KD, Jemal A. Cancer statistics, 2019. CA Cancer J Clin. 2019; 69:7–34. 10.3322/caac.21551 - DOI - PubMed
    1. Bray F, Ferlay J, Soerjomataram I, Siegel RL, Torre LA, Jemal A. Global cancer statistics 2018: GLOBOCAN estimates of incidence and mortality worldwide for 36 cancers in 185 countries. CA Cancer J Clin. 2018; 68:394–424. 10.3322/caac.21492 - DOI - PubMed
    1. Kopp F, Mendell JT. Functional Classification and Experimental Dissection of Long Noncoding RNAs. Cell. 2018; 172:393–407. 10.1016/j.cell.2018.01.011 - DOI - PMC - PubMed
    1. Uszczynska-Ratajczak B, Lagarde J, Frankish A, Guigó R, Johnson R. Towards a complete map of the human long non-coding RNA transcriptome. Nat Rev Genet. 2018; 19:535–48. 10.1038/s41576-018-0017-y - DOI - PMC - PubMed
    1. Berger AC, Korkut A, Kanchi RS, Hegde AM, Lenoir W, Liu W, Liu Y, Fan H, Shen H, Ravikumar V, Rao A, Schultz A, Li X, et al.. A Comprehensive Pan-Cancer Molecular Study of Gynecologic and Breast Cancers. Cancer Cell. 2018; 33:690–705.e9. 10.1016/j.ccell.2018.03.014 - DOI - PMC - PubMed

Publication types

MeSH terms