. 2019 Aug 18;11(16):5895-5923.
doi: 10.18632/aging.102173. Epub 2019 Aug 18.

DNA methylation-based estimator of telomere length

Affiliations

DNA methylation-based estimator of telomere length

Ake T Lu et al. Aging (Albany NY). .

Abstract

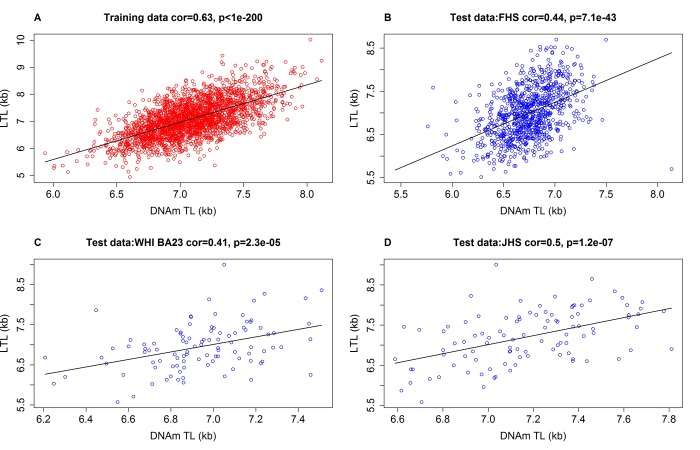
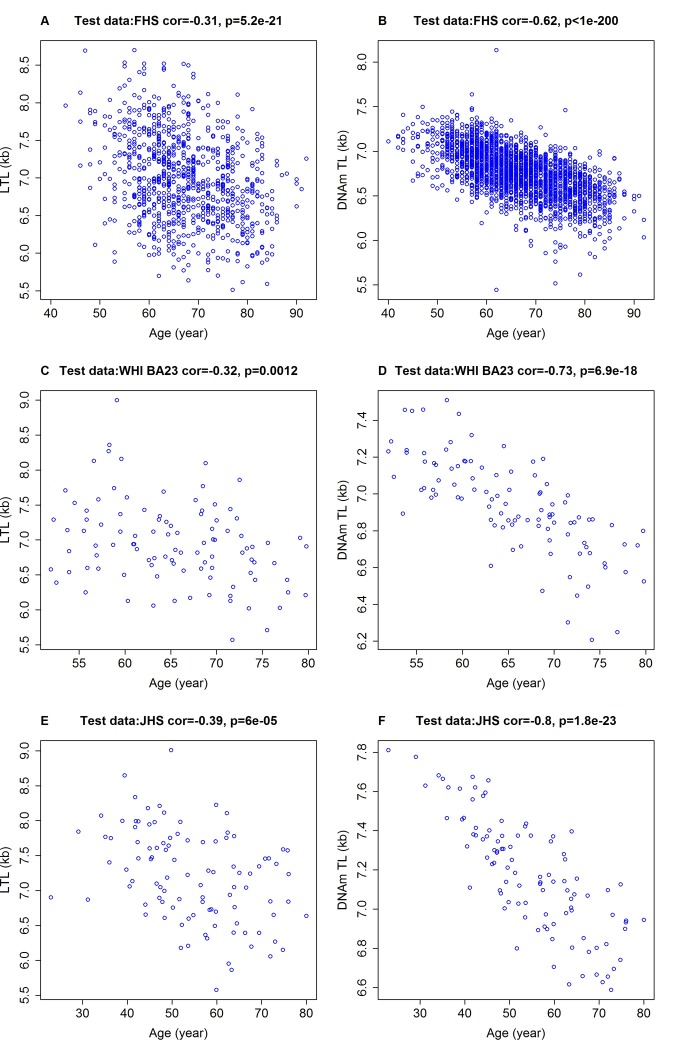
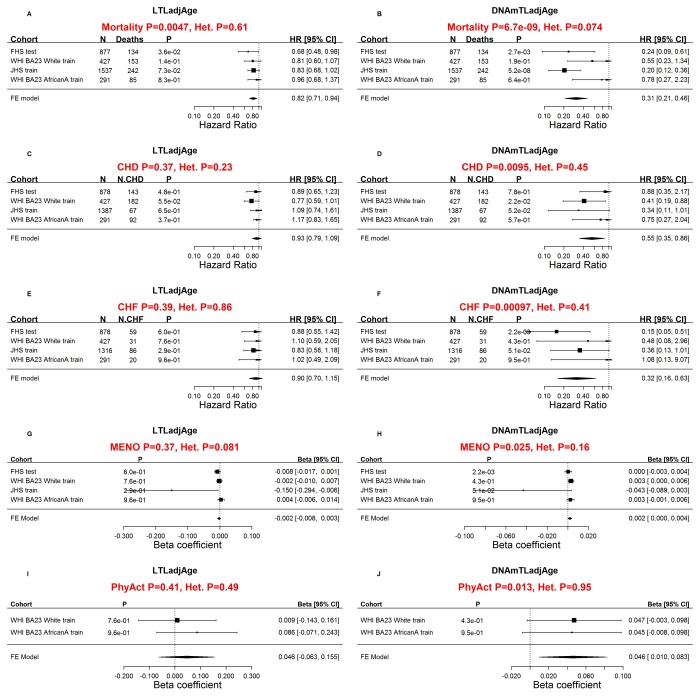
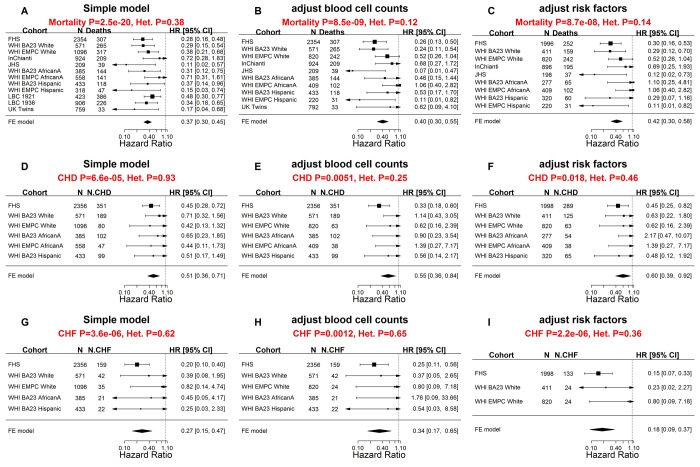
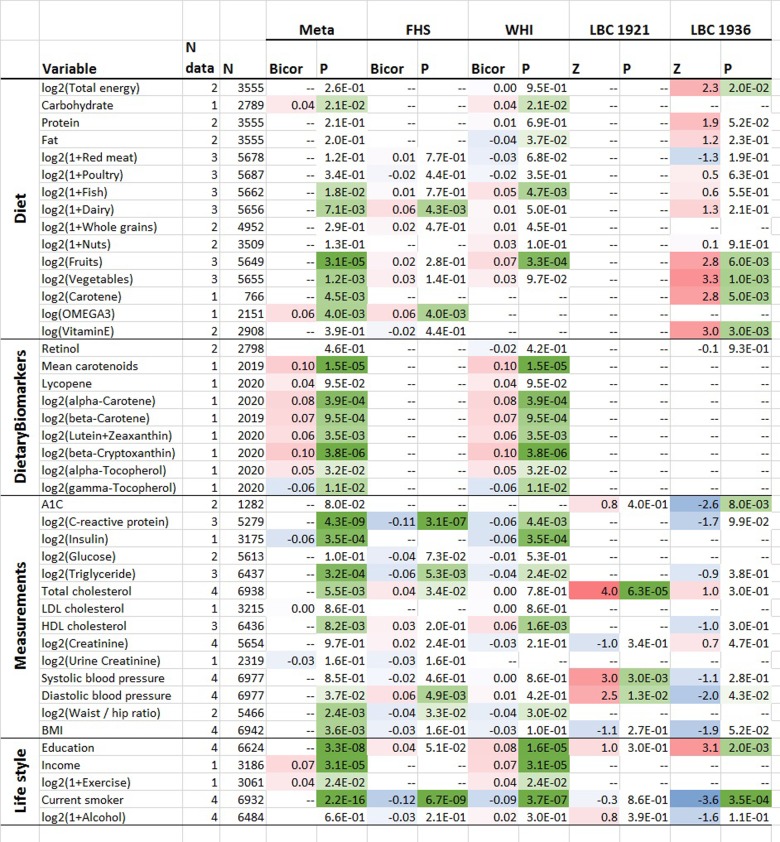
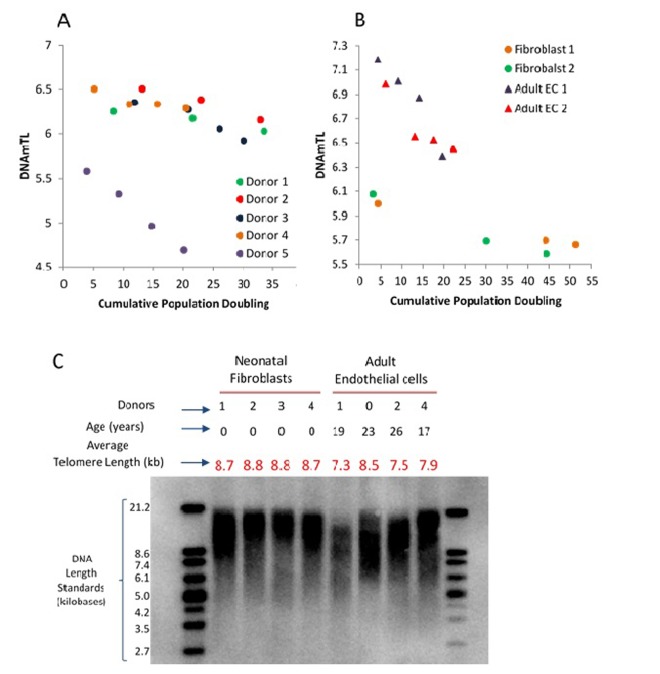
Telomere length (TL) is associated with several aging-related diseases. Here, we present a DNA methylation estimator of TL (DNAmTL) based on 140 CpGs. Leukocyte DNAmTL is applicable across the entire age spectrum and is more strongly associated with age than measured leukocyte TL (LTL) (r ~-0.75 for DNAmTL versus r ~ -0.35 for LTL). Leukocyte DNAmTL outperforms LTL in predicting: i) time-to-death (p=2.5E-20), ii) time-to-coronary heart disease (p=6.6E-5), iii) time-to-congestive heart failure (p=3.5E-6), and iv) association with smoking history (p=1.21E-17). These associations are further validated in large scale methylation data (n=10k samples) from the Framingham Heart Study, Women's Health Initiative, Jackson Heart Study, InChianti, Lothian Birth Cohorts, Twins UK, and Bogalusa Heart Study. Leukocyte DNAmTL is also associated with measures of physical fitness/functioning (p=0.029), age-at-menopause (p=0.039), dietary variables (omega 3, fish, vegetable intake), educational attainment (p=3.3E-8) and income (p=3.1E-5). Experiments in cultured somatic cells show that DNAmTL dynamics reflect in part cell replication rather than TL per se. DNAmTL is not only an epigenetic biomarker of replicative history of cells, but a useful marker of age-related pathologies that are associated with it.

Keywords: DNA methylation; aging; molecular biomarker; telomere length.


Conflict of interest statement

CONFLICTS OF INTEREST: The authors declare no conflicts of interest.

Figures

Figure 1
Figure 1
Measured LTL versus DNAmTL in training and test datasets. Scatter plots of DNA methylation-based telomere length (DNAmTL, x-axis) versus observed LTL measured by terminal restriction fragmentation (y-axis). DNAmTL and LTL are in units of kilobase (kb). (A) Training data. (B) Test data from the Framingham Heart Study. (C) Test data from the Women's Health Initiative (BA23 sub-study). (D) Test data from the Jackson Heart Study. Each panel reports a Pearson correlation coefficient and correlation test p-value. Table 1 reports analogous results for additional cohorts (Bogalusa, Twins UK, etc).
Figure 2
Figure 2
Chronological age versus measured LTL and DNAmTL. Chronological age versus measured LTL (panels A, C, E, in units of kilobase [kb]) and DNAmTL (panels B, D, F, in units of kb). (A, B) Test data from the FHS. (C, D) Test data from the WHI (N=100), (E, F) Test data from the JHS (N=100). Each panel reports a Pearson correlation coefficient and correlation test p-value.
Figure 3
Figure 3
Comparing measured LTL with DNAmTL with respect to age-related conditions. Meta-analysis forest plots for relating age-related conditions (rows) to age-adjusted LTL (left panels) and age-adjusted DNAmTL (right panels). Panels in the first row (A, B) presents meta-analysis forest plots for Cox regression models of time-to-death. Meta-analysis of Cox regression models for (C, D) time-to-coronary heart disease (CHD) and (E, F) time-to-congestive heart failure (CHF). Rows in the forest plot correspond to training and test datasets (used for developing DNAmTL) stratified by race/ethnicity Each row presents the summary statistic at a (stratified) study da.taset and reports sample size (N), number of events, P value, hazard ratio and a 95% confidence interval resulting from a Cox regression model. (G, H) Meta-analysis for the association with age at menopause. (I, J) Meta-analysis for the association with self-reported physical activity status (yes/no). (G-J) Each row (study data set) presents the summary statistic, P value, beta coefficient and a 95% confidence interval resulting from a linear (mixed) regression model. In general, an insignificant Cochran Q test p-value (denoted by Het. P) is desirable because it suggests that results do not differ significantly across the strata. However, an insignificant Q test p-value could also reflect lack of statistical power.
Figure 4
Figure 4
Meta-analysis forest plots for predicting time-to-death due to all-cause mortality and time-to-cardiovascular disease in independent validation data. Meta-analysis forest plot for combining Cox regression hazard ratios for time-to-death, time-to-coronary heart disease (CHD), and time-to-congestive heart failure (CHF), based on age-adjusted DNAmTL (DNAmTLadjAge). The sample sizes for the analysis were up to 9,044 methylation arrays (8,541 individuals) across 8 cohorts. Left panels, middle panels, and right panels report meta-analysis results for (1) simple Cox regression models, (2) multivariate Cox models adjusted for blood cell counts, and (3) multivariate Cox model adjusted for traditional risk factors, respectively. Each row reports the hazard ratio associated with DNAmTLadjAge. (1) The simple Cox models (left panels) were adjusted for chronological age, sex and adjusted for intra-pedigree correlation and batch effects as needed. (2) The models in the middle panels involved additional covariates: imputed blood cell counts based on DNA methylation data. (3) The models in the right panels different from those of (1) by additional demographic characteristics, psychosocial behavior, and clinical covariates (Methods). Each panel reports a meta-analysis forest plot for combining hazard ratios associated with time to event. Each row presents the summary statistic at a (stratified) study dataset and reports sample size (N), number of events, hazard ratio and a 95% confidence interval resulting from a Cox regression model. In general, an insignificant Cochran Q test p-value (denoted by Het. P) is desirable.
Figure 5
Figure 5
Cross sectional associations between age-adjusted DNAmTL versus lifestyle/dietary variables. Association analysis between age-adjusted DNAmTL (DNAmTLadjAge) and 43 variables including 15 self-reported diet, 9 dietary biomarkers, 14 variables related to metabolic traits and central adiposity, and 5 life style factors, based on the meta-analysis across the FHS WHI, LBC 1921 and LBC 1936 cohort. Robust correlation coefficients (biweight midcorrelation) analysis were performed on the FHS and WHI cohort while generalized linear regression analysis adjusted for sex was performed on the LBC 1921 and 1936 cohort, respectively. For each variable, we display number of datasets, number of total subjects, the robust correlation results from the meta-analysis, FHS, and the WHI cohort and the Z statistics for the LBC respectively. The meta-analysis was based on Stouffer’s method for the majority of the variables or fixed effect models. The 2-color scale (blue to red) color-codes bicor correlation coefficients in the range [-1, 1] or Z statistics. The green color scale (light to dark) applied to unadjusted P values. Cell entry "--" denotes not available. The correlation analysis results stratified by sex using the FHS cohort are listed in Supplementary Figure 11 and stratified by ethnic group using the WHI cohort are listed in Supplementary Figure 12, respectively.
Figure 6
Figure 6
Application of DNAmTL on in vitro keratinocytes, neonatal fibroblasts and adult coronary artery endothelial cells. Panel (A) depicts decreasing DNAmTL values of keratinocytes from five heathy donors as a function of cumulative population doubling (y-axis, in units in kilobase). Panel (B) show that DNAmTL values of neonatal fibroblasts are smaller than those of adult coronary artery endothelial cells (EC). Both cell types exhibit decreasing DNAmTL in function of cumulative population doubling (x-axis). Panel (C) is the average telomere length measurement of neonatal fibroblasts and adult endothelial cells, which revealed that the telomeres of the former are longer than those of the latter.
Figure 7
Figure 7
Application of DNAmTL on hTERT-transduced primary human fibroblasts. Panel (A) DNAmTL of primary neonatal fibroblasts without (Donor A and B) or with hTERT (Donor A hTERT and Donor B hTERT) transduction demonstrated linear and continued decrease in value regardless of hTERT status. This contrasts with average telomere length measurement by TRF southern blotting (Panel B), which revealed substantial increase in telomere length of primary neonatal fibroblasts that were transduced with hTERT-expression vector.

References

    1. Nordfjäll K, Svenson U, Norrback KF, Adolfsson R, Roos G. Large-scale parent-child comparison confirms a strong paternal influence on telomere length. Eur J Hum Genet. 2010; 18:385–89. 10.1038/ejhg.2009.178 - DOI - PMC - PubMed
    1. Daniali L, Benetos A, Susser E, Kark JD, Labat C, Kimura M, Desai K, Granick M, Aviv A. Telomeres shorten at equivalent rates in somatic tissues of adults. Nat Commun. 2013; 4:1597. 10.1038/ncomms2602 - DOI - PMC - PubMed
    1. Epel ES, Blackburn EH, Lin J, Dhabhar FS, Adler NE, Morrow JD, Cawthon RM. Accelerated telomere shortening in response to life stress. Proc Natl Acad Sci USA. 2004; 101:17312–15. 10.1073/pnas.0407162101 - DOI - PMC - PubMed
    1. Fitzpatrick AL, Kronmal RA, Gardner JP, Psaty BM, Jenny NS, Tracy RP, Walston J, Kimura M, Aviv A. Leukocyte telomere length and cardiovascular disease in the cardiovascular health study. Am J Epidemiol. 2007; 165:14–21. 10.1093/aje/kwj346 - DOI - PubMed
    1. Willeit P, Willeit J, Brandstätter A, Ehrlenbach S, Mayr A, Gasperi A, Weger S, Oberhollenzer F, Reindl M, Kronenberg F, Kiechl S. Cellular aging reflected by leukocyte telomere length predicts advanced atherosclerosis and cardiovascular disease risk. Arterioscler Thromb Vasc Biol. 2010; 30:1649–56. 10.1161/ATVBAHA.110.205492 - DOI - PubMed

Publication types