. 2019 Sep 5;105(3):534-548.
doi: 10.1016/j.ajhg.2019.07.015. Epub 2019 Aug 15.

Bi-allelic GOT2 Mutations Cause a Treatable Malate-Aspartate Shuttle-Related Encephalopathy

Affiliations

Bi-allelic GOT2 Mutations Cause a Treatable Malate-Aspartate Shuttle-Related Encephalopathy

Clara D M van Karnebeek et al. Am J Hum Genet. .

Abstract

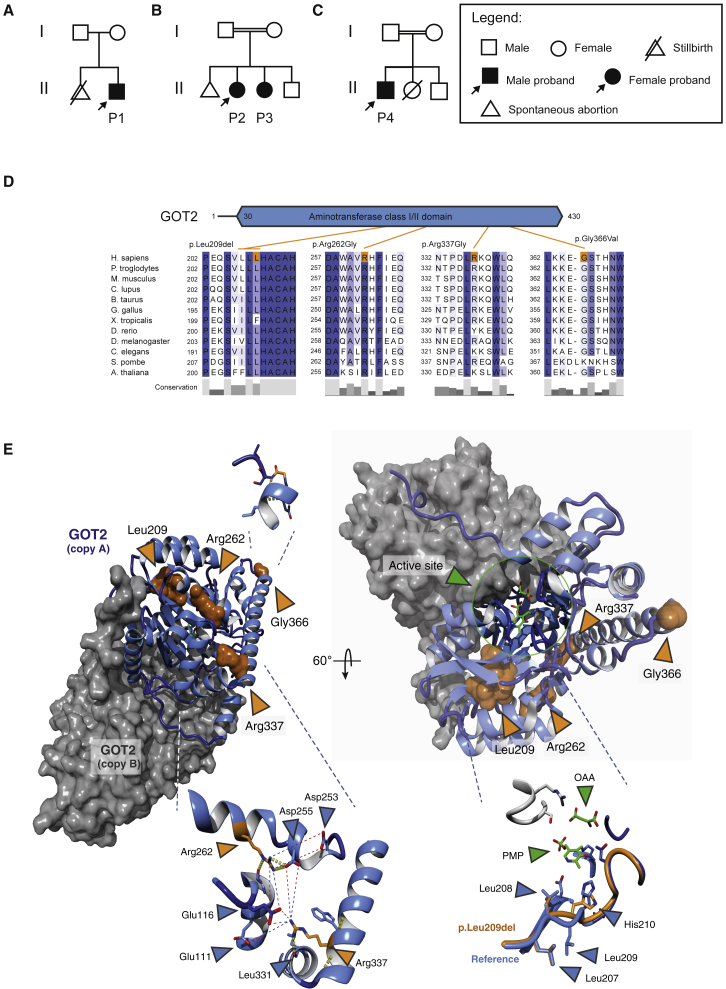
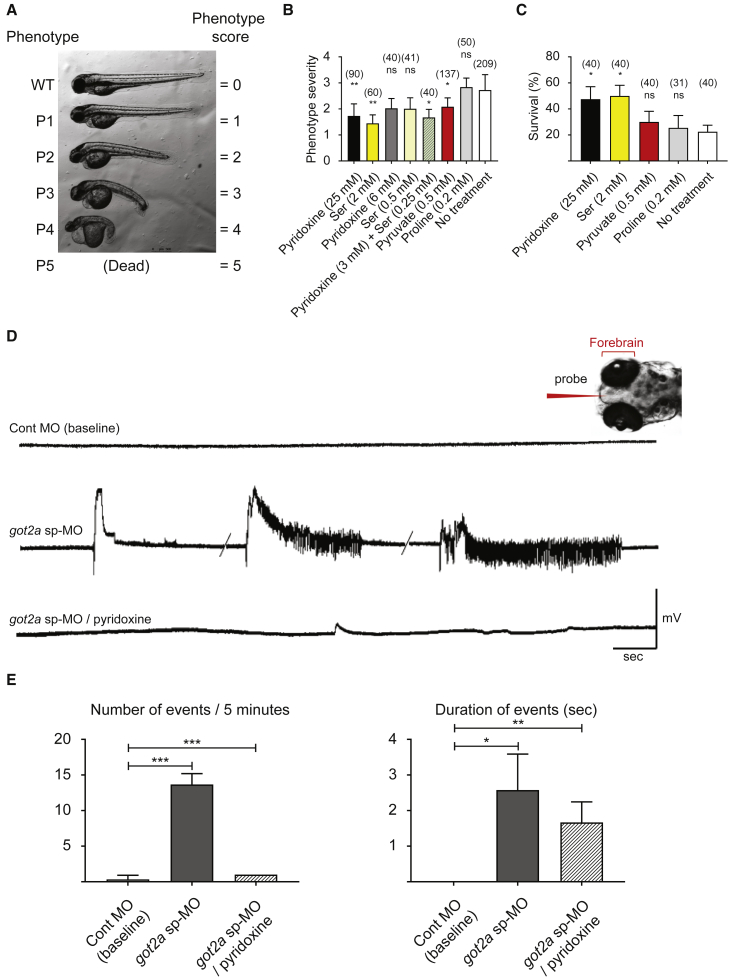
Early-infantile encephalopathies with epilepsy are devastating conditions mandating an accurate diagnosis to guide proper management. Whole-exome sequencing was used to investigate the disease etiology in four children from independent families with intellectual disability and epilepsy, revealing bi-allelic GOT2 mutations. In-depth metabolic studies in individual 1 showed low plasma serine, hypercitrullinemia, hyperlactatemia, and hyperammonemia. The epilepsy was serine and pyridoxine responsive. Functional consequences of observed mutations were tested by measuring enzyme activity and by cell and animal models. Zebrafish and mouse models were used to validate brain developmental and functional defects and to test therapeutic strategies. GOT2 encodes the mitochondrial glutamate oxaloacetate transaminase. GOT2 enzyme activity was deficient in fibroblasts with bi-allelic mutations. GOT2, a member of the malate-aspartate shuttle, plays an essential role in the intracellular NAD(H) redox balance. De novo serine biosynthesis was impaired in fibroblasts with GOT2 mutations and GOT2-knockout HEK293 cells. Correcting the highly oxidized cytosolic NAD-redox state by pyruvate supplementation restored serine biosynthesis in GOT2-deficient cells. Knockdown of got2a in zebrafish resulted in a brain developmental defect associated with seizure-like electroencephalography spikes, which could be rescued by supplying pyridoxine in embryo water. Both pyridoxine and serine synergistically rescued embryonic developmental defects in zebrafish got2a morphants. The two treated individuals reacted favorably to their treatment. Our data provide a mechanistic basis for the biochemical abnormalities in GOT2 deficiency that may also hold for other MAS defects.

Keywords: EC 2.6.1.1.; GOT2; aspartate aminotransferase; encephalopathy; inborn error of metabolism; malate-aspartate shuttle; mitochondriopathy; pyridoxine responsive epilepsy; redox imbalance; treatment.


Conflict of interest statement

The authors declare no competing interests.

Figures

Figure 1
Figure 1
Schematic Diagram Showing the Essential Role of the Malate-Aspartate NAD(H) Redox Shuttle in the Re-oxidation of Cytosolic NADH (A) The cytosol contains a variety of different NADH-generating dehydrogenases involved in glycolysis, serine biosynthesis, and other pathways. Since the mitochondrion is the ultimate site of NADH-re-oxidation, the NADH generated in the cytosol needs to be shuttled across the mitochondrial membrane. This is brought about by so-called NAD(H) redox shuttles, with the malate aspartate shuttle as the most important one. The malate aspartate shuttle requires the concerted action of six different components: cytosolic and mitochondrial malate dehydrogenase (MDH1 and MDH2), cytosolic and mitochondrial glutamate aspartate transaminase (GOT1 and GOT2), and the two mitochondrial solute carriers aspartate-glutamate (AGC1 and AGC2) and 2-oxoglutarate (OGC). (B) Schematic diagram showing the consequences of an impairment in the malate-aspartate NAD(H) redox shuttle and the important role of lactate dehydrogenase in the re-oxidation of the NADH generated in the cytosol. GAP, glyceraldehyde 3-phosphate; 1,3-DPG, 1,3-diphosphoglycerate; 3-PG, 3-phosphoglycerate; PEP, phosphoenolpyruvate; GAPDH, glyceraldehyde 3-phosphate dehydrogenase; 3-PGDH, 3-phosphoglycerate dehydrogenase; LDH, lactate dehydrogenase; NAD+, nicotinamide adenine dinucleotide (oxidized form); NADH, nicotinamide adenine dinucleotide (reduced form); MIM, mitochondrial intermembrane space; ADP, adenosine diphosphate; ATP, adenosine triphosphate; Pi, inorganic phosphate; OXPHOS, oxidative phosphorylation.
Figure 2
Figure 2
The Pedigrees and the GOT2 Variants (A–C) Pedigrees of the families I–III. (D) Alignment of GOT2 ortholog sequences. p.Leu209del represents the deletion of a leucine in a tri-leucine stretch. Figure S1 shows the full alignment. (E) Molecular modeling of the variants. Shown are rotated overview structures of the GOT2 homodimer complex, with variants found in affected individuals shown in orange. Insets: p.Gly366Val (top left), p.Arg337Gly and p.Arg262Gly (bottom left; glycine substitutions not visible), p.Leu209del (bottom right; reference structure in blue and variant model in orange superimposed). While visualized in a single structure, variants are not simultaneously present in the same copy of the gene. Models are based on template structure PDB: 5AX8, with ligand coordinates taken from PDB: 3PDB. PMP, pyridoxamine 5′-phosphate; OAA, oxaloacetate. Hydrogen bonds in yellow; other charge interactions as dashed lines. p.Leu209del shortens a beta strand in the protein core close to the active site, leading to a repositioning of loops involved in the geometry of the catalytic pocket, likely affecting binding of both the enzyme cofactor (pyridoxal 5′-phosphate) and substrates. p.Gly366Val has a predicted marginal effect on the protein structure, but is still well conserved across evolution. For p.Arg337Gly and p.Arg262Gly, substitution of the positively charged arginine residues with the neutral glycine residue results in a disruption of electrostatic interactions that in the wild-type protein stabilize the α-helical organization of the protein.
Figure 3
Figure 3
GOT Expression and Activity (A) Western blot showing GOT2 and the mitochondrial fraction marker SDHA (succinate dehydrogenase complex flavoprotein subunit A) in the GOT2-deficient individuals, GOT2 carriers, and two control fibroblast lines. (B) Western blot for GOT2 protein in GOT2 wild-type and the three GOT2-knockout HEK293 cell lines. (C) GOT2 activity in mitochondria-enriched fractions from fibroblasts from the GOT2-deficient individuals, GOT2 carriers, and three healthy control subjects. Graph bars represent mean ± SD. (D) Total GOT (GOT1 and GOT2 isoforms) activity in whole-cell lysates; results are representative of two independent experiments. (E) GOT2 activity in the mitochondria-enriched fractions of GOT2-WT and the three GOT2-knockout HEK293 cell lines; results are representative of two independent experiments. (F) GOT2 rescue experiment in fibroblasts from individual 1. GOT2 activity is restored to control levels when GOT2-deficient fibroblasts are transduced with the GOT2 wild-type gene. Five control fibroblast lines and the GOT2-deficient fibroblasts transduced without GOT2 wild-type (+ GFP lane) were used for comparison.
Figure 4
Figure 4
De novo Serine Biosynthesis in Mutant Fibroblasts and GOT2-Knockout HEK293 Cells (A) 13C3-serine fractions were determined in fibroblasts of GOT2-deficient cases, the two GOT2 carriers, six healthy control subjects, and two individuals with a de novo serine biosynthesis defect (3-PGDHD and PSATD deficiencies). Fibroblasts were incubated with 13C6-glucose, and the formation of the labeled 13C3-serine was analyzed at t = 0, 0.5, 4, and 10 h after exposure. The results are normalized to total protein content and represented as the mean of n = 3 ± SD for individual 4 and carrier 2, PSATD deficiency and 3-PGDHD deficiency; n = 6 ± SD for individuals 1, 2, and 3, and carrier 1; and n = 33 ± SD for control subjects. (B) 13C3-serine and 13C2-glycine fractions were determined in GOT2-WT (full line) and the GOT2-knockout HEK293 cell lines (dashed line). Cells were incubated with 13C6-glucose, and the formation of the labeled 13C3-serine and 13C2-glycine was analyzed at t = 0, 0.5, 4, and 10 h after exposure. The results are representative of two independent experiments and are normalized to total protein content and represented as the mean of n = 3 (biological triplicates) ± SD. (C) To study the impact of glycerol and pyruvate supplementation in de novo serine production of the GOT2-knockout cell lines, we supplemented the cells with these compounds (2.5 and 5 mmol/L) for 4 h. The formation of labeled 13C3-serine was analyzed at t = 0, 0.5, and 4 h after exposure. The results are normalized to total protein content and represented as the mean of n = 3 ± SD. (D) The same study was performed for glycine. The formation of labeled 13C2-glycine was analyzed at t = 0, 0.5, and 4 h after exposure. The results are normalized to total protein content and represented as the mean of n = 3 ± SD.
Figure 5
Figure 5
Knockdown of got2a in Zebrafish Perturbs Brain and Embryonic Development and Function, which Can Be Rescued by Pyridoxine and Serine (A) Phenotype severity and rescue scoring system for got2a knockdown embryos. Bright field images of 3 day post fertilization (dpf) WT embryos injected with control morpholino (Cont MO) and/or got2a ATG blocking morpholino (got2a MO). The got2a morphants were scored in five different categories (P1 to P5) based on the phenotype severities. (B) Pyridoxine, serine, and pyruvate decrease got2a morphant’s phenotype severity. Number of larvae per condition were shown in parentheses. 2 nL of morpholino (0.4 mM working solution) was injected. Compounds were added at 6 h post-fertilization (hpf) in 24-well plates. Every 24 h, dead embryos were removed and the compounds were replaced with fresh solution. Phenotype was characterized at 3 dpf. For phenotype severity calculation, the following “phenotype scores” were used: P0, normal: 0; P1, small brain, enlarged yolk, and mild cardiac edema: 1; P2, smaller brain, enlarged yolk, mild cardiac edema, and shortened body: 2; P3, smaller brain, enlarged yolk, severe cardiac edema, and curved body: 3; P4, very small brain, enlarged yolk, very severe cardiac edema, deformed tail, and round body shape: 4; P5, dead: 5. Average phenotype severity = ∑ n x (Phenotype score) / N. n, number of embryos showing a specific phenotype in a well; N, total initial number of embryos in a well. Treated samples were compared to non-treated conditions using one-way ANOVA test (p < 0.05; ∗∗p < 0.01; ns, not significant). (C) Pyridoxine and serine increase the survival of got2a morphants at 2 dpf. Number of larvae per condition is shown in parentheses. 4 nL of morpholino (0.8 mM working solution) was injected. Compounds were added at 6 h post-fertilization (hpf) in 24-well plates. Every 24 h, dead embryos were removed and the compounds were replaced with fresh solution. The ratio of alive to total number of larvae was counted and survival percentage calculated at 2 dpf (a dead zebrafish embryo defined as having no heartbeat and no response to stimuli). Treated samples were compared to non-treated conditions using one-way ANOVA test (p < 0.05; ns, not significant). (D) got2a knockdown provoked seizure-like EEG spikes in the forebrain that are rescued by treatment with pyridoxine in 48 hpf embryos. Newly fertilized zebrafish embryos are injected with control morpholino (Cont MO) or got2a splicing morpholino (sp-MO). Embryos injected with got2a sp-MO showed EEG spike discharges, not present in traces from embryos injected with Cont MO. (E) Analysis of EEG traces. Number of events in 5 min recordings and the duration of each event in seconds (sec) in embryos injected with Cont MO, got2a sp-MO, and got2a sp-MO and treated with pyridoxine. Each event corresponds to a single spike discharge. Bars represent the mean ± SEM. N = 3 embryos per treatment. p < 0.05 and ∗∗∗p < 0.001.

References

    1. Lu M., Zhou L., Stanley W.C., Cabrera M.E., Saidel G.M., Yu X. Role of the malate-aspartate shuttle on the metabolic response to myocardial ischemia. J. Theor. Biol. 2008;254:466–475. - PMC - PubMed
    1. Williamson D.H., Lund P., Krebs H.A. The redox state of free nicotinamide-adenine dinucleotide in the cytoplasm and mitochondria of rat liver. Biochem. J. 1967;103:514–527. - PMC - PubMed
    1. Dawson A.G. Oxidation of cytosolic NADH formed during aerobic metabolism in mammalian cells. Trends Biochem. Sci. 1979;4:171–176.
    1. Purvis J.L., Lowenstein J.M. The relation between intra- and extramitochondrial pyridine nucleotides. J. Biol. Chem. 1961;236:2794–2803. - PubMed
    1. Wibom R., Lasorsa F.M., Töhönen V., Barbaro M., Sterky F.H., Kucinski T., Naess K., Jonsson M., Pierri C.L., Palmieri F., Wedell A. AGC1 deficiency associated with global cerebral hypomyelination. N. Engl. J. Med. 2009;361:489–495. - PubMed

Publication types