. 2019 Oct 23;104(2):239-255.e12.
doi: 10.1016/j.neuron.2019.07.014. Epub 2019 Aug 15.

CRISPR Interference-Based Platform for Multimodal Genetic Screens in Human iPSC-Derived Neurons

Affiliations

CRISPR Interference-Based Platform for Multimodal Genetic Screens in Human iPSC-Derived Neurons

Ruilin Tian et al. Neuron. .

Abstract

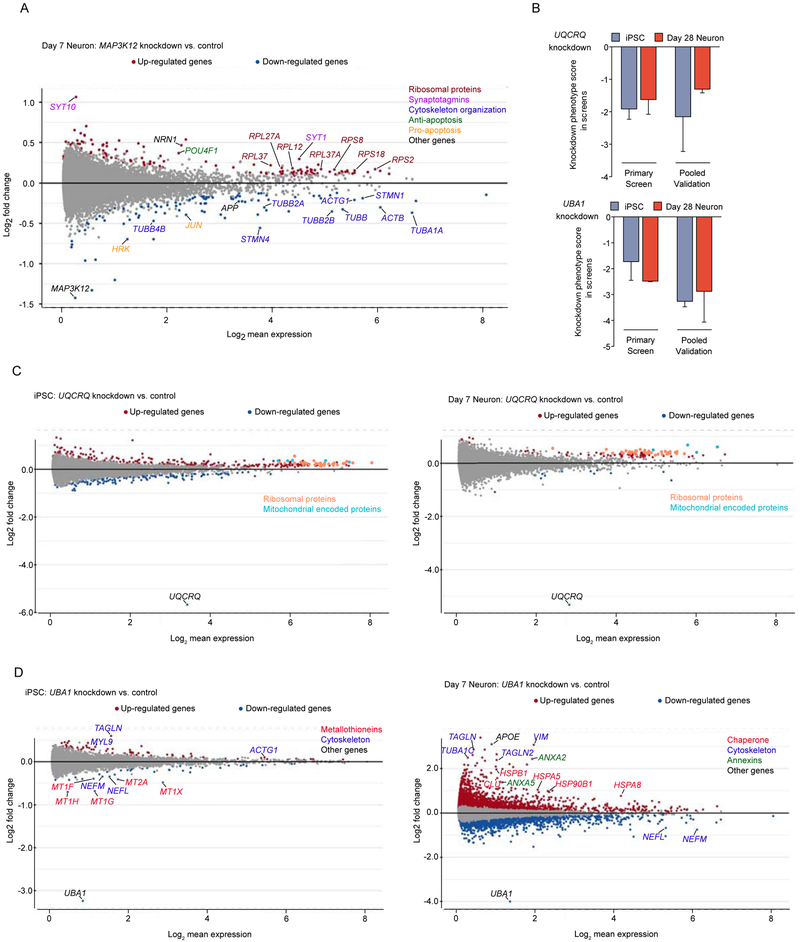
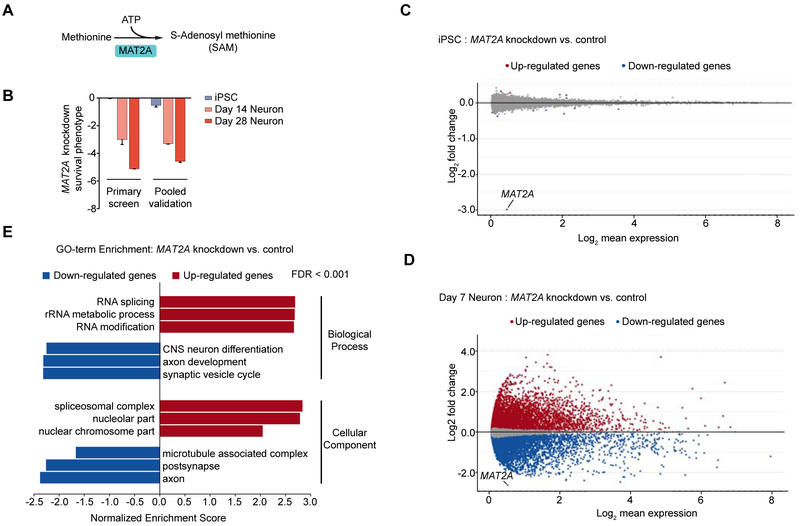
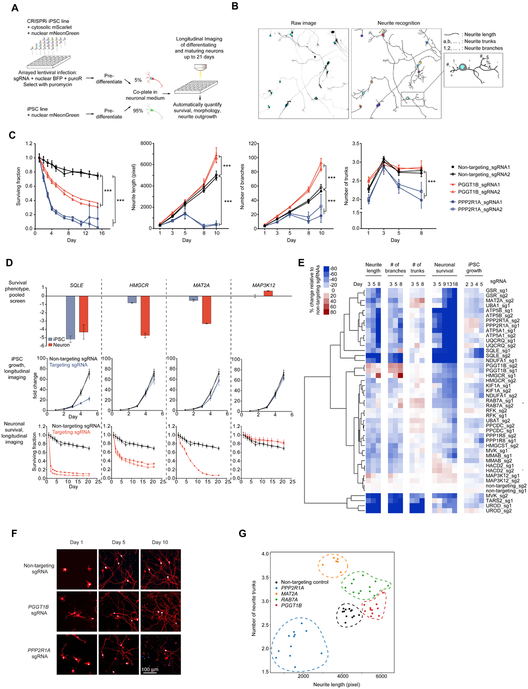
CRISPR/Cas9-based functional genomics have transformed our ability to elucidate mammalian cell biology. However, most previous CRISPR-based screens were conducted in cancer cell lines rather than healthy, differentiated cells. Here, we describe a CRISPR interference (CRISPRi)-based platform for genetic screens in human neurons derived from induced pluripotent stem cells (iPSCs). We demonstrate robust and durable knockdown of endogenous genes in such neurons and present results from three complementary genetic screens. First, a survival-based screen revealed neuron-specific essential genes and genes that improved neuronal survival upon knockdown. Second, a screen with a single-cell transcriptomic readout uncovered several examples of genes whose knockdown had strikingly cell-type-specific consequences. Third, a longitudinal imaging screen detected distinct consequences of gene knockdown on neuronal morphology. Our results highlight the power of unbiased genetic screens in iPSC-derived differentiated cell types and provide a platform for systematic interrogation of normal and disease states of neurons. VIDEO ABSTRACT.

Keywords: CRISPR interference; CRISPRi; CROP-seq; Perturb-Seq; essential genes; functional genomics; high-content microscopy; neuron; single-cell RNA sequencing; stem cell.


Conflict of interest statement

DECLARATIONS OF INTEREST

M.K. has filed a patent application related to CRISPRi and CRISPRa screening (PCT/US15/40449) and serves on the Scientific Advisory Board of Engine Biosciences.

Figures

Fig. 1.
Fig. 1.. Durable gene knockdown by CRISPR interference in human iPSC-derived neurons.
(A) Construct pC13N-dCas9-BFP-KRAB for the expression of CRISPRi machinery from the CLYBL safe-harbor locus: catalytically dead Cas9 (dCas9) fused to blue fluorescent protein (BFP) and the KRAB domain, under the control of the constitutive CAG promoter. (B) Timeline for sgRNA transduction, selection and recovery, doxycycline-induced neuronal differentiation and functional analysis of CRISPRi-i3N iPSCs. (C) Knockdown of the transferrin receptor (TFRC) in CRISPRi-i3N iPSCs and neurons. CRISPRi-i3N iPSCs were lentivirally infected with an sgRNA targeting TFRC or a non-targeting negative control sgRNA. Neuronal differentiation was induced by addition of doxycycline on Day -3 of the differentiation protocol and plating cells in neuronal medium on Day 0. Cells were harvested at different days for qPCR. After normalizing by GAPDH mRNA levels, ratios of TFRC mRNA were calculated for cells expressing the TFRC-targeting sgRNA versus the non-targeting sgRNA; mean ± SD (two biological replicates). (D, E) Knockdown of ubiquilin 2 (UBOLN2) in CRISPRi-i3N neurons. CRISPRi-i3N neurons infected with UBQLN2 sgRNA or non-targeting control sgRNA were harvested on Day 11 for qPCR (D) or Western blot (E) to quantify UBQLN2 knockdown at the mRNA level or protein level, respectively. (D) Relative UBQLN2 mRNA level was determined by normalizing UBQLN2 mRNA level by GAPDH. Relative UBOLN2 mRNA was calculated for cells expressing the UBOLN2-targeting sgRNA versus the non-targeting sgRNA; mean ± SD (three biological replicates). (E) Left, representative Western blot (Loading control β-Actin). Right, quantification of UBQLN2 protein levels normalized by β-Actin for cells with non-targeting sgRNAs or UBOLN2 sgRNA; mean ± SD (two independent Western blots). (F,G) Knockdown of progranulin (GRN) in CRISPRi-i3N neurons. CRISPRi-i3N neurons infected with GRN sgRNA or non-targeting control sgRNA were harvested on Day 11 for qPCR (F) or monitored by immunofluorescence (IF) microscopy on Day 5. (G) Relative GRN mRNA level normalized by GAPDH mRNA. Ratio of relative GRN mRNA for cells expressing the GRN-targeting sgRNA versus the non-targeting sgRNA; mean ± SD (three biological replicates). (G)Top row, non-targeting negative control sgRNA. Bottom row, sgRNA targeting progranulin. Progranulin signal (IF, green), neuronal marker Tuj1 (IF, red) and nuclear counterstain DRAQ5 (blue) are shown.
Fig. 2.
Fig. 2.. Massively parallel screen for essential genes in iPSCs and iPSC-derived neurons
(A) Strategy: CRISPRi-i3N iPSCs were transduced with a lentiviral sgRNA library targeting 2,325 genes (kinase and the druggable genome) and passaged as iPSCs or differentiated into glutamatergic neurons. Samples of cell populations were taken at different time points, and frequencies of cells expressing a given sgRNA were determined by next-generation sequencing. (B) Volcano plots summarizing knockdown phenotypes and statistical significance (Mann-Whitney U test) for genes targeted in the pooled screen. Top, proliferation/survival of iPSCs between Day 0 and Day 10. Bottom, survival of iPSC-derived neurons between Day 0 and Day 28. Dashed lines: cutoff for hit genes (FDR = 0.05, see Methods). (C) Correlation of hit gene strength (the product of phenotype and -log10(P value)) obtained for Day 10 iPSCs, and neurons harvested on Day 14, 21, or 28 post-induction. (D) Overlap between essential genes we identified here in iPSCs and neurons, and gold-standard essential genes in cancer cell lines (Hart et al., 2017). (E) Survival of neurons without treatment (black) or with various concentrations of Mevastatin (blue) quantified by microscopy; mean ± SD (six replicates). (F) Survival of neurons infected with non-targeting sgRNA (black) or HMGCR sgRNA (blue) or HMGCR sgRNA with various concentrations of mevalonate (pink to red) quantified by microscopy; mean ± SD (six replicates).
Figure 3.
Figure 3.. Pooled validation of hit genes from the primary screen
(A) Strategy for validation of hit genes. (B) Raw counts of sgRNAs from next-generation sequencing for biological replicates of Day 10 iPSCs (left) and Day 14 neurons (right) and coefficients of determination (R2), Each dot represents one sgRNA. (C) Knockdown phenotype scores from primary screens and validation screens for Day 10 iPSCs (left) and Day 14 neurons (right) and Pearson correlation coefficients (r). Each dot represents one gene. (D) Hierarchical clustering of different cell populations from the pooled validation screens based on the pairwise correlations of the knockdown phenotype scores of all genes. (E) Heatmap showing knockdown phenotype scores of the genes targeted in the validation screen (columns) in different cell populations (rows). Both genes and cell populations were hierarchically clustered based on Pearson correlation. Red asterisks mark genes selected for secondary screens (CROP-Seq and longitudinal imaging). (F) Gene knockdown phenotype scores of Day 14 neurons in monoculture (x-axis) and coculture with primary mouse astrocytes (y-axis) and Pearson correlation coefficient (r). Each dot represents one gene. Outlier genes, (differences > ± 2 SD from the mean differences) are labeled. (G) Strategy for degron-based inducible CRISPRi. Addition of trimethoprim (TMP) stabilizes the DHFR degron-tagged CRISPRi machinery. (H) Strategy to test whether hit genes control neuronal survival or earlier processes. (I) Knockdown phenotype scores for Day 14 neurons from screens in the inducible CRISPRi iPSCs, comparing populations with TMP added from the iPSC stage (x-axis) to populations without TMP added (y-axis). Each dot represents one gene. (J) Knockdown phenotype scores for Day 14 neurons from screens in the inducible CRISPRi iPSCs, comparing populations with TMP added from the iPSC stage (x-axis) to populations with TMP added from the neuronal stage (y-axis) and Pearson correlation coefficient (r). Each dot represents one gene. The outlier gene, PPP1R12C, is labeled.
Figure 4.
Figure 4.. CROP-Seq reveals transcriptome changes in iPSCs and iPSC-derived neurons induced by knockdown of survival-relevant genes
(A) Strategy for CROP-Seq experiments. (B) On-target knockdown efficiencies in the CROP-Seq screen were quantified for iPSCs (left) and Day 7 neurons (right). For each target gene, the 50% of cells with the strongest on-target knockdown were selected from all cells expressing sgRNAs targeting the gene; average expression of each target gene within these cells is compared to cells with non-targeting control sgRNAs. Error bars: 95% confidence intervals estimated by bootstrapping. (C) Changes in gene expression in response to CRISPRi knockdown of genes of interest in iPSCs (top) and Day 7 neurons (bottom). Each row represents one targeted gene; for each targeted gene, the top 20 genes with the most significantly altered expression were selected, and the merged set of these genes is represented by the columns. Rows and columns were clustered hierarchically based on Pearson correlation. Functionally related groups of differentially expressed genes are labeled.
Figure 5.
Figure 5.. Cell-type specific responses to gene knockdown on the transcriptomic level.
(A) Changes in transcript levels caused by MAP3K12 knockdown in neurons from the CROPSeq screen. Differentially expressed genes (padj < 0.05) in red (upregulation) or blue (downregulation), or other colors for genes discussed in the main text. (B) Knockdown phenotypes of UQCRQ (top) and UBA1 (bottom) in iPSCs and iPSC-derived neurons from the primary and validation screens. Survival phenotypes of 2 sgRNAs targeting the same gene, mean ± SD (C,D) Transcriptomic changes caused by knockdown of UQCRQ (C) or UBA1 (D) in iPSCs and neurons. Differentially expressed genes (padj < 0.05) in red (upregulation) or blue (downregulation), or other colors for genes discussed in the main text.
Figure 6.
Figure 6.. CROP-Seq reveals neuron-specific transcriptomic consequences of MAT2A knockdown
(A) Methionine adenosyl transferase 2a (MAT2A) catalyzes the production of the methyl donor S-adenosylmethionine (SAM) from methionine and ATP. (B) MAT2A is essential in neurons but not iPSCs. Knockdown phenotypes of MAT2A in iPSCs and neurons from the primary and validation screens. Survival phenotypes of 2 sgRNAs targeting MAT2A, mean ± SD. (C,D) Changes in transcript levels caused by MAT2A knockdown in iPSCs (C) and neurons (D) from the CROP-Seq screen. Differentially expressed genes (padj < 0.05) in red (upregulation) or blue (downregulation). (E) Gene Set Enrichment Analysis (GSEA) results for differentially expressed genes in iPSC-derived neurons with MAT2A knockdown compared to negative control sgRNAs. Significantly enriched GO terms for Biological Process and Cellular Component are shown.
Figure 7.
Figure 7.. Longitudinal imaging to track the effect of selected hit gene knockdown on iPSC growth, neuronal survival and neurite morphology
(A) Strategy for longitudinal imaging for neuronal survival and neurite morphology. (B) An example illustrating the image analysis pipeline. A raw image (left) containing sgRNA positive neurons expressing nuclear BFP (cyan) and cytosolic mScarlet (greyscale) were segmented and neurites were recognized (right). Different parameters, including neurite length, number of neurite trunks and number of neurite branches were quantified for individual neurons. Total number of sgRNA positive neurons was quantified for each image to monitor neuronal survival. (C) Quantification of knockdown effects of PGGT1B and PPP2R1A on neuronal survival, neurite length, number of branches and number of trunks. For each sgRNA, mean ± SD of replicate images is shown for each time point. *** significant differences compared to nontargeting sgRNA (P < 0.001, Student’s t-test). (D) Examples of hit genes whose survival phenotypes in the pooled screens were validated by longitudinal imaging. Top, knockdown phenotypes of SQLE, HMGCR, MAT2A and MAP3K12 in iPSCs and neurons from the validation screens. Average phenotypes of two sgRNAs targeting each gene; error bars represent SD. Growth curves of iPSCs (middle) and survival curves of neurons (bottom) with non-targeting sgRNAs and sgRNAs targeting SQLE, HMGCR, MAT2A or MAP3K12. Fold change (for iPSCs, middle) or surviving fraction (for neurons, bottom) of number of sgRNA-positive cells relative to Day 1 was calculated for each imaging well, mean ± SD for all replicate wells for one sgRNA are shown. (E) Changes of iPSC proliferation, neuronal survival and neurite morphology features relative to non-targeting sgRNAs at different time points (columns) induced by knockdown of different genes (rows). Rows were hierarchically clustered based on Pearson correlation. (F) Representative images of neurons with PGGT1B and PPP2R1A knockdown on Days 1, 5 and 10. Nuclear BFP is shown in blue, cytosolic mScarlet is shown in red. Scale bar, 100 μm. (G) Effect of gene knockdown on neurite length (x-axis) and number of neurite trunks (y-axis). Each dot indicates the mean measurements of all neurons in one image. Different target genes are shown in different colors, and replicate images for one target gene are grouped by dashed lines in the same colors.

Comment in

References

    1. Adamson B, Norman TM, Jost M, Cho MY, Nunez JK, Chen Y, Villalta JE, Gilbert LA, Horlbeck MA, Hein MY, et al. (2016). A Multiplexed Single-Cell CRISPR Screening Platform Enables Systematic Dissection of the Unfolded Protein Response. Cell 167, 1867–1882 e1821. - PMC - PubMed
    1. Adamson B, Smogorzewska A, Sigoillot FD, King RW, and Elledge SJ (2012). A genome-wide homologous recombination screen identifies the RNA-binding protein RBMX as a component of the DNA-damage response. Nat Cell Biol 14, 318–328. - PMC - PubMed
    1. Cantallops I, Haas K, and Cline HT (2000). Postsynaptic CPG15 promotes synaptic maturation and presynaptic axon arbor elaboration in vivo. Nature neuroscience 3, 1004–1011. - PubMed
    1. Carpenter AE, Jones TR, Lamprecht MR, Clarke C, Kang IH, Friman O, Guertin DA, Chang JH, Lindquist RA, Moffat J, et al. (2006). CellProfiler: image analysis software for identifying and quantifying cell phenotypes. Genome biology 7, R100. - PMC - PubMed
    1. Cerbini T, Funahashi R, Luo Y, Liu C, Park K, Rao M, Malik N, and Zou J.(2015). Transcription activator-like effector nuclease (TALEN)-mediated CLYBL targeting enables enhanced transgene expression and one-step generation of dual reporter human induced pluripotent stem cell (iPSC) and neural stem cell (NSC) lines. PloS one 10, e0116032. - PMC - PubMed

Publication types