Review
. 2016 Jul-Aug;7(4):569-589.
doi: 10.1002/wcc.407. Epub 2016 Jun 2.

Tambora 1815 as a test case for high impact volcanic eruptions: Earth system effects

Affiliations
Review

Tambora 1815 as a test case for high impact volcanic eruptions: Earth system effects

Christoph C Raible et al. Wiley Interdiscip Rev Clim Change. 2016 Jul-Aug.

Abstract

The eruption of Tambora (Indonesia) in April 1815 had substantial effects on global climate and led to the 'Year Without a Summer' of 1816 in Europe and North America. Although a tragic event-tens of thousands of people lost their lives-the eruption also was an 'experiment of nature' from which science has learned until today. The aim of this study is to summarize our current understanding of the Tambora eruption and its effects on climate as expressed in early instrumental observations, climate proxies and geological evidence, climate reconstructions, and model simulations. Progress has been made with respect to our understanding of the eruption process and estimated amount of SO2 injected into the atmosphere, although large uncertainties still exist with respect to altitude and hemispheric distribution of Tambora aerosols. With respect to climate effects, the global and Northern Hemispheric cooling are well constrained by proxies whereas there is no strong signal in Southern Hemisphere proxies. Newly recovered early instrumental information for Western Europe and parts of North America, regions with particularly strong climate effects, allow Tambora's effect on the weather systems to be addressed. Climate models respond to prescribed Tambora-like forcing with a strengthening of the wintertime stratospheric polar vortex, global cooling and a slowdown of the water cycle, weakening of the summer monsoon circulations, a strengthening of the Atlantic Meridional Overturning Circulation, and a decrease of atmospheric CO2. Combining observations, climate proxies, and model simulations for the case of Tambora, a better understanding of climate processes has emerged. WIREs Clim Change 2016, 7:569-589. doi: 10.1002/wcc.407 This article is categorized under: 1Paleoclimates and Current Trends > Paleoclimate.


Figures

Figure 1
Figure 1
Map of the Lombok–Sumbawa sector of the Sunda arc, Indonesia, showing the location of Tambora and Rinjani, the sites of the probably two largest eruptions of the last millennium. The map was generated using GeoMapApp©. (Reprinted with permission from Ref 145. Copyright 2015 John Wiley and Sons)
Figure 2
Figure 2
The 7 × 6 km wide and more than 1‐km deep summit caldera of Tambora created by the 1815 eruption. The 1815 eruptive products form the top of the caldera wall, as seen in the foreground. On the floor of the caldera lie an ephemeral lake and a small cone from a post‐1815 eruption. Photo by Katie Preece. (Reprinted with permission from Ref 145. Copyright 2015 John Wiley and Sons)
Figure 3
Figure 3
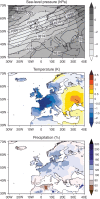
(Top): Sea‐level pressure (contour lines, in hPa) and anomalies (stippled lines; in hPa) for summer (June‐August) 1816 statistically reconstructed using station pressure series in combination with ship log book information from the northeastern North Atlantic (data from Küttel et al.40). (Middle): temperature anomalies (in °C) for summer 1816 statistically reconstructed using station temperature series only (data from Casty et al.32). (Bottom): precipitation (in % of the 1961–1990 average) for summer 1816 statistically reconstructed using station precipitation series only (data from Casty et al.32). Temperature and precipitation reconstructions in the outer margins of Europe and the Mediterranean are less certain due to the lack of meteorological station information for those areas. All anomalies are with respect to 1961–1990.
Figure 4
Figure 4
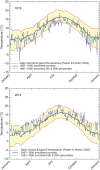
Daily Central England temperatures for each day of the year for 1816 and 2014. Absolute temperatures are shown in blue and these can be compared with average values based on the 1961–1990 period. Apart from averages, the panels for the 2 years also show a number of percentile ranges (5/95) to illustrate how unusual some days are with respect to the distribution of individual days based on the 1961–1990 period.
Figure 5
Figure 5
Ensemble mean NH temperature anomalies in a number of transient simulations for the past millennium. See Table 1 for a description of the models and volcanic forcing. Anomalies were calculated relative to the period 1770–1799.
Figure 6
Figure 6
Zonal mean column ozone changes [DU] by heterogeneous chemical reactions in an ensemble of atmosphere–ocean‐chemistry climate simulations for a 4× Pinatubo eruption in a present day (left) and preindustrial (right) atmosphere (modified from Muthers et al.103). Vertical dashed line indicates the beginning of the eruption. Significant anomalies with respect to an ensemble of control simulations are shown by stippling.
Figure 7
Figure 7
Simulated global climate evolution of different variables in a 10 member ensemble of simulations including all natural and anthropogenic forcing (black), a 10 member ensemble with only volcanic forcing including the Tambora and the preceding 1808/1809 eruption (red), and a 10 member ensemble with only volcanic forcing without the 1808/1809 eruption (blue). The all forcing simulations are started in 1751 from initial conditions taken from the COSMOS‐Mil experiments,146 the volcanic forcing only from a control run for 800 AD conditions. Lines indicate means. Shading indicates one standard error of the mean. Green dashed lines are the 5th–95th percentile intervals for signal occurrence in the control run (see second section). The inner dotted lines are the 10th–90th percentile intervals. Magenta vertical lines indicate the occurrence of the 1808/1809 and Tambora and Cosiguina eruptions. Bottom rectangles indicate periods when there is a significant difference between an ensemble (color same as for time series) and the other two. Positive surface net radiative flux anomalies correspond to increased downward flux. The unit of the ocean heat transport is 1 TW = 1012 W. (Reprinted with permission from Ref 81. Copyright 2013 John Wiley and Sons)

References

    1. Self S, Gertisser R, Thordarson T, Rampino MR, Wolff JA. Magma volume, volatile emissions, and stratospheric aerosols from the 1815 eruption of Tambora. Geophys Res Lett 2004, 31:L20608. doi:10.1029/2004GL020925. - DOI
    1. Crowley TJ, Obrochta SP, Liu J. Recent global temperature ‘plateau’ in the context of a new proxy reconstruction. Earth's Future 2014, 2:281–294. doi:10.1002/2013EF000216. - DOI
    1. Wilson R, D'Arrigo R, Buckley B, Buntgen U, Esper J, Frank D, Luckman B, Payette S, Vose R, Youngblut D. A matter of divergence: tracking recent warming at hemispheric scales using tree ring data. J Geophys Res 2007, 112:D17103.
    1. D'Arrigo R, Wilson R, Tudhope A. The impact of volcanic forcing on tropical temperatures during the past four centuries. Nat Geosci 2009, 2: 51–56. 10.1038/ngeo393. - DOI
    1. Stommel HM, Stommel E. The year without a summer. Sci Am 1979, 240:176–186.

LinkOut - more resources