. 2019 Aug;18(2):1117-1132.
doi: 10.3892/ol.2019.10444. Epub 2019 Jun 6.

Identification of key genes and pathways downstream of the β-catenin-TCF7L1 complex in pancreatic cancer cells using bioinformatics analysis

Affiliations

Identification of key genes and pathways downstream of the β-catenin-TCF7L1 complex in pancreatic cancer cells using bioinformatics analysis

Yi-Hang Yuan et al. Oncol Lett. 2019 Aug.

Abstract

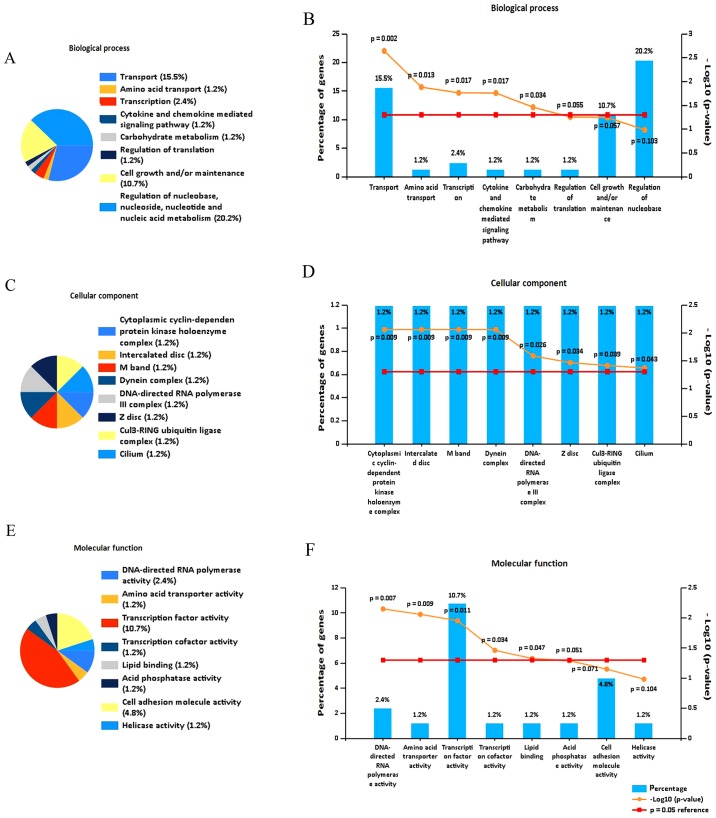
As a key component of the Wnt signaling pathway, the β-catenin-transcription factor 7 like 1 (TCF7L1) complex activates transcription and regulates downstream target genes that serve important roles in the pathology of pancreatic cancer. To identify associated key genes and pathways downstream of the β-catenin-TCF7L1 complex in pancreatic cancer cells, the current study used the gene expression profiles GSE57728 and GSE90926 downloaded from the Gene Expression Omnibus. GSE57728 is an array containing information regarding β-catenin knockdown and GSE90926 was developed by high throughput sequencing to provide information regarding TCF7L1 knockdown. Subsequently, differentially expressed genes (DEGs) were sorted separately and the shared 88 DEGs, including 37 upregulated and 51 downregulated genes, were screened. Clustering analysis of these DEGs was performed by heatmap analysis. Functional and pathway enrichment analyses were then performed using FunRich software and Database for Annotation, Visualization and Integrated Discovery, which revealed that the DEGs were predominantly enriched in terms associated with transport, transcription factor activity, and cytokine and chemokine mediated signaling pathway process. A DEG-associated protein-protein interaction (PPI) network, consisting of 58 nodes and 171 edges, was then constructed using Cytoscape software and the 15 genes with top node degrees were selected as the hub genes. Overall survival (OS) analysis of the 88 DEGs was performed and the relevant gene expression datasets were downloaded from The Cancer Genome Atlas. Consequently, three upregulated and seven downregulated genes were identified to be associated with prognosis. Furthermore, high expression levels of five downregulated genes, including CXCL5, CYP27C1, FUBP1, CDK14 and TRIM24, were associated with worse OS. In addition, CDK14 and TRIM24 were revealed as hub genes in the PPI network and both were confirmed to be involved in the Wnt/β-catenin pathway and phosphoinositide 3-kinase/Akt signaling pathway. Promoter analysis was also applied to the five downregulated DEGs associated with prognosis, which revealed that TCF7L1 may serve as a transcription factor of the DEGs. In conclusion, the genes and pathways identified in the current study may provide potential targets for the diagnosis and treatment of pancreatic cancer.

Keywords: differentially expressed genes; pancreatic cancer; potential targets; transcription factor 7 like 1; β-catenin.


Figures

Figure 1.
Figure 1.
Microarray data and validation. Ten shared genes, including CGN, CNN3, DZIP1, EGR1, FBXL17, MDM2, SRXN1, HMOX1 and TMEM2, were selected to confirm the results from microarray data downloaded from the Gene Expression Omnibus database. Microarray analysis was performed to detect the expression of genes of samples transfected with 20 nM control siRNA or β-catenin siRNA in the original microarray data downloaded from GEO database. Microarray analysis was also performed to measure the expression of genes in samples treated with 20 µM FH535 in our own microarray data. The data are presented as the means ± standard deviation. *P<0.05 vs. respective control. siRNA, small interfering RNA; KD, knockdown.
Figure 2.
Figure 2.
Identification of DEGS. (A and B) Identification of DEGs in the expression profiling TCF7L1 KD dataset GSE90926 and the β-catenin KD dataset GSE57728. A total of 88 shared DEGs were identified, including 37 upregulated and 51 downregulated DEGs. (C and D) Heatmaps of the shared 88 DEGs of the two GSE datasets were generated by R software. Red indicates upregulation and green indicates downregulation. DEG, differentially expressed gene; KD, knockdown; TCF7L1, transcription factor 7 like 1; siRNA, small interfering RNA; Rep, replication.
Figure 3.
Figure 3.
Functional and pathway enrichment analysis, and PPI network construction. Functional enrichment analysis of the identified DEGs was performed by FunRich with the following three parts: (A and B) Biological processes, (C and D) cell component and (E and F) molecular function. (G) GO analysis of identified DEGs using Database for Annotation, Visualization and Integrated Discovery. (H) Kyoto Encyclopedia of Genes and Genomes pathway analysis of identified DEGs using KOBAS. (I) PPI network of the DEGs consisting of 58 nodes and 171 edges, including 24 upregulated genes (red) and 34 downregulated genes (green). PPI, protein-protein interaction; DEG, differentially expressed gene; GO, gene ontology.
Figure 3.
Figure 3.
Functional and pathway enrichment analysis, and PPI network construction. Functional enrichment analysis of the identified DEGs was performed by FunRich with the following three parts: (A and B) Biological processes, (C and D) cell component and (E and F) molecular function. (G) GO analysis of identified DEGs using Database for Annotation, Visualization and Integrated Discovery. (H) Kyoto Encyclopedia of Genes and Genomes pathway analysis of identified DEGs using KOBAS. (I) PPI network of the DEGs consisting of 58 nodes and 171 edges, including 24 upregulated genes (red) and 34 downregulated genes (green). PPI, protein-protein interaction; DEG, differentially expressed gene; GO, gene ontology.
Figure 4.
Figure 4.
Overall survival analysis. Ten DEGs of the 88 DEGs were selected for overall survival analysis, including the upregulated genes CASK, IL32 and KRT7, and the downregulated genes CDK14, CXCL5, CYP27C1, DNAI1, FUBP1, TRIM24 and ZMAT1. Overall survival analysis was performed using R software. DEG, differentially expressed gene.
Figure 5.
Figure 5.
Promoter analysis of DEGs. Five DEGs including, CDK14, CYP27C1, FUBP1, CXCL5 and TRIM24 were analyzed using the Ensemble and Genomatix database to predict their interaction with the transcription factor TCF7L1, which belongs to the LEF-TCF family. The locations of the predicted TCF7L1 sites of each promoter are demonstrated with blue vertical line and numbers. +1 indicates the translation start site. Grey boxes represent exons. DEG, differentially expressed gene; TCF7L1, transcription factor 7 like 1.

References

    1. Siegel RL, Miller KD, Jemal A. Cancer statistics, 2015. CA Cancer J Clin. 2015;65:5–29. doi: 10.3322/caac.21254. - DOI - PubMed
    1. Siegel RL, Miller KD, Jemal A. Cancer statistics, 2018. CA Cancer J Clin. 2018;68:7–30. doi: 10.3322/caac.21442. - DOI - PubMed
    1. Oberstein PE, Olive KP. Pancreatic cancer: Why is it so hard to treat? Therap Adv Gastroenterol. 2013;6:321–337. doi: 10.1177/1756283X13478680. - DOI - PMC - PubMed
    1. Long J, Luo GP, Xiao ZW, Liu ZQ, Guo M, Liu L, Liu C, Xu J, Gao YT, Zheng Y, et al. Cancer statistics: Current diagnosis and treatment of pancreatic cancer in Shanghai, China. Cancer Lett. 2014;346:273–277. doi: 10.1016/j.canlet.2014.01.004. - DOI - PubMed
    1. Provenzano PP, Cuevas C, Chang AE, Goel VK, Von Hoff DD, Hingorani SR. Enzymatic targeting of the stroma ablates physical barriers to treatment of pancreatic ductal adenocarcinoma. Cancer Cell. 2012;21:418–429. doi: 10.1016/j.ccr.2012.01.007. - DOI - PMC - PubMed