Review
. 2019 Jul-Aug;6(4):e1353.
doi: 10.1002/wat2.1353. Epub 2019 May 26.

Causative classification of river flood events

Affiliations
Review

Causative classification of river flood events

Larisa Tarasova et al. WIREs Water. 2019 Jul-Aug.

Abstract

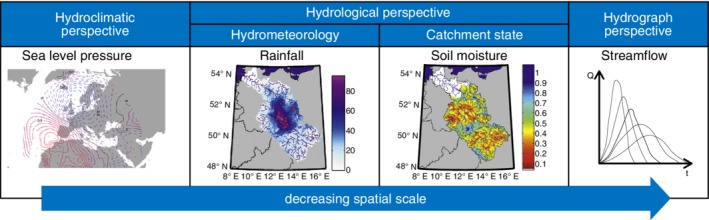
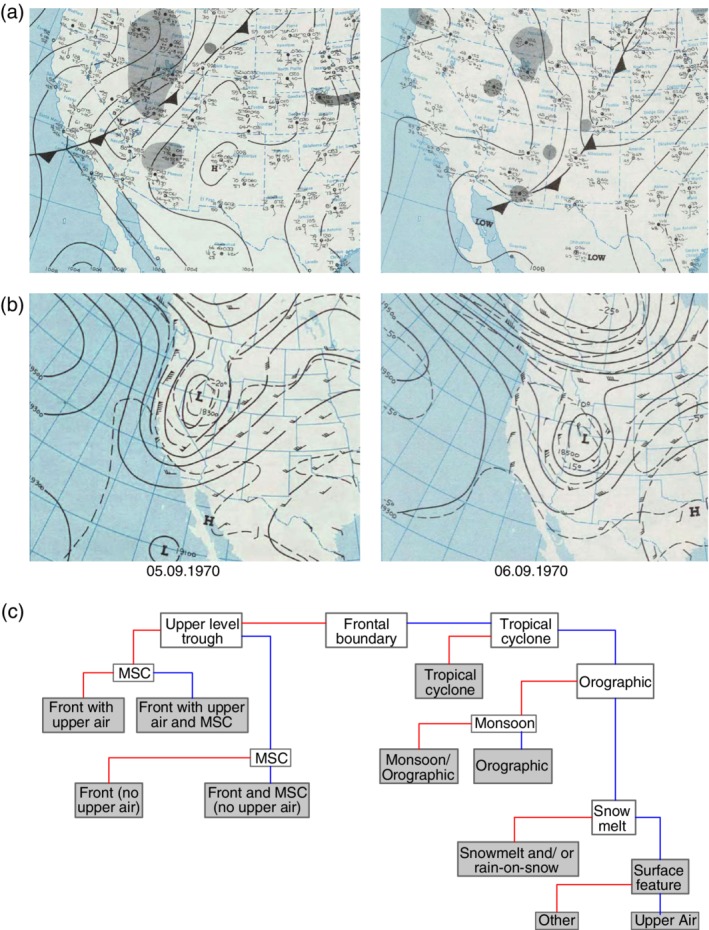
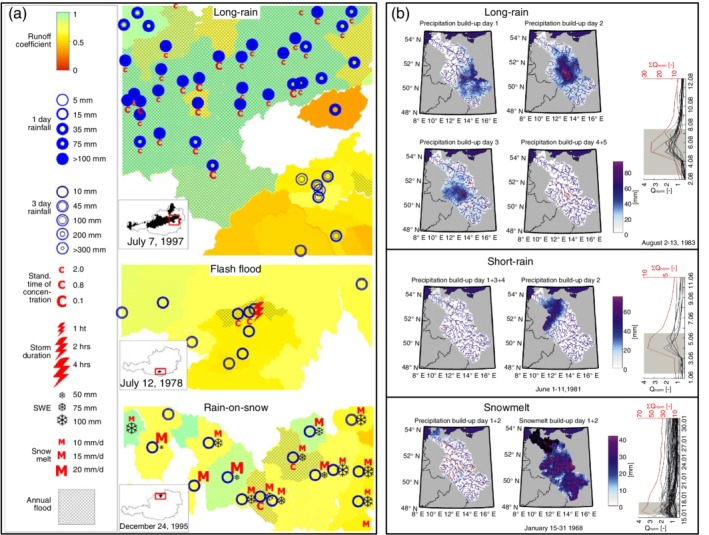
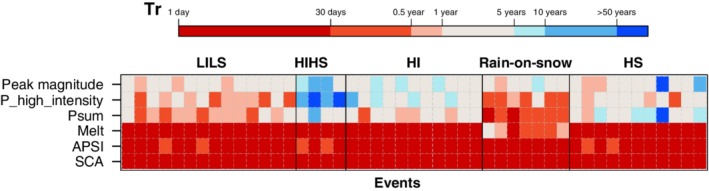
A wide variety of processes controls the time of occurrence, duration, extent, and severity of river floods. Classifying flood events by their causative processes may assist in enhancing the accuracy of local and regional flood frequency estimates and support the detection and interpretation of any changes in flood occurrence and magnitudes. This paper provides a critical review of existing causative classifications of instrumental and preinstrumental series of flood events, discusses their validity and applications, and identifies opportunities for moving toward more comprehensive approaches. So far no unified definition of causative mechanisms of flood events exists. Existing frameworks for classification of instrumental and preinstrumental series of flood events adopt different perspectives: hydroclimatic (large-scale circulation patterns and atmospheric state at the time of the event), hydrological (catchment scale precipitation patterns and antecedent catchment state), and hydrograph-based (indirectly considering generating mechanisms through their effects on hydrograph characteristics). All of these approaches intend to capture the flood generating mechanisms and are useful for characterizing the flood processes at various spatial and temporal scales. However, uncertainty analyses with respect to indicators, classification methods, and data to assess the robustness of the classification are rarely performed which limits the transferability across different geographic regions. It is argued that more rigorous testing is needed. There are opportunities for extending classification methods to include indicators of space-time dynamics of rainfall, antecedent wetness, and routing effects, which will make the classification schemes even more useful for understanding and estimating floods. This article is categorized under:Science of Water > Water ExtremesScience of Water > Hydrological ProcessesScience of Water > Methods.

Keywords: flood genesis; flood mechanisms; flood typology; historical floods; hydroclimatology of floods.


Conflict of interest statement

The authors have declared no conflicts of interest for this article.

Figures

Figure 1
Figure 1
Different perspectives and scales of existing causative classifications of river flood events: Regional to subcontinental scale of hydroclimatic classifications; catchment to regional scale of hydrological perspective based on hydrometeorological forcing related to catchment and catchment state; and catchment scale of hydrograph‐based classifications. (Reprinted with permission from Bárdossy and Pegram (2011). Copyright 2011 Wiley and Nied et al. (2014). Copyright 2014 CC BY)
Figure 2
Figure 2
(a) Surface weather maps and (b) corresponding 500 hPa charts (NOAA Central Library Data Imaging Project, https://library.noaa.gov/Collections/Digital‐Collections/US‐Daily‐Weather‐Maps) for September 5–6, 1970 representing hydroclimatic sequence which produced widespread flooding in the Gila River Basin, Arizona (Hirschboeck, 1987); and (c) flow chart for determining synoptic and mesoscale environment (MCS—mesoscale convective system; upper air—upper‐level trough or closed low system) corresponding to flood events in contiguous USA. White boxes represent atmospheric features and factors used for classification; gray boxes represent determined flood type. Red and blue lines correspond, respectively, to presence and absence of certain feature. (Panel c Reprinted with permission from Ashley and Ashley (2008). Copyright 2007 Wiley)
Figure 3
Figure 3
An example of diagnostic maps for classification of river flood events based on expert judgment according to (a) Merz and Blöschl (2003): Diagnostic maps of event‐ and catchment‐averaged indicators (event runoff coefficient, 1‐day and 3‐day rainfall depth, standardized time of concentration, storm duration for documented convective thunderstorms, snow water equivalent [SWE], snowmelt amount) on the day of occurrence of various annual flood events in Austria. (Reprinted with permission from Merz and Blöschl (2003). Copyright 2003 Wiley); (b) Nied et al. (2014): Daily diagnostic maps of build‐up period for exemplarily flood events in the Elbe catchment. The intensity of blue color indicates daily precipitation or snowmelt amount [mm]. Affected gauges are indicated by the red dots. The hydrographs (black lines) in the left panel correspond to observed discharge at the affected gauges normalized by their 2‐year flood. Red line corresponds to the discharge sum. Gray rectangular indicates the build‐up period of flood event. (Reprinted with permission from Nied et al. (2014). Copyright 2014 CC BY)
Figure 4
Figure 4
Empirical return periods (Tr) of parameter event values for different flood‐precursor storylines (i.e., hydrometeorological and catchment state conditions leading to flood event): LILS low intensity—low sums; HIHS high intensity—high sums; HI high intensity; rain‐on‐snow; HS high sums. Each row corresponds to return period of respective parameter: APSI—antecedent precipitation and snowmelt index; SCA—snow‐covered area; Psum—volume of rainfall; P_high_intensity—95th quantile of spatial precipitation distribution on the day with maximum rainfall amount; melt—accumulated snowmelt over the course of the event; peak magnitude—Peak discharge of respective flood event. Each column corresponds to an individual flood event. (Reprinted with permission from Keller et al. (2018). Copyright 2017 Wiley)
Figure 5
Figure 5
Distinction of flood events into different event types by maximizing correlation between event volume and peak discharge for the Holtemme River, Germany. Type 1, 2, and 3 correspond to short, long, and very long event time scales (Gaál et al., 2012). (Reprinted with permission from Fischer (2018). Copyright 2018 Taylor & Francis)

References

    1. Alila, Y. , & Mtiraoui, A. (2002). Implications of heterogeneous flood‐frequency distributions on traditional stream‐discharge prediction techniques. Hydrological Processes, 16(5), 1065–1084. 10.1002/hyp.346 - DOI
    1. Apel, H. , Merz, B. , & Thieken, A. H. (2009). Influence of dike breaches on flood frequency estimation. Computers and Geosciences, 35(5), 907–923. 10.1016/j.cageo.2007.11.003 - DOI
    1. Archer, D. R. (1989). Flood wave attenuation due to channel and flood plain storage and effect on flood frequency In Beven K. & Carling P. (Eds.), Floods: Hydrological, sedimentological and geomorphological implications (pp. 37–46). Chichester, UK: John Wiley & Sons.
    1. Ashley, S. T. , & Ashley, W. S. (2008). The storm morphology of deadly flooding events in the United States. International Journal of Climatology, 28, 493–503. 10.1002/joc - DOI
    1. Baker, V. R. (1998). Paleohydrology and the hydrological sciences In Benito G., Baker V. R., & Gregory K. J. (Eds.), Palaeohydrology and environmental change (pp. 1–10). Chichester; New York: John Wiley & Sons.

LinkOut - more resources