

Mapping physiology: biophysical mechanisms define scales of climate change impacts
- PMID: 31423312
- PMCID: PMC6691486
- DOI: 10.1093/conphys/coz028
Mapping physiology: biophysical mechanisms define scales of climate change impacts
Abstract
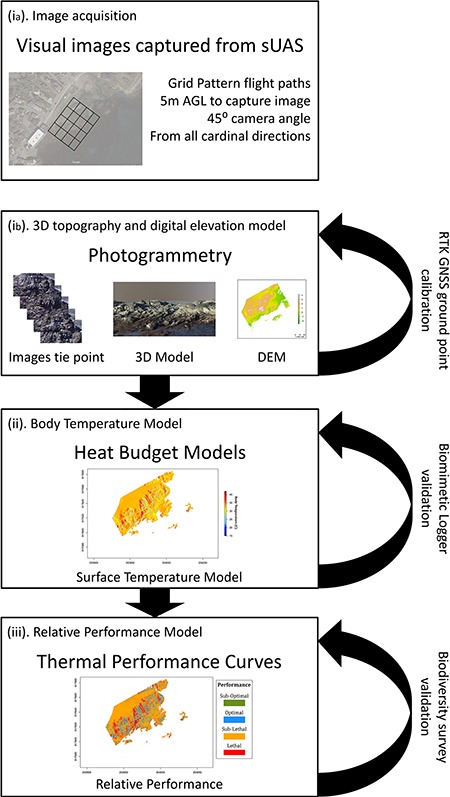
The rocky intertidal zone is a highly dynamic and thermally variable ecosystem, where the combined influences of solar radiation, air temperature and topography can lead to differences greater than 15°C over the scale of centimetres during aerial exposure at low tide. For most intertidal organisms this small-scale heterogeneity in microclimates can have enormous influences on survival and physiological performance. However, the potential ecological importance of environmental heterogeneity in determining ecological responses to climate change remains poorly understood. We present a novel framework for generating spatially explicit models of microclimate heterogeneity and patterns of thermal physiology among interacting organisms. We used drone photogrammetry to create a topographic map (digital elevation model) at a resolution of 2 × 2 cm from an intertidal site in Massachusetts, which was then fed into to a model of incident solar radiation based on sky view factor and solar position. These data were in turn used to drive a heat budget model that estimated hourly surface temperatures over the course of a year (2017). Body temperature layers were then converted to thermal performance layers for organisms, using thermal performance curves, creating 'physiological landscapes' that display spatially and temporally explicit patterns of 'microrefugia'. Our framework shows how non-linear interactions between these layers lead to predictions about organismal performance and survivorship that are distinct from those made using any individual layer (e.g. topography, temperature) alone. We propose a new metric for quantifying the 'thermal roughness' of a site (RqT, the root mean square of spatial deviations in temperature), which can be used to quantify spatial and temporal variability in temperature and performance at the site level. These methods facilitate an exploration of the role of micro-topographic variability in driving organismal vulnerability to environmental change using both spatially explicit and frequency-based approaches.
Keywords: Biomechanics; ecophysiology; environmental heterogeneity; intertidal zone; microclimate; microhabitat.
Figures


Similar articles
-
Fine-Scale Microclimatic Variation Can Shape the Responses of Organisms to Global Change in Both Natural and Urban Environments.Integr Comp Biol. 2016 Jul;56(1):45-61. doi: 10.1093/icb/icw016. Epub 2016 Apr 23. Integr Comp Biol. 2016. PMID: 27107292 Review.
-
Exposure to solar radiation drives organismal vulnerability to climate: Evidence from an intertidal limpet.J Therm Biol. 2016 Apr;57:92-100. doi: 10.1016/j.jtherbio.2016.03.002. Epub 2016 Mar 9. J Therm Biol. 2016. PMID: 27033044
-
The Vulnerability of Tropical Ectotherms to Warming Is Modulated by the Microclimatic Heterogeneity.Integr Comp Biol. 2016 Jul;56(1):85-97. doi: 10.1093/icb/icw014. Integr Comp Biol. 2016. PMID: 27371561
-
Spatial heterogeneity of temperature across alpine boulder fields in New South Wales, Australia: multilevel modelling of drivers of microhabitat climate.Int J Biometeorol. 2016 Jul;60(7):965-76. doi: 10.1007/s00484-015-1089-4. Epub 2015 Oct 29. Int J Biometeorol. 2016. PMID: 26511483
-
There is plenty of room at the bottom: microclimates drive insect vulnerability to climate change.Curr Opin Insect Sci. 2020 Oct;41:63-70. doi: 10.1016/j.cois.2020.07.001. Epub 2020 Jul 16. Curr Opin Insect Sci. 2020. PMID: 32777713 Review.
Cited by
-
The impacts of climate change on the biomechanics of animals: Themed Issue Article: Biomechanics and Climate Change.Conserv Physiol. 2020 Jan 13;8(1):coz102. doi: 10.1093/conphys/coz102. eCollection 2020. Conserv Physiol. 2020. PMID: 31976075 Free PMC article. Review.
-
Rocks of different mineralogy show different temperature characteristics: implications for biodiversity on rocky seashores.PeerJ. 2021 Jan 26;9:e10712. doi: 10.7717/peerj.10712. eCollection 2021. PeerJ. 2021. PMID: 33569252 Free PMC article.
-
Adaptive Emergence Patterns of Spot-Tailed Earless Lizards: Influence of UV Light and Temperature on Diel Activity.Ecol Evol. 2025 Jul 17;15(7):e71814. doi: 10.1002/ece3.71814. eCollection 2025 Jul. Ecol Evol. 2025. PMID: 40678350 Free PMC article.
-
The importance of fine-scale refugia and behavioral thermoregulation in the resilience of intertidal limpet populations.Ecology. 2025 Jul;106(7):e70155. doi: 10.1002/ecy.70155. Ecology. 2025. PMID: 40708273 Free PMC article.
-
How can physiology best contribute to wildlife conservation in a warming world?Conserv Physiol. 2023 Jun 3;11(1):coad038. doi: 10.1093/conphys/coad038. eCollection 2023. Conserv Physiol. 2023. PMID: 37287992 Free PMC article.
References
-
- Angilletta MJ. (2006) Estimating and comparing thermal performance curves. J Therm Biol 31: 541–545.
-
- Angilletta MJ. (2009) Thermal Adaptation: A Theoretical and Empirical synthesis. Oxford University Press, New York
-
- Armstrong JB, Schindler DE, Ruff CP, Brooks GT, Bentley KE, Torgersen CE (2013) Diel horizontal migration in streams: juvenile fish exploit spatial heterogeneity in thermal and trophic resources. Ecology 94: 2066–2075. - PubMed
-
- Augustine S, Kooijman S (2019) A new phase in DEB research. J Sea Res 143: 1–7.
-
- Barton MG, Terblanche JS (2014) Predicting performance and survival across topographically heterogeneous landscapes: the global pest insect Helicoverpa armigera (Hubner, 1808) (Lepidoptera: Noctuidae). Austral Entomol 53: 249–258.
LinkOut - more resources
Full Text Sources
