. 2020 Feb;83(2):505-520.
doi: 10.1002/mrm.27943. Epub 2019 Aug 18.

Efficient triple-VENC phase-contrast MRI for improved velocity dynamic range

Affiliations

Efficient triple-VENC phase-contrast MRI for improved velocity dynamic range

Liliana E Ma et al. Magn Reson Med. 2020 Feb.

Abstract

Purpose: To evaluate the utility of an efficient triple velocity-encoding (VENC) 4D flow MRI implementation to improve velocity unwrapping of 4D flow MRI data with the same scan time as an interleaved dual-VENC acquisition.

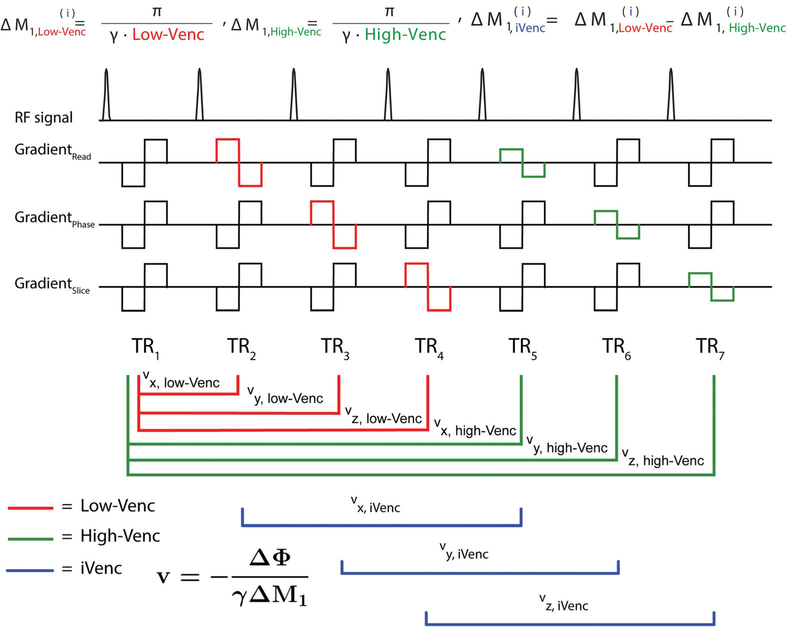
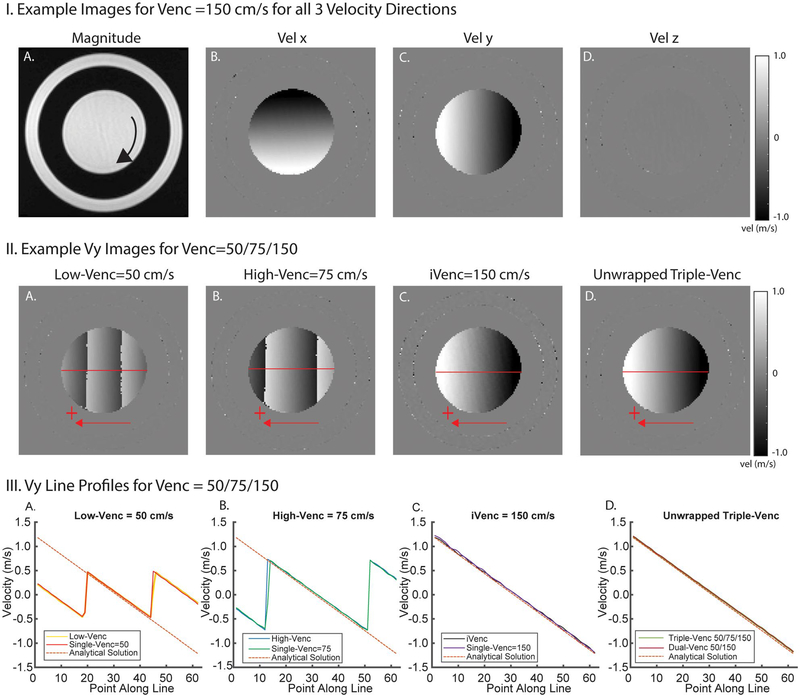
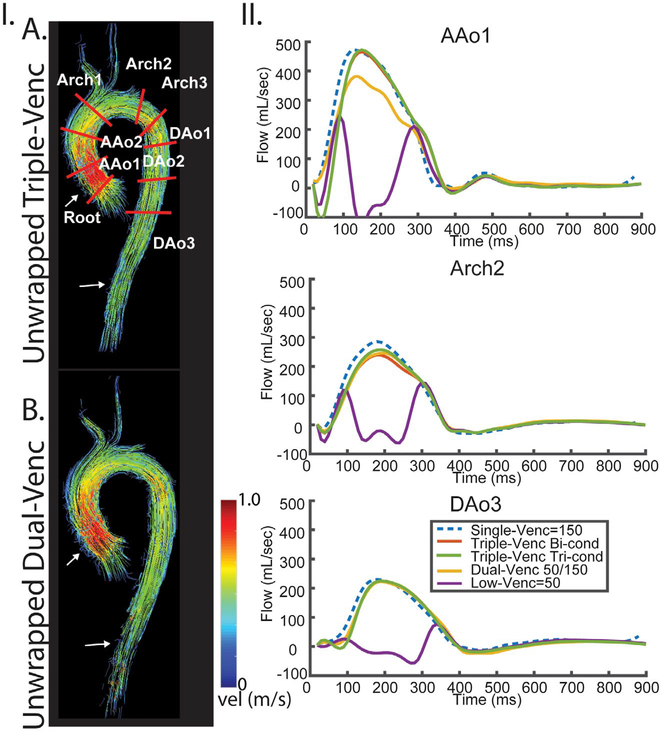
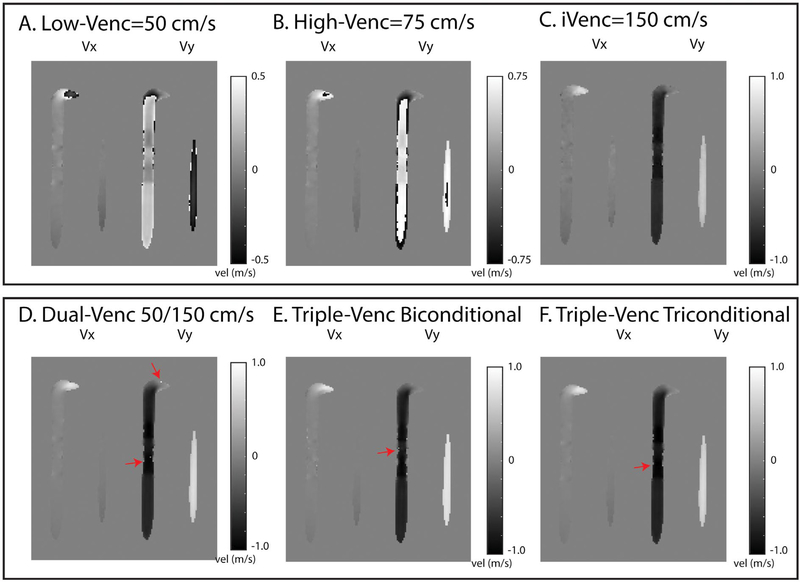
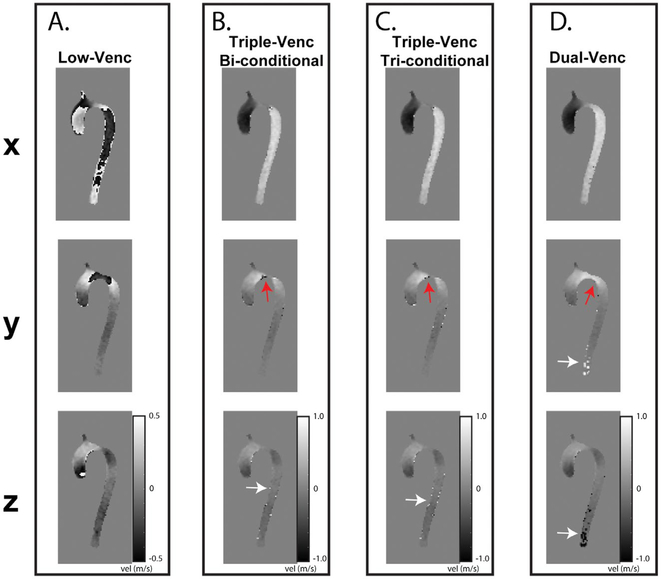
Methods: A balanced 7-point acquisition was used to derive 3 sets of 4D flow images corresponding to 3 different VENCs. These 3 datasets were then used to unwrap the aliased lowest VENC into a minimally aliased, triple-VENC dataset. Triple-VENC MRI was evaluated and compared with dual-VENC MRI over 3 different VENC ranges (50-150, 60-150, and 60-180 cm/s) in vitro in a steadily rotating phantom as well as in a pulsatile flow phantom. In vivo, triple-VENC data of the thoracic aorta were also evaluated in 3 healthy volunteers (2 males, 26-44 years old) with VENC = 50/75/150 cm/s. Two triple-VENC (triconditional and biconditional) and 1 dual-VENC unwrapping algorithms were quantitatively assessed through comparison to a reference, unaliased, single-VENC scan.

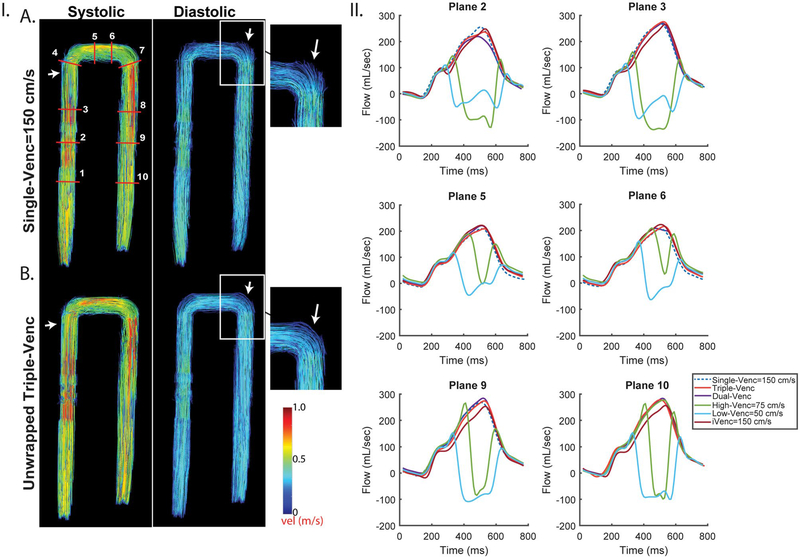
Results: Triple-VENC 4D flow constant rotation phantom results showed high correlation with the analytical solution (intraclass correlation coefficient = 0.984-0.995, P < .001) and up to a 61% reduction in velocity noise compared with the corresponding single-VENC scans (VENC = 150, 180 cm/s). Pulsatile flow phantom experiments demonstrated good agreement between triple-VENC and single-VENC acquisitions (peak flow < 0.8% difference; peak velocity < 11.7% difference). Triconditional triple-VENC unwrapping consistently outperformed dual-VENC unwrapping, correctly unwrapping more than 83% and 46%-66% more voxels in vitro and in vivo, respectively.

Conclusion: Triple-VENC 4D flow MRI adds no additional scan time to dual-VENC MRI and has the potential for improved unwrapping to extend the velocity dynamic range beyond dual-VENC methods.

Keywords: 4D flow; VENC(s); cardiac MRI; velocity dynamic range; velocity sensitivity; velocity to noise ratio.


Figures

FIGURE 1
FIGURE 1
Triple velocity-encoded sensitivity (VENC) acquisition and reconstruction. Triple-VENC phase-contrast (PC) MRI sequence with a shared reference scan between low-VENC and high-VENC in the read, phase, and slice (i = x, y, z) directions, and combined use of low-VENC and high-VENC scans for reconstruction of the implicit VENC (iVENC) data. Imaging gradients are omitted for clarity. The red lines indicate the paired scans used to calculate low-VENC phase-difference images; the green lines indicate the high-VENC pairs; and the blue lines indicate the iVENC pairs. The first moments of each TR are described for all VENCs
FIGURE 2
FIGURE 2
Example rotation phantom images and results. I, Example images for all 3 velocity directions (Vx, Vy, Vz) showing velocity gradients in in-plane velocity encoding directions (x, y). II, Example Vx images from a triple-VENC acquisition. Low-VENC and high-VENC images show different degrees of velocity aliasing. The unwrapped image has the benefit of decreased velocity noise from the low-VENC image and no velocity aliasing. This reduced noise can be seen in comparing the triple-VENC and iVENC images (IIC,D). III, Velocity profiles along a horizontal line (illustrated in red) in the Vx images, showing the velocity values in reconstructed low-VENC, high-VENC, and iVENC phase difference images compared with their corresponding single-VENC acquisitions. Unwrapped triple-VENC velocity profiles are also in agreement with those of the corresponding dual-VENC acquisition
FIGURE 3
FIGURE 3
Pulsatile in vitro results for VENC set 50/75/150 cm/s. I, Systolic and diastolic streamlines for a single-VENC acquisition (A) and the triple-VENC (B) dataset. Systolic streamlines show reduction in velocity noise in the unwrapped triple-VENC (triconditional) compared with single-VENC datasets (white arrows, zoomed in); however, this effect is seen more prominently in diastole, where the streamlines are noticeably more collinear at the more complex bends in the phantom. IA, Location of ten 2D analysis planes for quantification of peak velocities and flow time curves. White rectangle indicates location evaluated for number of voxels unwrapped in Table 3. II, Flow time curves over 6 representative planes show agreement between the iVENC unwrapped triple-VENC and unwrapped dual-VENC, and the corresponding single-VENC scan
FIGURE 4
FIGURE 4
Systolic streamlines comparing the triple-VENC triconditional dataset (A, 50/70/150 cm/s) and dual-VENC acquisition (B, 50/150 cm/s) in 1 healthy volunteer. I, streamlines show improved integrity in the ascending aorta and descending aorta (white arrows) in the triple-VENC dataset compared with dual-VENC. IA, Placement of 9 planes along the aorta. II, Flow curves for 3 representative planes depict agreement of the triple-VENC dataset with the single-VENC flow curves. Abbreviations: AAo, ascending aorta; and DAo, descending aorta
FIGURE 5
FIGURE 5
I, Rotation phantom Bland-Altman (A,C) and correlation (B,D) analysis results of the absolute velocity for unwrapped triple-VENC (TV) 50/75/150 and 60/100/150 data using the triconditional algorithm. Red triangles represent the x-velocities plotted along a vertical line, and black circles represent the y-velocities. Red and black lines represent the lines calculated by orthogonal regression for x and y velocities, respectively. Green lines represent a line with slope of 1 (perfect correlation). II, Noise analysis for all 3 sets of VENCs relative to a single-VENC scan corresponding to the iVENC. Noise values are normalized to the separate single-VENC scan noise values. A, experiments using a maximum VENC of 150 cm/s. B, Experiments using a maximum VENC of 180 cm/s
FIGURE 6
FIGURE 6
Evaluation of dual-VENC and triple-VENC unwrapping algorithms. A-C, Representative 50/75/150 cm/s phase-difference images. All phase-difference images are shown for the same slice location and time point. D, The dual-VENC, triple-VENC biconditional (E) and triple-VENC triconditional (F) datasets shows successful unwrapping of most voxels, but some residual ones near the vessel wall (red arrows). Red arrows depict residual aliasing in the dual-VENC and triple-VENC unwrapped datasets
FIGURE 7
FIGURE 7
In vivo application of dual-VENC and triple-VENC unwrapping algorithms for the representative 50/75/150 cm/s phase-difference images. All phase-difference images are shown for the same slice location and time point. Low-VENC data show significant velocity aliasing throughout the volunteer. The unwrapped dual-VENC dataset indicates more incorrect unwrapping in the descending aorta than the triple-VENC algorithms (white arrows), which shows successful unwrapping of most voxels, but some residual ones near the vessel wall (red arrows)

References

    1. Schnell S, Ansari SA, Wu C, et al. Accelerated dual-VENC 4D flow MRI for neurovascular applications. J Magn Reson Imaging. 2017;46:102–114. - PMC - PubMed
    1. Buonocore MH. Blood flow measurement using variable velocity encoding in the RR interval. Magn Reson Med. 1993;29:790–795. - PubMed
    1. Callaghan FM, Kozor R, Sherrah AG, et al. Use of multi-velocity encoding 4D flow MRI to improve quantification of flow patterns in the aorta. J Magn Reson Imaging. 2016;43:352–363. - PubMed
    1. Giese D, Kabbasch C, Hedderich D, Maintz D, Liebig T, Bunck A. The use of kt PCA accelerated dual-VENC 3D flow MRI to assess hemodynamics before and after flow diverting stent implantation in cerebral aneurysm models. J Cardiovasc Magn Reson. 2014;16:W29.
    1. Nilsson A, Bloch KM, Carlsson M, Heiberg E, Ståhlberg F. Variable velocity encoding in a three-dimensional, three-directional phase contrast sequence: evaluation in phantom and volunteers. J Magn Reson Imaging. 2012;36:1450–1459. - PubMed

Publication types