. 2019 Aug 20;8(16):e011006.
doi: 10.1161/JAHA.118.011006. Epub 2019 Aug 19.

Systemic Inflammation Rapidly Induces Reversible Atrial Electrical Remodeling: The Role of Interleukin-6-Mediated Changes in Connexin Expression

Affiliations

Systemic Inflammation Rapidly Induces Reversible Atrial Electrical Remodeling: The Role of Interleukin-6-Mediated Changes in Connexin Expression

Pietro Enea Lazzerini et al. J Am Heart Assoc. .

Abstract

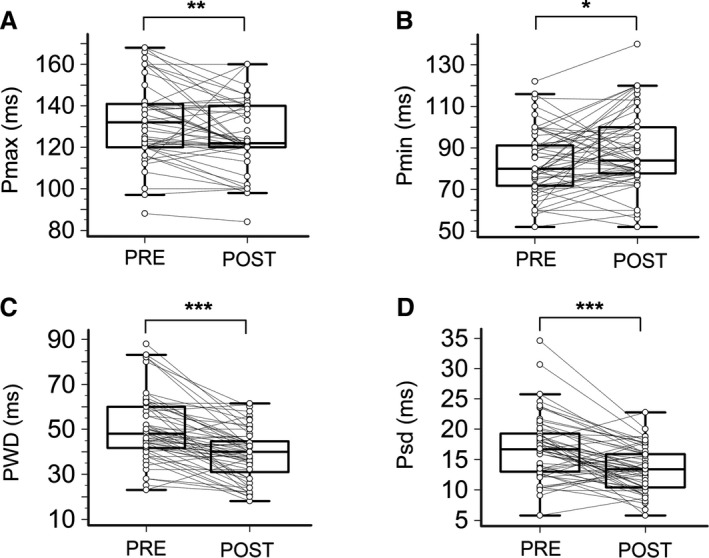
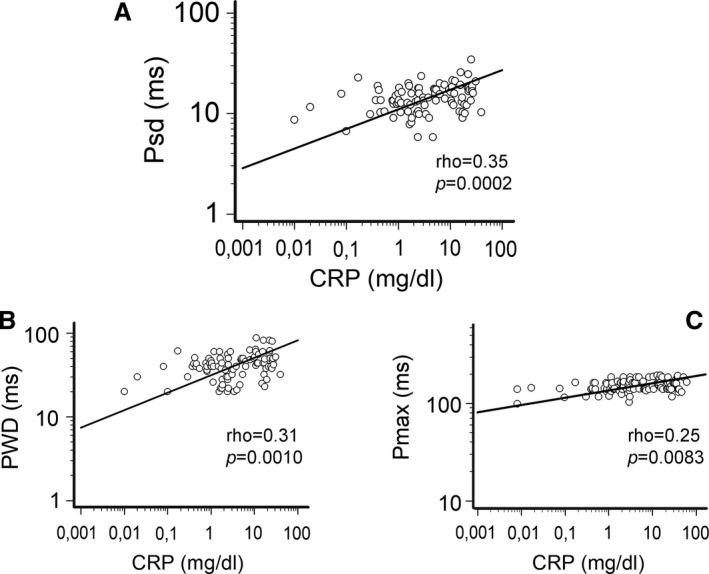
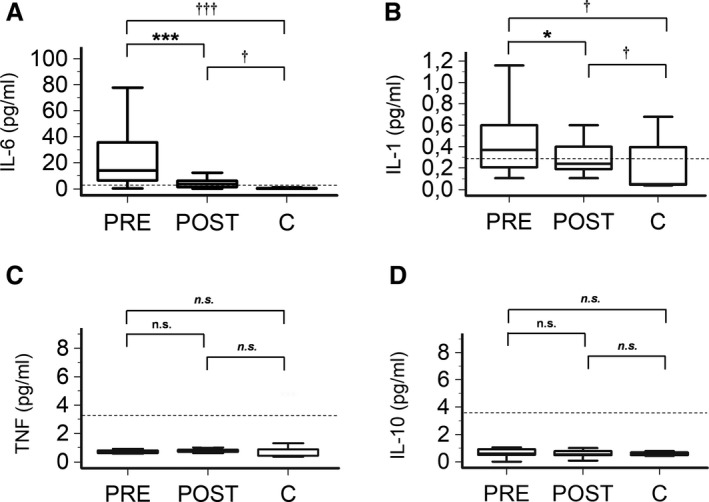
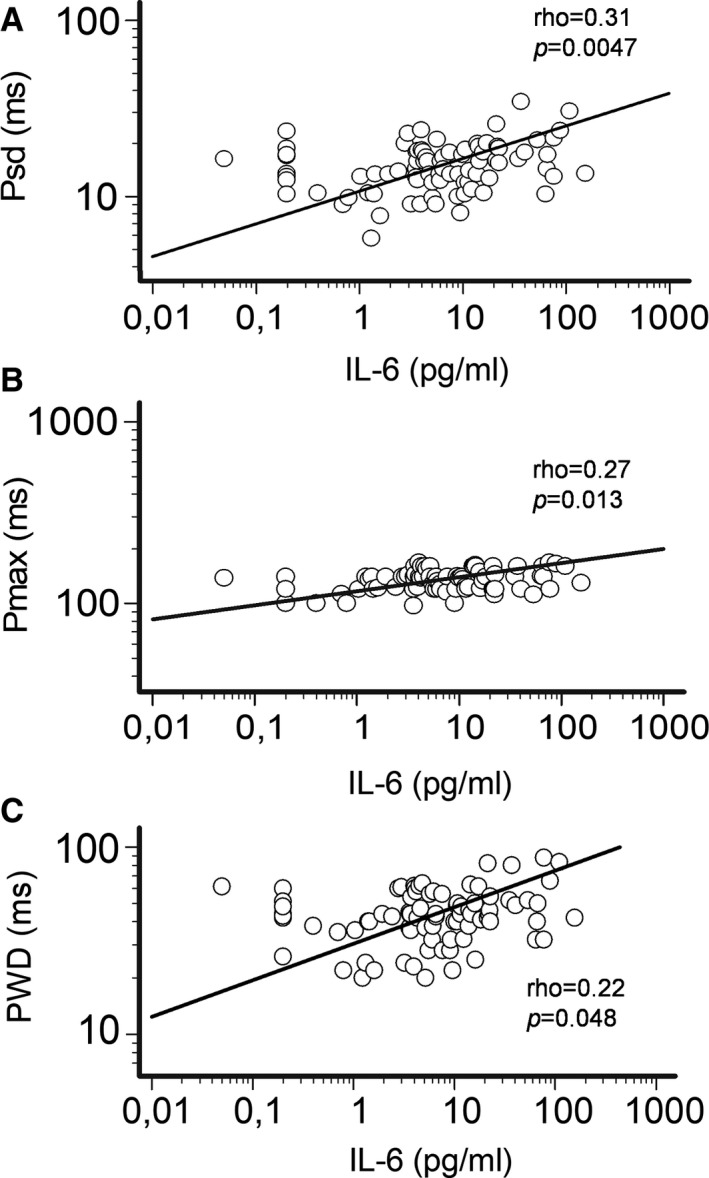
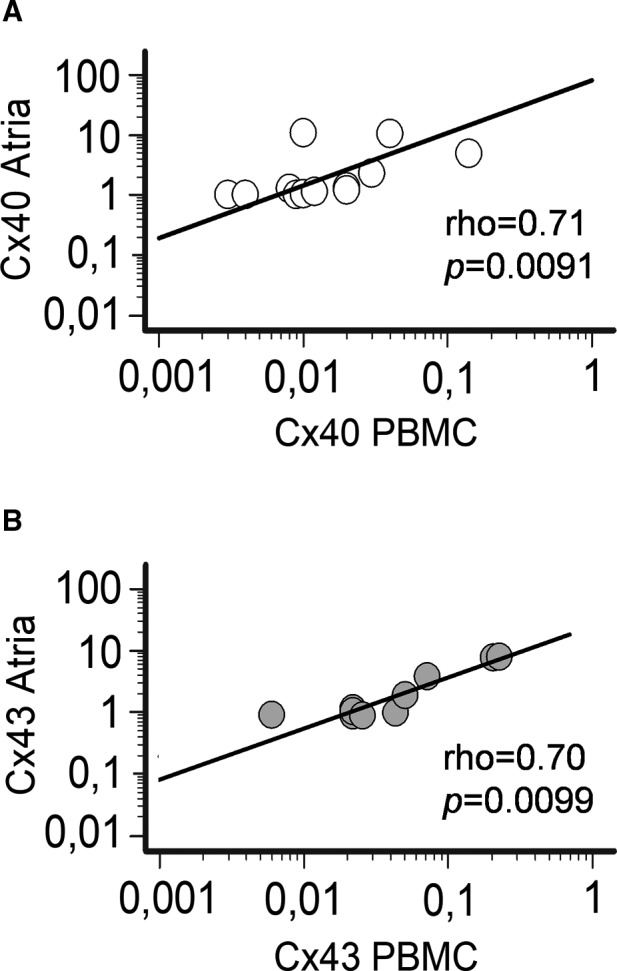
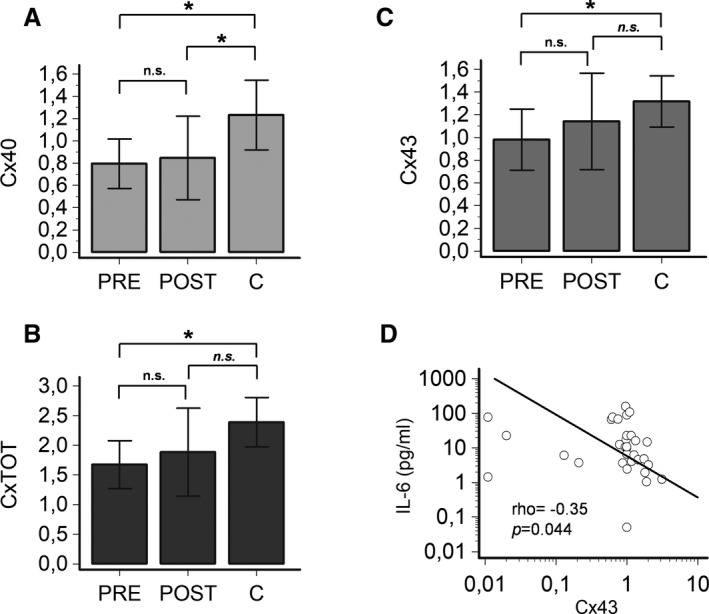
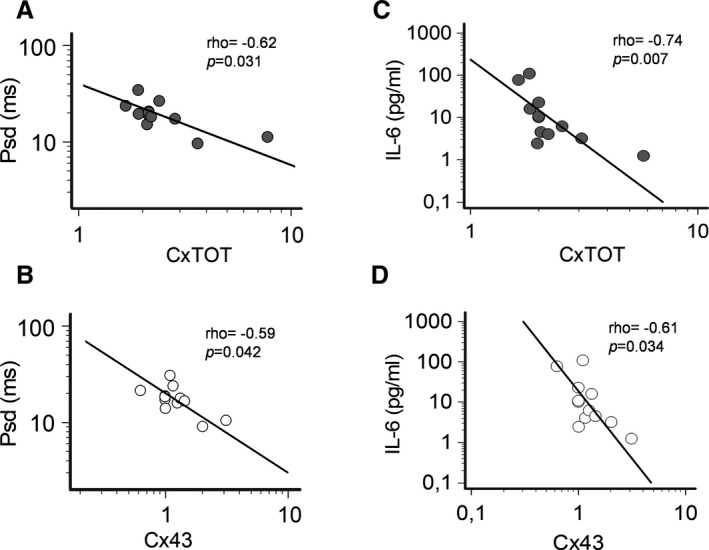
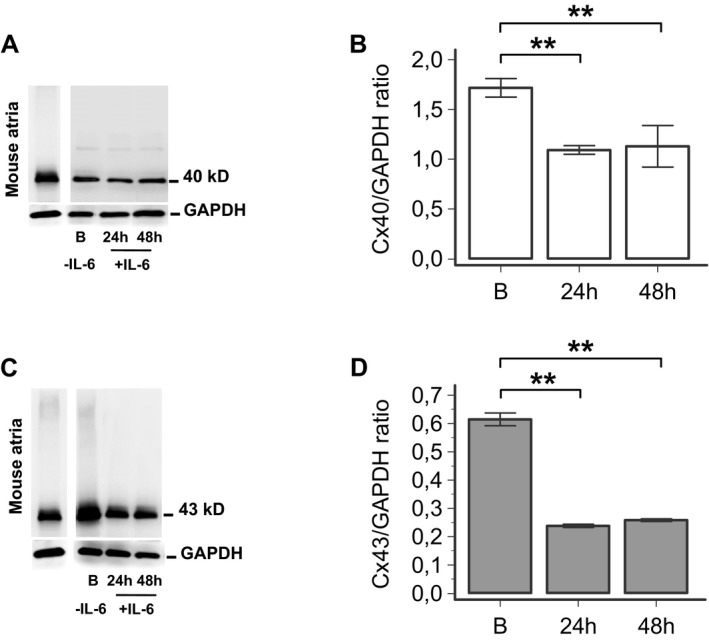
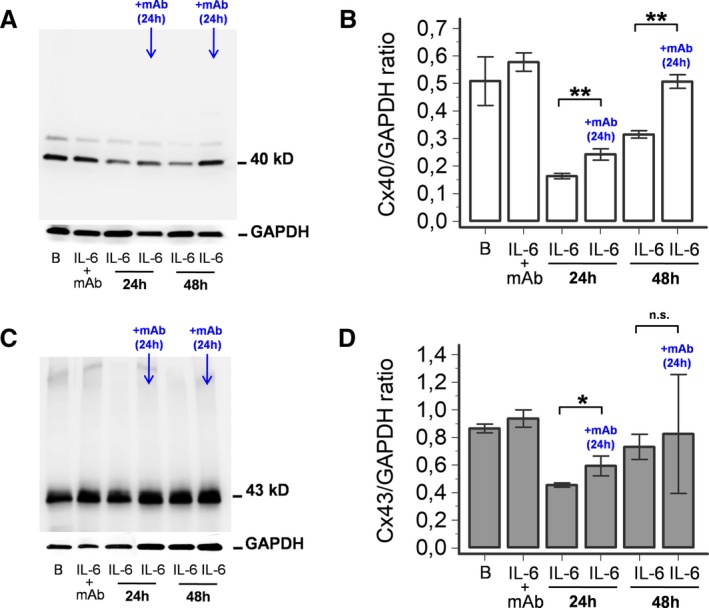
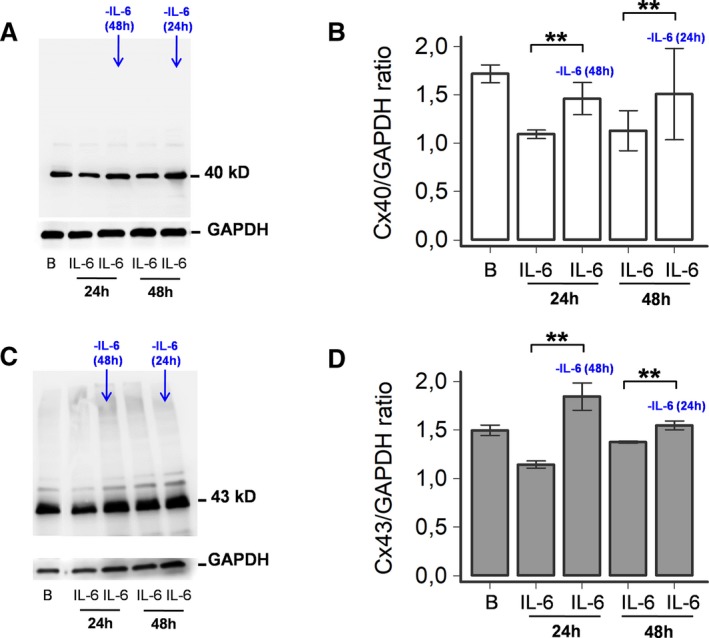
Background Systemic inflammation is a strong predictor of atrial fibrillation. A key role for electrical remodeling is increasingly recognized, and experimental data suggest that inflammatory cytokines can directly affect connexins resulting in gap-junction dysfunction. We hypothesized that systemic inflammation, regardless of its origin, promotes atrial electric remodeling in vivo, as a result of cytokine-mediated changes in connexin expression. Methods and Results Fifty-four patients with different inflammatory diseases and elevated C-reactive protein were prospectively enrolled, and electrocardiographic P-wave dispersion indices, cytokine levels (interleukin-6, tumor necrosis factor-α, interleukin-1, interleukin-10), and connexin expression (connexin 40, connexin 43) were measured during active disease and after reducing C-reactive protein by >75%. Moreover, peripheral blood mononuclear cells and atrial tissue specimens from an additional sample of 12 patients undergoing cardiac surgery were evaluated for atrial and circulating mRNA levels of connexins. Finally, in vitro effects of interleukin-6 on connexin expression were studied in HL-1 mouse atrial myocytes. In patients with active inflammatory diseases, P-wave dispersion indices were increased but rapidly decreased within days when C-reactive protein normalizes and interleukin-6 levels decline. In inflammatory disease patients, both P-wave dispersion indices and interleukin-6 changes were inversely associated with circulating connexin levels, and a positive correlation between connexin expression in peripheral blood mononuclear cells and atrial tissue was demonstrated. Moreover, interleukin-6 significantly reduced connexin expression in HL-1 cells. Conclusions Our data suggest that regardless of specific etiology and organ localization, systemic inflammation, via interleukin-6 elevation, rapidly induces atrial electrical remodeling by down-regulating cardiac connexins. Although transient, these changes may significantly increase the risk for atrial fibrillation and related complications during active inflammatory processes.

Keywords: P‐wave indices; atrial electrical remodeling; atrial fibrillation; connexins; interleukin‐6; systemic inflammation.


Figures

Figure 1
Figure 1
Changes in P‐wave indices in patients with inflammatory diseases, during active disease (PRE) and after therapeutic interventions resulting in a CRP decrease >75% when compared with the baseline (POST). A, Maximum P‐wave duration (Pmax); 2‐tailed Wilcoxon matched‐pairs test, **P<0.01. B, Minimum P‐wave duration (Pmin); 2‐tailed Wilcoxon matched‐pairs test, *P<0.05. C, P‐wave dispersion (PWD); 2‐tail Wilcoxon matched‐pairs test, ***P<0.0001. D, P‐wave standard deviation (Psd); 2‐tailed Student paired t test, ***P<0.0001. Patients, n=54.
Figure 2
Figure 2
Correlation between P‐wave indices and C‐reactive protein (CRP) in patients with inflammatory diseases. A, Relationship between P‐wave standard deviation (Psd) and CRP levels. B, Relationship between P‐wave dispersion (PWD) and CRP levels. C, Relationship between maximum P‐wave (Pmax) and CRP levels throughout the time. Spearman test. Patients, n=54.
Figure 3
Figure 3
Changes in cytokines in patients with inflammatory diseases, during active disease (PRE) and after therapeutic interventions resulting in a CRP decrease >75% when compared with the baseline (POST), and controls (C). A through D, Interleukin‐6, interleukin‐1, tumor necrosis factor‐α (TNF), and interleukin‐10 levels during active disease (PRE), and after therapeutic interventions resulting in a CRP decrease >75% when compared with the baseline (POST), and controls (C). Two‐tailed Wilcoxon matched‐pairs test (ns, not significant, *P<0.05, ***P<0.0001.) or 2‐tailed Mann–Whitney test (ns, not significant, P<0.05, ††† P<0.001). Patients, n=41; controls (C) n=25. Horizontal dotted line indicates the upper limit values in a reference healthy population, that is, 1.25 pg/mL (interleukin‐6), 0.29 pg/mL (interleukin‐1), 3.24 pg/mL (TNF‐α), and 3.6 pg/mL (interleukin‐10).
Figure 4
Figure 4
Relationship between interleukin‐6 and P‐wave indices in patients with inflammatory diseases. A through C, Relationship between P‐wave standard deviation (Psd), maximum P‐wave (Pmax), or P‐wave dispersion (PWD) and interleukin‐6 levels throughout the time. Spearman test. Patients, n=41.
Figure 5
Figure 5
Correlation between atrial and circulating levels of connexins in patients undergoing cardiac surgery. A, Relationship between connexin 40 mRNA levels in atrial tissue and peripheral blood mononuclear cells (PBMCs). B, Relationship between connexin 43 mRNA levels in atrial tissue and PBMCs. Spearman test. Patients, n=12.
Figure 6
Figure 6
Comparison of circulating levels of connexins in patients with inflammatory diseases, during active disease (PRE) and after therapeutic interventions resulting in a C‐reactive protein decrease >75% when compared with the baseline (POST), and controls (C). A, Connexin 40. B, Connexin 43. C, Total connexins. Two‐tailed Wilcoxon matched‐pairs test (n.s., not significant) or Mann‐Whitney test (n.s., not significant, *P<0.05). Error bars indicate 95% CI for mean. Patients, n=16; controls (C) n=25. D, Relationship between circulating interleukin‐6 and connexin 43 mRNA levels in peripheral blood mononuclear cells of patients with inflammatory diseases. Spearman test. Patients, n=16.
Figure 7
Figure 7
Comparison of PRE‐POST changes in circulating connexins levels in inflammatory diseases patients with marked vs low P‐wave dispersion indices decrease respect to baseline. A, Circulating connexin 40 mRNA levels in PRE and POST conditions in patients with marked vs low P‐wave dispersion indices decrease (High‐ΔP vs Low‐ΔP). B, Circulating connexin 43 mRNA levels in PRE and POST conditions in High‐ΔP vs Low‐ΔP patients. C, Total circulating mRNA levels of connexins in PRE and POST conditions in High‐ΔP vs Low‐ΔP patients. Two‐tailed unpaired t test (n.s., not significant, *P≤0.05) or Wilcoxon matched‐pairs test (n.s., not significant, P≤0.05). High‐ΔP patients, n=6; Low‐ΔP patients, n=10.
Figure 8
Figure 8
Correlation between P‐wave indices, circulating connexins and interleukin‐6 levels in patients with inflammatory disease showing marked P‐wave dispersion indices decrease with respect to baseline. A, Relationship between P‐wave standard deviation (Psd) and circulating mRNA levels of total connexins in peripheral blood mononuclear cells (PBMCs) throughout the time. B, Relationship between P‐wave standard deviation (Psd) and connexin 43 mRNA levels in PBMCs throughout the time. C and D, Relationship between interleukin‐6 levels and circulating mRNA levels of connexins (total connexins, connexin 43) throughout the time. Spearman test. Patients, n=6.
Figure 9
Figure 9
Effects of interleukin‐6 on connexin 40 and connexin 43 protein expression in HL‐1 cells. A, Western blot for connexin 40 at baseline (B, ie, without interleukin‐6), and after 24 and 48 hours of treatment with 100 pg/ml interleukin‐6 and (B) the corresponding histograms showing band intensities; (C) Western blot for connexin 43 at baseline (B, ie, without interleukin‐6), and after 24 and 48 hours of treatment with 100 pg interleukin‐6 and (D) the corresponding histograms showing band intensities. Western blots were performed on technical positive control (mouse atria, A and C). Two‐tailed Student paired t test, **P≤0.01. Histograms represents mean±standard deviation of 3 different experiments. GAPDH indicates glyceraldehyde 3‐phosphate dehydrogenase.
Figure 10
Figure 10
Effects of interleukin‐6 inhibition on connexin 40 and connexin 43 protein expression in HL‐1 cells. A, Western blot for connexin 40 at baseline (B, ie, cells cultured for 24 hours without intervention); after the addition of interleukin‐6 plus anti–interleukin‐6 monoclonal antibody (interleukin‐6+mAb, added at 0 hours and collected at 24 hours); after the addition of interleukin‐6 for 24 hours (interleukin‐6 added at 0 hours and collected at 24 hours); after addition of interleukin‐6 for 24 hours and then anti–interleukin‐6 monoclonal antibody for 24 hours (interleukin‐6 added at 0 hours; at 24 hours interleukin‐6 was removed and then added the interleukin‐6+mAb complex; collected at 48 hours); after the addition of interleukin‐6 for 48 hours (interleukin‐6 added at 0 hours and collected at 48 hours); after the addition of interleukin‐6 for 48 hours and then anti–interleukin‐6 monoclonal antibody for 24 hours (interleukin‐6 added at 0 hours; at 48 hours interleukin‐6 removed and then added the interleukin‐6+mAb complex; collected at 72 hours), and (B) the corresponding histograms showing band intensities; (C) Western blot for connexin 43 at baseline (B, ie, cells cultured for 24 hours without intervention); after addition of interleukin‐6 plus anti–interleukin‐6 monoclonal antibody (interleukin‐6+mAb, added at 0 hours and collected at 24 hours); after the addition of interleukin‐6 for 24 hours (interleukin‐6 added at 0 hours and collected at 24 hours); after the addition of interleukin‐6 for 24 hours and then anti–IL‐6 monoclonal antibody for 24 hours (interleukin‐6 added at 0 hours; at 24 hours interleukin‐6 removed and then added the interleukin‐6+mAb complex; collected at 48 hours); after the addition of interleukin‐6 for 48 hours (interleukin‐6 added at 0 hours and collected at 48 hours); after addition of interleukin‐6 for 48 hours and then anti–interleukin‐6 monoclonal antibody for 24 hours (interleukin‐6 added at 0 hours; at 48 hours interleukin‐6 removed and then added the interleukin‐6+mAb complex; collected at 72 hours), and (D) the corresponding histograms showing band intensities. Two‐tailed Student paired t test, *P<0.05, **P<0.01; n.s., not significant. Histograms represents mean±standard deviation of 3 different experiments. GAPDH indicates glyceraldehyde 3‐phosphate dehydrogenase.
Figure 11
Figure 11
Effects of withdrawal of interleukin‐6 supplementation on connexin 40 and connexin 43 protein expression in HL‐1 cells. A, Western blot for connexin 40 at baseline (B, ie, cells cultured for 24 hours without intervention); after the addition of interleukin‐6 for 24 hours (interleukin‐6 added at 0 hours and collected at 24 hours); after the addition of interleukin‐6 for 24 hours and then interleukin‐6 withdrawal for 48 hours (interleukin‐6 added at 0 hours; at 24 hours interleukin‐6 removed; collected at 72 hours); after the addition of interleukin‐6 for 48 hours (interleukin‐6 added at 0 hours and collected at 48 hours); after the addition of interleukin‐6 for 48 hours and then interleukin‐6 withdrawal for 24 hours (interleukin‐6 added at 0 hours; at 48 hours interleukin‐6 removed; collected at 72 hours), and (B) the corresponding histograms showing band intensities; (C) Western blot for connexin 43 at baseline (B, ie, cells cultured for 24 hours without intervention); after addition of interleukin‐6 for 24 hours (interleukin‐6 added at 0 hours and collected at 24 hours); after addition of interleukin‐6 for 24 hours and then interleukin‐6 withdrawal for 48 hours (interleukin‐6 added at 0 hours; at 24 hours interleukin‐6 removed; collected at 72 hours); after the addition of interleukin‐6 for 48 hours (interleukin‐6 added at 0 hours and collected at 48 hours); after the addition of interleukin‐6 for 48 hours and then interleukin‐6 withdrawal for 24 hours (interleukin‐6 added at 0 hours; at 48 hours interleukin‐6 removed; collected at 72 hours), and (D) the corresponding histograms showing band intensities. Two‐tailed Student paired t test, **P<0.01. Histograms represents mean±standard deviation of 3 different experiments. GAPDH indicates glyceraldehyde 3‐phosphate dehydrogenase.

Comment in

References

    1. Chugh SS, Havmoeller R, Narayanan K, Singh D, Rienstra M, Benjamin EJ, Gillum RF, Kim YH, McAnulty JH, Zheng ZJ, Forouzanfar MH, Naghavi M, Mensah GA, Ezzati M, Murray CJ. Worldwide epidemiology of atrial fibrillation: a Global Burden of Disease 2010 Study. Circulation. 2014;837–847. - PMC - PubMed
    1. Dobrev D, Nattel S. New antiarrhythmic drugs for treatment of atrial fibrillation. Lancet. 2010;1212–1223. - PubMed
    1. Kato T, Iwasaki YK, Nattel S. Connexins and atrial fibrillation: filling in the gaps. Circulation. 2012;203–206. - PubMed
    1. Hu YF, Chen YJ, Lin YJ, Chen SA. Inflammation and the pathogenesis of atrial fibrillation. Nat Rev Cardiol. 2015;230–243. - PubMed
    1. Severs NJ, Bruce AF, Dupont E, Rothery S. Remodelling of gap junctions and connexin expression in diseased myocardium. Cardiovasc Res. 2008;9–19. - PMC - PubMed

Publication types

MeSH terms