Molecular pathways of senescence regulate placental structure and function
- PMID: 31424120
- PMCID: PMC6745498
- DOI: 10.15252/embj.2018100849
Molecular pathways of senescence regulate placental structure and function
Erratum in
-
Molecular pathways of senescence regulate placental structure and function.EMBO J. 2020 Aug 3;39(15):e105972. doi: 10.15252/embj.2020105972. EMBO J. 2020. PMID: 32743876 Free PMC article.
Abstract
The placenta is an autonomous organ that maintains fetal growth and development. Its multinucleated syncytiotrophoblast layer, providing fetal nourishment during gestation, exhibits characteristics of cellular senescence. We show that in human placentas from pregnancies with intrauterine growth restriction, these characteristics are decreased. To elucidate the functions of pathways regulating senescence in syncytiotrophoblast, we used dynamic contrast-enhanced MRI in mice with attenuated senescence programs. This approach revealed an altered dynamics in placentas of p53-/- , Cdkn2a-/- , and Cdkn2a-/- ;p53-/- mice, accompanied by histopathological changes in placental labyrinths. Human primary syncytiotrophoblast upregulated senescence markers and molecular pathways associated with cell-cycle inhibition and senescence-associated secretory phenotype. The pathways and components of the secretory phenotype were compromised in mouse placentas with attenuated senescence and in human placentas from pregnancies with intrauterine growth restriction. We propose that molecular mediators of senescence regulate placental structure and function, through both cell-autonomous and non-autonomous mechanisms.
Keywords: gelatinase; intrauterine growth restriction; placenta; senescence; syncytiotrophoblast.
©2019 The Authors. Published under the terms of the CC BY 4.0 license.
Conflict of interest statement
The authors declare that they have no conflict of interest.
Figures

- A, B
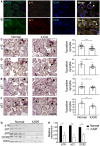
Human placental syncytiotrophoblast cells express markers of cellular senescence regulators, p16 and p21. Sections of normal human post‐partum, third trimester, placenta were evaluated by immunofluorescence co‐staining for senescence regulators (A) p16 and (B) p21. Green label: the syncytiotrophoblast marker βHCG, red label: p16 or p21, and blue label: DAPI nuclear stain. Arrowheads indicate positively stained syncytiotrophoblast cells βHCG+/p16+ (A) and βHCG+/p21+ (B). Scale bar, 50 μm.
- C–F
Sections of human normal third‐trimester placentas post‐partum (n = 4 normal placentas) and IUGR‐complicated placentas of the same gestational age (n = 4 IUGR placentas) were stained for senescence‐related markers of p15 (C), p16 (D), p21 (E), and p53 (F) in the syncytiotrophoblast (n = 3 sections, derived from each normal and IUGR placenta). Percentages of positively stained syncytia were quantified (n = at least 12 fields of view from all sections). Scale bar, 100 μm. Arrowheads indicate syncytiotrophoblast cells.
- G
Immunoblot analysis of the protein content of p16, p21, p53, and DCR in normal (n = 4 placentas) and in IUGR‐complicated placentas (n = 4 placentas). Each lane represents one independent placenta.
- H
Quantitative RT–PCR analysis of p16, p21, and DCR2 expression in IUGR‐complicated and in normal placentas. Results were obtained from four human normal and four IUGR placentas.

- A
Representative T1‐weighted image of a pregnant WT mouse and a selection of four different placentas (outlined by colored lines).
- B
Representative SI dynamics of a single WT placenta (marked in A), following biotin‐BSA‐GdDTPA administered for 60 min. SI parameters of initial enhancement and recovery are illustrated.
- C
Representative SI dynamics of a single WT placenta (marked in A) over time. Scale bar, 2.5 mm.
- D–G
Representative SI plots of Cdkn1a −/− (D), p53 −/− (E), Cdkn2a −/− (F), and Cdkn2a −/− ;p53 −/− (G) placentas, compared with their WT or HET littermates.
- H, I
Quantification of the SI initial enhancement (H) and SI recovery (I) in WT, Cdkn1a −/− , p53 −/− , Cdkn2a −/− , and Cdkn2a −/− ;p53 −/− placentas. MRI experiments were repeated at least three times for each murine genotype (n ≥ 3 placental SI measurements from each genotype). Values are means + SEM; statistical significance was determined by unpaired two‐tailed Student's t‐test *P < 0.05; **P < 0.01; ***P < 0.001.

- A–E
The labyrinth zone of the WT (A) differs from those of Cdkn2a −/− (B) and Cdkn2a −/− ;p53 −/− (C) placentas. Black arrows indicate regular‐sized nuclei in the WT placenta and polyploidy in the Cdkn2a −/− and Cdkn2a −/− ;p53 −/− placentas. Blue arrows indicate normal vasculature in the WT placenta and collapsed vasculature in the Cdkn2a −/− and Cdkn2a −/− ;p53 −/− placentas. Labyrinths of p53 −/− (D) and Cdkn1a −/− (E) placentas did not differ from that of the WT placenta. L, labyrinth. Staining for each placenta was performed in triplicates.
- F, G
Ki67 immunostaining in the labyrinth zones of murine WT, p53 −/−, Cdkn2a −/−, and Cdkn2a −/− ;p53 −/− placentas, on day E14.5 (n = 3 placentas from each genotype). (F) Representative images of Ki67 staining in the labyrinth zone are shown. Positive Ki67 trophoblast cells are indicated with arrows. L, labyrinth. (G) Proliferation scores (n = 3 scores, derived from three placentas of each genotype) based on Ki67 staining show enhanced Ki67 expression in the placental labyrinths of Cdkn2a −/− and Cdkn2a −/− ;p53 −/− placentas relative to WT. Values are means + SEM of three scores for each genotype. *P < 0.05 by a one‐tailed unpaired Student's t‐test.
- H
Representative images of SA‐β‐gal staining in the labyrinth zones of WT, Cdkn2a −/−, and Cdkn2a −/− ;p53 −/− placentas on day E14.5.
- I
SA‐β‐gal activity, quantified by ImageJ software in Cdkn2a −/− and Cdkn2a −/− ;p53 −/− labyrinths, is significantly reduced relative to those in WT labyrinth (n ≥ 7 fields of view from each genotype). Values are means + SEM. ***P < 0.001 by a two‐tailed unpaired Student's t‐test.

- A, B
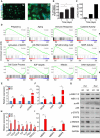
Cell fusion was monitored by staining for phalloidin (F‐actin) (green) and DAPI (blue), on days 1 and 5 after seeding. Scale bar, 50 μm. (B) Trophoblast cell fusion was quantified on days 1, 3, and 5 post‐seeding. Values are means + SEM, derived independently from human placentas of three pregnancies.
- C
Quantification of the human βhCG hormone, normally secreted by functional syncytiotrophoblast cells, in the medium of a representative trophoblast culture on post‐delivery days 2, 3, and 5.
- D
Gene set enrichment analysis (GSEA) of published datasets from human primary trophoblast cultures on days 5 and 2 (n = 4 trophoblast culture of day 5 and day 2). Gene sets related to pregnancy, aging, immune response, cytokine activity, MAPK, JAK‐STAT, NF‐κB, and metalloproteinase activity were found to be enriched in day 5 cultures, whereas on the same day gene sets related to cell cycle, E2F targets, mitosis, and DNA replication were downregulated. Statistical significance was determined by permutation testing with normalized enrichment score (NES).
- E, F
Quantitative RT–PCR analysis of expression of the cell‐cycle‐related genes p16, p21, and CCNE1 (E) and of the syncytiotrophoblast markers GCM1, CGA, and CGB (F).
- G
Immunoblot analysis of the indicated proteins in human trophoblast cells, derived independently from two placentas, on days 2 and 5.
- H, I
Quantitative RT–PCR analysis of expression of the SASP components CCL2, CCL5, CCL8, IL6, IL1β, TGF‐β, and PDG‐FC (H), and of the metalloproteases MMP2, MMP3, and MMP9 (I), in human primary trophoblast cultures on days 5 and 2.

- A
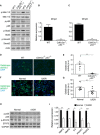
Immunoblot analysis of the indicated proteins in WT and Cdkn2a −/− ;p53 −/− placentas, on day E14.5 (two independent placentas out of four from each genotype are shown).
- B, C
RT–PCR analysis of expression of Mmp2 and Mmp9 in murine Cdkn2a −/− ;p53 −/− and in WT placentas on day E14.5 (n ≥ 4 fields of view for each genotype). Values are means + SEM of at least three experimental repeats.
- D, E
Representative images (D) and quantification (E) of in situ gelatin zymography of the labyrinth zone of murine WT and Cdkn2a −/− ;p53 −/− placentas on day E14.5. Scale bar, 50 μm.
- F, G
Representative images (F) and quantification (G) of in situ zymography of human normal third‐trimester post‐partum placentas and placentas from IUGR‐complicated pregnancies of the same gestational age (n ≥ 9 fields of view of normal and IUGR placentas). Scale bar, 100 μm.
- H
Immunoblot analysis of the protein content of p‐p65, p65, p‐STAT3, and STAT3 in normal placentas (n = 4) and placentas from IUGR‐complicated pregnancies (n = 4). Each lane represents one independent placenta.
- I
Quantitative RT–PCR analysis of expression of MMP2, MMP9, IL6, and the JAK‐STAT targets IFNAR1 and IFNAR2, in normal placentas and placentas from IUGR‐complicated pregnancies. Results are from four human normal placentas and four placentas from IUGR‐complicated pregnancies.
References
-
- Acosta JC, O'Loghlen A, Banito A, Guijarro MV, Augert A, Raguz S, Fumagalli M, Da Costa M, Brown C, Popov N et al (2008) Chemokine signaling via the CXCR2 receptor reinforces senescence. Cell 133: 1006–1018 - PubMed
-
- Alexander CM, Hansell EJ, Behrendtsen O, Flannery ML, Kishnani NS, Hawkes SP, Werb Z (1996) Expression and function of matrix metalloproteinases and their inhibitors at the maternal‐embryonic boundary during mouse embryo implantation. Development 122: 1723–1736 - PubMed
-
- Anacker J, Segerer SE, Hagemann C, Feix S, Kapp M, Bausch R, Kammerer U (2011) Human decidua and invasive trophoblasts are rich sources of nearly all human matrix metalloproteinases. Mol Hum Reprod 17: 637–652 - PubMed
Publication types
MeSH terms
Substances
Associated data
- Actions
Grants and funding
- EC | H2020 | H2020 Priority Excellent Science | H2020 European Research Council (ERC)/International
- HHS | NIH | Office of Extramural Research, National Institutes of Health (OER)/International
- 1R01HD086323-01/NH/NIH HHS/United States
- 634-15/Israel Science Foundation (ISF)/International
- 232640-IMAGO/Seventh Framework European Research Council Advanced Grant/International
LinkOut - more resources
Full Text Sources
Molecular Biology Databases
Research Materials
Miscellaneous

