

Use of Hospital Referral Regions in Evaluating End-of-Life Care
- PMID: 31424316
- PMCID: PMC6931913
- DOI: 10.1089/jpm.2019.0056
Use of Hospital Referral Regions in Evaluating End-of-Life Care
Abstract
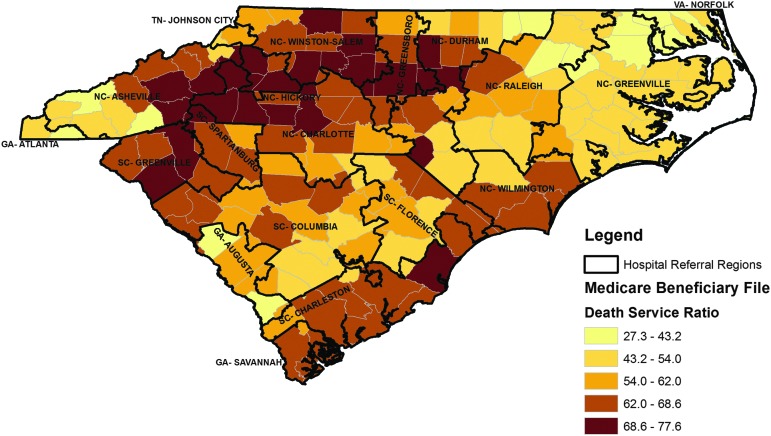
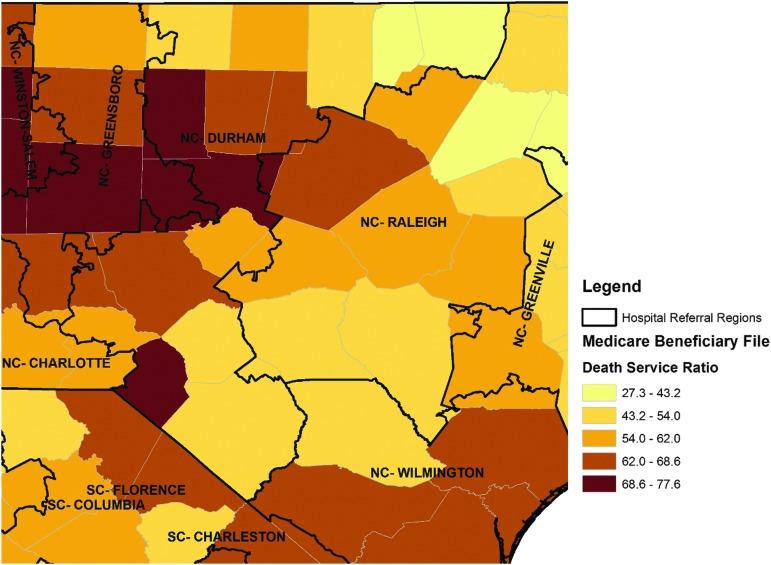
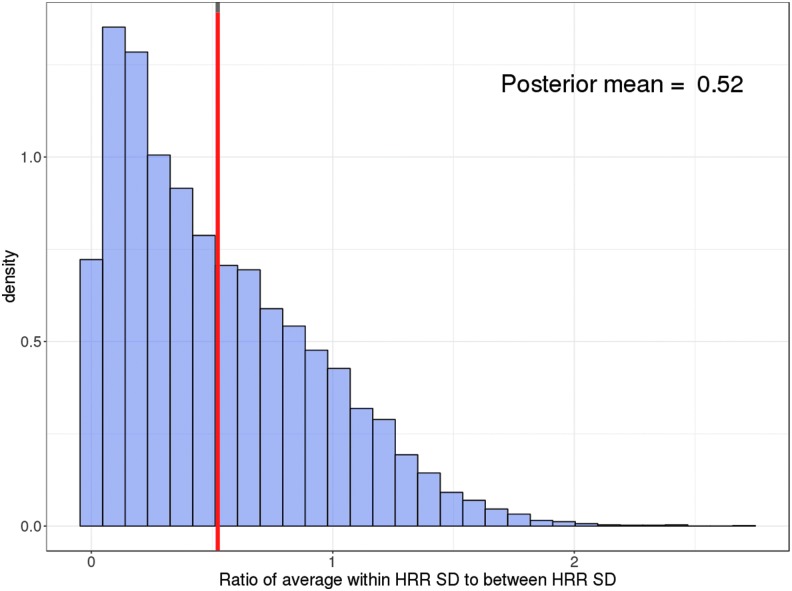
Background: Hospital referral regions (HRRs) are often used to characterize inpatient referral patterns, but it is unknown how well these geographic regions are aligned with variation in Medicare-financed hospice care, which is largely provided at home. Objective: Our objective was to characterize the variability in hospice use rates among elderly Medicare decedents by HRR and county. Methods: Using 2014 Master Beneficiary File for decedents 65 and older from North and South Carolina, we applied Bayesian mixed models to quantify variation in hospice use rates explained by HRR fixed effects, county random effects, and residual error among Medicare decedents. Results: We found HRRs and county indicators are significant predictors of hospice use in NC and SC; however, the relative variation within HRRs and associated residual variation is substantial. On average, HRR fixed effects explained more variation in hospice use rates than county indicators with a standard deviation (SD) of 10.0 versus 5.1 percentage points. The SD of the residual error is 5.7 percentage points. On average, variation within HRRs is about half the variation between regions (52%). Conclusions: The magnitude of unexplained residual variation in hospice use for NC and SC suggests that novel, end-of-life-specific service areas should be developed and tested to better capture geographic differences and inform research, health systems, and policy.
Keywords: Bayesian statistics; Medicare; health care cost; hospice; practice variation.
Conflict of interest statement
The authors have no conflicts of interest to disclose.
Figures
References
-
- Medicare Payment Advisory Commission: March 2017 report to the Congress: Medicare payment policy. In: Chapter 12: Hospice Services, Vol. 2017 Washington, DC: Medicare Payment Advisory Commission, 2017;317–339
-
- Hogan C, Lunney J, Gabel J, Lynn J: Medicare beneficiaries' costs of care in the last year of life. Health Aff (Millwood) 2001;20:188–195 - PubMed
-
- Shreyansh S, Moradiya Y, Murth S: Utilization of in-hospital palliative care for ischemic stroke deaths in United States (S45.005). Neurology 2014;82
-
- Braun LT, Grady KL, Kutner JS, et al. : Palliative care and cardiovascular disease and stroke: A policy statement from the American Heart Association/American Stroke Association. Circulation 2016;11:e198–e225 - PubMed
Publication types
MeSH terms
Grants and funding
LinkOut - more resources
Full Text Sources
