. 2020 Jan;89(1):186-206.
doi: 10.1111/1365-2656.13094. Epub 2019 Oct 1.

Optimizing the use of biologgers for movement ecology research

Affiliations

Optimizing the use of biologgers for movement ecology research

Hannah J Williams et al. J Anim Ecol. 2020 Jan.

Abstract

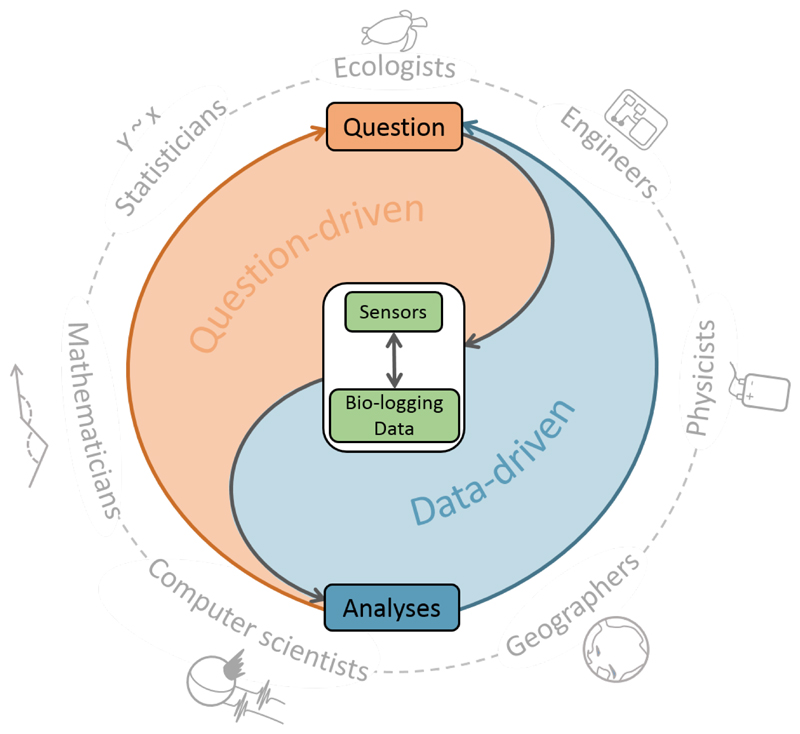
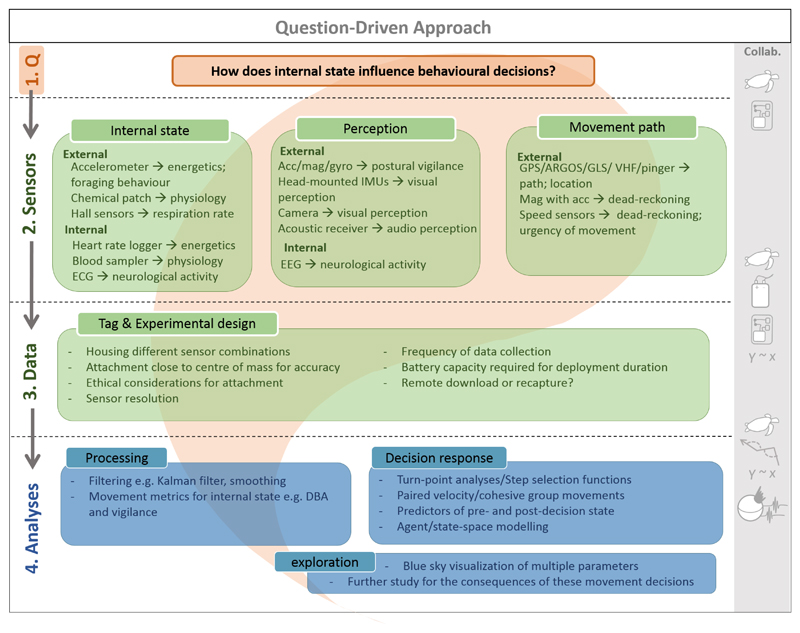
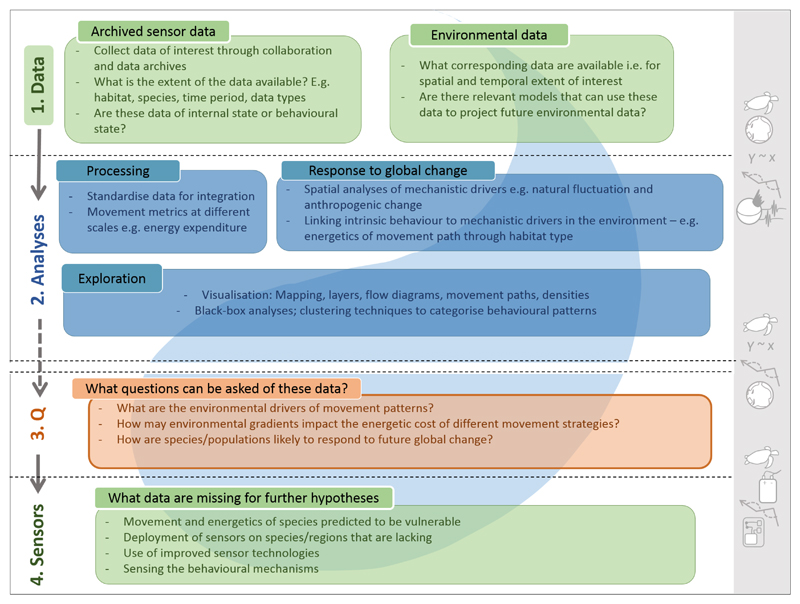
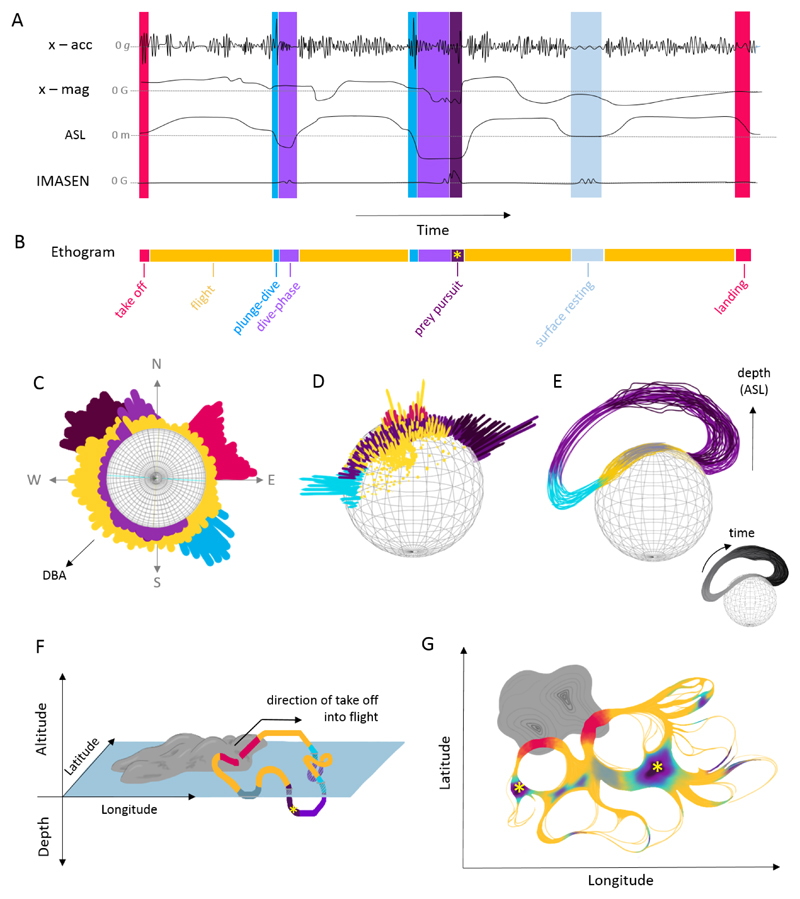
The paradigm-changing opportunities of biologging sensors for ecological research, especially movement ecology, are vast, but the crucial questions of how best to match the most appropriate sensors and sensor combinations to specific biological questions and how to analyse complex biologging data, are mostly ignored. Here, we fill this gap by reviewing how to optimize the use of biologging techniques to answer questions in movement ecology and synthesize this into an Integrated Biologging Framework (IBF). We highlight that multisensor approaches are a new frontier in biologging, while identifying current limitations and avenues for future development in sensor technology. We focus on the importance of efficient data exploration, and more advanced multidimensional visualization methods, combined with appropriate archiving and sharing approaches, to tackle the big data issues presented by biologging. We also discuss the challenges and opportunities in matching the peculiarities of specific sensor data to the statistical models used, highlighting at the same time the large advances which will be required in the latter to properly analyse biologging data. Taking advantage of the biologging revolution will require a large improvement in the theoretical and mathematical foundations of movement ecology, to include the rich set of high-frequency multivariate data, which greatly expand the fundamentally limited and coarse data that could be collected using location-only technology such as GPS. Equally important will be the establishment of multidisciplinary collaborations to catalyse the opportunities offered by current and future biologging technology. If this is achieved, clear potential exists for developing a vastly improved mechanistic understanding of animal movements and their roles in ecological processes and for building realistic predictive models.

Keywords: GPS; accelerometer; big data; data visualization; integrated biologging framework; movement ecology; multidisciplinary collaboration; multisensor approach.


Conflict of interest statement

The authors declare no conflicts of interest.

Figures

Figure 1
Figure 1. The Integrated Bio-logging Framework (IBF) for optimal use of bio-logging in movement ecology.
Researchers may take a question-driven approach, beginning with a hypothesis, then selecting the appropriate sensor and analysis techniques. Alternatively, a data-driven approach can be taken, by allowing existing data to inform further hypotheses and data collection. The framework operates via collaboration between disciplines in a system of feedback loops, though these collaborative links are not exclusive to any particular node.
Figure 2
Figure 2. A question-driven approach to the IBF for optimal study design using bio-logging.
In this example, ecologists begin with their question of focus (top of Figure 1), in this case an investigation into the effect of internal state on movement decisions, and select the appropriate external and internal sensors for data collection. Here, sensors should be sensitive to different aspects of an animal’s movement that relate to their internal state, perceived information and the movement that may result from a particular decision. Selection of the sensors requires strong collaboration between ecologists and engineers (right-hand symbols). Simultaneously (bottom of Figure 1), ecologists should work with those analysing the data (e.g. physicists, mathematicians, statisticians, computer scientists) in the process of designing the data collection, to ensure the correct data are gathered that can answer the question using the analytic tools available.
Figure 3
Figure 3. A data-driven approach to the IBF for optimal study design using archived bio-logging data.
In this example, ecologists begin by selecting appropriate data types for the study of movement patterns in relation to environmental measures at local and global scales. Understanding and predicting how animals respond to global change, including climate and land-use change, requires multiple data collected over a range of temporal and spatial scales. In this case, ecologists start at the central nodes of the IBF (Figure 1) to collate archived data and collaborate with mathematicians, statisticians and geographers (right-hand symbols) to implement the appropriate processing and analytical techniques to interrogate the data and identify patterns by which several questions may be approached. Following this, ecologists may work with other disciplines to deploy additional bio-logging sensors to collect data that complement the shared data.
Figure 4
Figure 4. Visualisation of sensor and location data.
A number of schematic plots of varying axes and information types to visualise data of a seabird in flight that plunge-dives in pursuit of prey. A) Logged sensor outputs (acceleration (g), magnetometry (µT), altitude above sea level (m) derived from pressure data (kPa) and the inter-mandibular angle sensor IMASEN output (µT)) in a time series plot. Peaks in dynamic acceleration are associated with wing beats during take-off (red) and in flight (yellow), as well on impact with the sea surface in plunge-dives (aqua blue). During the dive, as indicated by the negative altitude above sea level (ASL; purple) the bird may pursue prey (dark purple), as indicated by increased variation in acceleration and heading, from the magnetometer output. A successful prey capture attempt is evident in the peaks in the IMASEN signal output, as the bird opens its bill to capture the prey (yellow asterisk). B) The behaviours are classified and presented in an ethogram to show temporal variation in behaviour (this serves as a key for the schematic). Further to these time series plots, different sensor outputs can be combined, along with derived metrics, in various multi-axes visualisations to reveal patterns in behaviour. We present three examples (C-E) for data visualisation in multi-dimensional space and two for geographic space (F-G): C) a circular plot of heading on an m-sphere (magnetometry; Williams et al., 2017), where height of the bar is the magnitude of the extent of movement (DBA), the most active behaviours for this bird are foraging and diving, which occur at opposite headings; D) a g-sphere (static acceleration data) or Dubai plot, where a frequency histogram of static acceleration is resolved in tri-axial space (Wilson et al., 2016) and peaks show the most common postures for each behaviour; E) a g-sphere where distance from the surface of the sphere is relative to the depth below sea level, where colour indicates different behaviours in the dive, so that through the dive there is a shift in posture, and a greater variation in posture and depth during the prey pursuit (coloured by time in greyscale, bottom right); F) 3D movement path during for the foraging trip; G) 2D flow visualisation of foraging path, where thicker paths are more commonly used for the different behaviours (Verbeek, Buchin, & Speckmann, 2011).

References

    1. Abrahms B, Scales KL, Hazen EL, Bograd SJ, Schick RS, Robinson PW, Costa DP. Mesoscale activity facilitates energy gain in a top predator. Proceedings of the Royal Society B: Biological Sciences. 2018;285 doi: 10.1098/rspb.2018.1101. 20181101. - DOI - PMC - PubMed
    1. Alam M, Rohac J. Adaptive data filtering of inertial sensors with variable bandwidth. Sensors. 2015;15(2):3282–3298. doi: 10.3390/s150203282. - DOI - PMC - PubMed
    1. Andrienko G, Andrienko N, Chen W, Maciejewski R, Zhao Y. Visual analytics of mobility and transportation: State of the art and further research directions. IEEE Transactions on Intelligent Transportation Systems. 2017;18(8):2232–2249. doi: 10.1109/TITS.2017.2683539. - DOI
    1. Avgar T, Potts JR, Lewis MA, Boyce MS. Integrated step selection analysis: Bridging the gap between resource selection and animal movement. Methods in Ecology and Evolution. 2016;7(5):619–630. doi: 10.1111/2041-210X.12528. - DOI
    1. Barron DG, Brawn JD, Weatherhead PJ. Meta-analysis of transmitter effects on avian behaviour and ecology. Methods in Ecology and Evolution. 2010;1(2):180–187. doi: 10.1111/j.2041-210X.2010.00013.x. - DOI

Publication types