

What is the Likelihood of Subsequent Arthroplasties after Primary TKA or THA? Data from the Osteoarthritis Initiative
- PMID: 31425280
- PMCID: PMC7000041
- DOI: 10.1097/CORR.0000000000000925
What is the Likelihood of Subsequent Arthroplasties after Primary TKA or THA? Data from the Osteoarthritis Initiative
Abstract
Background: Osteoarthritis is common and debilitating, in part because it often affects more than one large weightbearing joint. The likelihood of undergoing more than one total joint arthroplasty has not been studied in a heterogeneous, multicenter population in the United States.
Questions/purposes: We used prospectively collected data of patients with osteoarthritis from the multicenter Osteoarthritis Initiative (OAI) project to ask (1) What is the likelihood of a subsequent THA or TKA after primary TKA or THA? (2) What risk factors are associated with undergoing contralateral TKA after primary TKA?
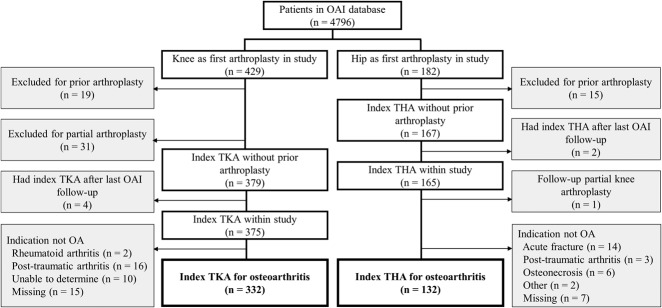
Methods: Longitudinally maintained data from the OAI were used to identify 332 patients who underwent primary TKA and 132 patients who underwent primary THA for osteoarthritis who did not have a previous TKA or THA in this retrospective study. OAI was a longitudinal cohort study of knee osteoarthritis conducted at five centers in the United States (Columbus, OH, USA; Pittsburgh, PA, USA; Baltimore, MD, USA; Pawtucket, RI, USA; and San Francisco, CA, USA). In this study, the mean follow-up time was 4.0 ± 2.3 years, with 24% (112 of 464) followed for less than 2 years. The primary outcome was the cumulative incidence of subsequent arthroplasty calculated using the Kaplan-Meier method. Age, BMI, gender, and contralateral Kellgren-Lawrence grade, medial joint space width, and hip-knee-ankle angles were modeled as risk factors of contralateral TKA using Cox proportional hazards.
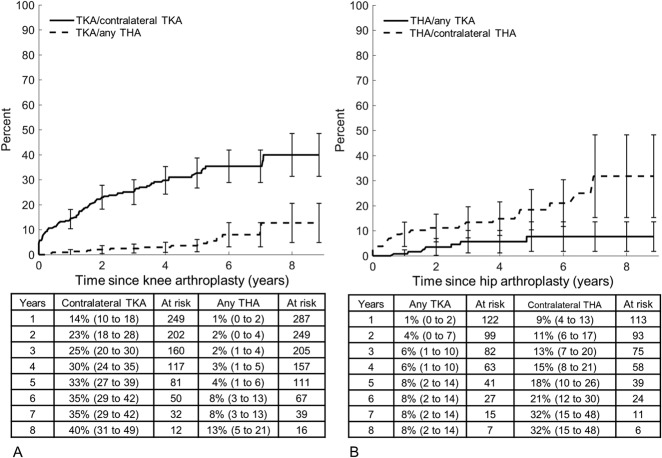
Results: Using the Kaplan-Meier method, at 8 years the cumulative incidence of contralateral TKA after the index TKA was 40% (95% CI 31 to 49) and the cumulative incidence of any THA after index TKA was 13% (95% CI 5 to 21). The cumulative incidence of contralateral THA after the index THA was 8% (95% CI 2 to 14), and the cumulative incidence of any TKA after index THA was 32% (95% CI 15 to 48). Risk factors for undergoing contralateral TKA were younger age (HR 0.95 for each year of increasing age [95% CI 0.92 to 0.98]; p = 0.001) and loss of medial joint space width with a varus deformity (HR 1.26 for each 1 mm loss of joint space width at 1.6 varus [1.06 to 1.51]; p = 0.005).
Conclusion: Patients who underwent TKA or THA for osteoarthritis had a high rate of subsequent joint arthroplasties in this study conducted at multiple centers in the United States. The rate of subsequent joint arthroplasty determined in this study can be used to counsel patients in similar settings and institutions, and may serve as a benchmark to assess future osteoarthritis disease-modifying interventions.
Level of evidence: Level III, therapeutic study.
Conflict of interest statement
Each author certifies that neither he or she, nor any member of his or her immediate family, has funding or commercial associations (consultancies, stock ownership, equity interest, patent/licensing arrangements, etc.) that might pose a conflict of interest in connection with the submitted article.
All ICMJE Conflict of Interest Forms for authors and
Figures

Comment in
-
CORR Insights®: What is the Likelihood of Subsequent Arthroplasties after Primary TKA or THA? Data from the Osteoarthritis Initiative.Clin Orthop Relat Res. 2020 Jan;478(1):42-44. doi: 10.1097/CORR.0000000000000998. Clin Orthop Relat Res. 2020. PMID: 31663887 Free PMC article. No abstract available.
References
-
- Carr AJ, Robertsson O, Graves S, Price AJ, Arden NK, Judge A, Beard DJ. Knee replacement. Lancet . 2012;379:1331–1340. - PubMed
-
- Duryea J, Li J, Peterfy CG, Gordon C, Genant HK. Trainable rule-based algorithm for the measurement of joint space width in digital radiographic images of the knee. Med Phys. 2000;27:580–591. - PubMed
-
- Gillam MH, Lie SA, Salter A, Furnes O, Graves SE, Havelin LI, Ryan P. The progression of end-stage osteoarthritis: analysis of data from the Australian and Norwegian joint replacement registries using a multi-state model. Osteoarthr Cartil . 2013;21:405–412. - PubMed
MeSH terms
LinkOut - more resources
Full Text Sources
Medical
Research Materials
