. 2019 Dec 1;25(23):7098-7112.
doi: 10.1158/1078-0432.CCR-19-1704. Epub 2019 Aug 19.

Circulating Tumor DNA Sequencing Analysis of Gastroesophageal Adenocarcinoma

Affiliations

Circulating Tumor DNA Sequencing Analysis of Gastroesophageal Adenocarcinoma

Steven B Maron et al. Clin Cancer Res. .

Abstract

Purpose: Gastroesophageal adenocarcinoma (GEA) has a poor prognosis and few therapeutic options. Utilizing a 73-gene plasma-based next-generation sequencing (NGS) cell-free circulating tumor DNA (ctDNA-NGS) test, we sought to evaluate the role of ctDNA-NGS in guiding clinical decision-making in GEA.

Experimental design: We evaluated a large cohort (n = 2,140 tests; 1,630 patients) of ctDNA-NGS results (including 369 clinically annotated patients). Patients were assessed for genomic alteration (GA) distribution and correlation with clinicopathologic characteristics and outcomes.

Results: Treatment history, tumor site, and disease burden dictated tumor-DNA shedding and consequent ctDNA-NGS maximum somatic variant allele frequency. Patients with locally advanced disease having detectable ctDNA postoperatively experienced inferior median disease-free survival (P = 0.03). The genomic landscape was similar but not identical to tissue-NGS, reflecting temporospatial molecular heterogeneity, with some targetable GAs identified at higher frequency via ctDNA-NGS compared with previous primary tumor-NGS cohorts. Patients with known microsatellite instability-high (MSI-High) tumors were robustly detected with ctDNA-NGS. Predictive biomarker assessment was optimized by incorporating tissue-NGS and ctDNA-NGS assessment in a complementary manner. HER2 inhibition demonstrated a profound survival benefit in HER2-amplified patients by ctDNA-NGS and/or tissue-NGS (median overall survival, 26.3 vs. 7.4 months; P = 0.002), as did EGFR inhibition in EGFR-amplified patients (median overall survival, 21.1 vs. 14.4 months; P = 0.01).

Conclusions: ctDNA-NGS characterized GEA molecular heterogeneity and rendered important prognostic and predictive information, complementary to tissue-NGS.See related commentary by Frankell and Smyth, p. 6893.


Figures

Figure 1.
Figure 1.. ctDNA detection and number of detected alterations is dictated by specific disease sites and burden of disease.
A) The number of disease sites involved in patients from the Baseline cohort (n=144) directly correlated with maxVAF, suggesting that maxVAF reflected overall disease burden (p=4.9e-8, F=9.8). B) Upon stage IV diagnosis, patients with intact primary tumors (n=101/144) had a generally higher mean maxVAF of 10.9% versus 6.5% for those with prior curative intent primary tumor resection (p=0.09, 95% CI 0.7–9.9). C) In addition to disease burden, specific disease sites were associated with increased tumor shedding and consequently maxVAF – most notably liver and lymph nodes (p=0.01,F=3.1). D) Conversely, patients with solely peritoneal involvement (n=35/144), had a lower mean maxVAF of 2.5% versus 11.9% in patients with additional/other disease sites (p=5.1e-6, 95% CI 5.6=13.6), and many patients with solely peritoneal involvement had no detectable ctDNA.
Figure 2.
Figure 2.. Prognostic implications of maxVAF and serial changes in the perioperative and newly diagnosed metastatic settings
A) Detection of >0.25% maxVAF prior to neoadjuvant therapy was associated with a 15.2 month mDFS (n=17/29), versus not reached mDFS in patients with lower or undetectable maxVAF (p=0.1, HR=0.2, 95% CI 0.03–2.1). B) Patients with maxVAF >0.25% (n=7/22) within 180 post-operative days and before adjuvant therapy, if applicable, had a 12.5 month mDFS versus unreached mDFS in patients with lower or undetectable maxVAF (p=0.03, HR=0.1, 95% CI 0.01–1.1). C) Representative ‘tumor-response map’ of an individual demonstrating detectable pre-therapy ctDNA, with post-operative clearance of ctDNA; in a patient with no evidence of recurrence on follow up examination ~24 months from surgery. D) Representative ‘tumor-response map’ of an individual demonstrating persistent ctDNA post-operatively (maxVAF 2.3%), with recurrence within 6 months of surgery. E) Newly diagnosed metastatic patients (104/144) with below-mean (‘low’) maxVAF (<9.7%) had a mOS of 14.8 versus 9.4 months for above-mean (‘high’) maxVAF (p=0.1, HR 0.7, 95% CI 0.4–1.1). F) Patients with detectable ctDNA upon stage IV diagnosis (maxVAF>0.5%) and upon repeat testing within 150 days demonstrating a decline by ≥50% (n=23/35) demonstrated superior mOS of 13.7 versus 8.6 months (p=0.02, HR 0.3 95% CI 0.1–0.8). G) Representative ‘tumor-response map’ revealing ctDNA decline (“response”) in a patient on first line therapy who remains alive beyond 24 months with stage IV GEA. H) Representative ‘tumor-response map’ demonstrating ctDNA non-responding patient who died of from disease progression ~3 months from diagnosis of stage IV GEA, despite receiving standard therapy. I) Patients who had ctDNA tested within 60 days prior to IO initiation and were found to have a lower than median maxVAF (3.5, n=14/27), had a higher mOS of 7.9 versus 2.5 months for those with above median maxVAF, from the time of IO initiation to death (p=0.04, HR 0.4, 95% CI 0.1–0.96).
Figure 3.
Figure 3.. Relative frequency of common (>5%) non-synonymous ctDNA alterations between Western and Eastern populations and various ctDNA-NGS and tissue-NGS cohorts.
A) Non-synonymous GA frequency by Global versus UChicago versus Samsung ctDNA-NGS cohorts revealed a higher rate of TP53, KRAS, ARID1A, and CDKN2A alterations (including SNVs, copy number alterations, fusions, splice variants, and indels) in the Western (UChicago) than Eastern (Samsung) cohorts. B) Mutation frequencies (SNV+indel+splice variants) by cohort highlight that mutations in KRAS and ARID1A account for the increased alteration frequency differences between the UC and SMC cohorts. C) Oncogene amplification frequency between the UChicago and Samsung cohorts demonstrating higher amplification frequencies in global and UC cohorts than SMC patients, potentially reflecting more proximal CIN patients in Western cases. D) GA frequency between resected GEA primary tumors stages I-III (TCGA), baseline primary tumor stage IV GEA (MSK Impact), and ctDNA (ctDNA-NGS) revealed similar but not identical incidences of GAs using tissue-NGS compared with ctDNA-NGS, a reflection of different tumor stages, treatment time points, tumor sites and biologic compartments.
Figure 4.
Figure 4.. Intra-patient spatial and temporal heterogeneity by multi-site tissue-NGS and ctDNA-NGS
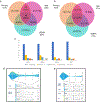
A) Amongst untreated stage IV/recurrent untreated patients who underwent baseline Triplet-paired sequencing (NGS) of primary tumor and metastatic (met) tumor and plasma ctDNA (n=34), only 26% of characterized alterations were identified by all 3 methods. Percentages by site name indicate % of total GAs identified across the 34 patient cohort. B) Limiting GAs to those detectable by ctDNA (n=149/183 GAs in these patients), concordance between all 3 approaches increased to 32%, and ctDNA was able to detect 74% of GAs compared with 54% and 57% by tissue testing of either the primary and metastatic site, respectively. C) Comparison between tissue and ctDNA RTK amplification in HER2, EGFR, FGFR2, and MET in baseline untreated metastatic patients, increased sensitivity for detection was observed when using both tissue-NGS and ctDNA-NGS D) ctDNA-NGS representative ‘tumor-response map’ demonstrating persistent HER2 amplification upon progression on HER2-targeted therapy. E) Tumor-response map highlighting disappearance of HER2 amplification amidst expansion of previous CCNE amplification and TP53 mutation along with de novo NF1 mutation in ctDNA after progression on HER2-targeted therapy.
Figure 5.
Figure 5.. Survival analysis of untreated stage IV GEA patients by specific genomic alteration.
A) Presence of a PIK3CA mutation corresponded with shorter survival of 3.8 versus 13.6 months (p=0.006, HR 3.4, 95% CI 1.6–7.2). B) BRAF alterations corresponded with a mOS 5.6 months versus 13.7 months in BRAF wildtype patients (p=0.02, HR 3.0, 95% CI 1.4–6.7). C) Amongst the 86 patients with both tissue-NGS and ctDNA-NGS available, 24 were either HER2 clinically positive or HER2 amplified by tissue-NGS or ctDNA-NGS at any time during their disease – with 54% universal concordance. D) Amongst all 23 patients considered clinically HER2 positive who underwent ctDNA-NGS at the time of stage IV diagnosis and then received HER2-directed therapy, mOS was 12.7 versus 8.7 months in ctDNA HER2-amplified patients (n=15/23) versus those without ctDNA HER2 amplification (p=0.4, HR 0.6, 95% CI 0.2–1.7). E) Amongst all 23 patients considered clinically HER2 positive, using an adjusted copy number, i.e. copy number/ (maxVAF+0.01), patients with a greater than median HER2 copy number (10/23) demonstrated a mOS of 15.9 versus 9.4 months in those with lower copy number (p=0.07, HR 0.4, 95% CI 0.1–1.1). F) evaluating patients with proven tissue amplification and/or greater than median ctDNA amplification (n=16/23) in complementary fashion, the mOS benefit increased to 26.3 versus 7.4 months (p=0.004, HR 0.2, 95% CI 0.05–0.6). G) EGFR amplification was not prognostic, as the median overall survival of EGFR amplified, non-targeted patients (n=12/130) was similar to that of non-EGFR amplified patients – 14.4 months versus 13.3 months (p=0.6, HR 1.3, 95% CI 0.5–3.0). H) EGFR amplified patients by ctDNA-NGS and/or tissue-NGS in the Baseline cohort who received EGFR inhibitors (n=9/27) in any line had a mOS of 21.1 versus 14.4 months for patients who did not (p=0.01, HR 0.2, 0.06–0.8). I) Adjusted EGFR copy number above median or tissue amplification (n=9/14) demonstrated a 21.1 versus 6.2 month mOS (p=0.001, HR 0.05, 95% CI 0.006–0.4).

Comment in

References

    1. Sehdev A, Catenacci DV. Gastroesophageal cancer: focus on epidemiology, classification, and staging. Discov Med 2013;16(87):103–11. - PubMed
    1. Wagner AD, Syn NL, Moehler M, Grothe W, Yong WP, Tai BC, et al. Chemotherapy for advanced gastric cancer. Cochrane Database Syst Rev 2017;8:CD004064 doi: 10.1002/14651858.CD004064.pub4. - DOI - PMC - PubMed
    1. Bang YJ, Van Cutsem E, Feyereislova A, Chung HC, Shen L, Sawaki A, et al. Trastuzumab in combination with chemotherapy versus chemotherapy alone for treatment of HER2-positive advanced gastric or gastro-oesophageal junction cancer (ToGA): a phase 3, open-label, randomised controlled trial. Lancet 2010;376(9742):687–97 doi 10.1016/S0140-6736(10)61121-X. - DOI - PubMed
    1. Fuchs CS, Tomasek J, Yong CJ, Dumitru F, Passalacqua R, Goswami C, et al. Ramucirumab monotherapy for previously treated advanced gastric or gastro-oesophageal junction adenocarcinoma (REGARD): an international, randomised, multicentre, placebo-controlled, phase 3 trial. Lancet 2014;383(9911):31–9 doi 10.1016/S0140-6736(13)61719-5. - DOI - PubMed
    1. Wilke H, Muro K, Van Cutsem E, Oh SC, Bodoky G, Shimada Y, et al. Ramucirumab plus paclitaxel versus placebo plus paclitaxel in patients with previously treated advanced gastric or gastro-oesophageal junction adenocarcinoma (RAINBOW): a double-blind, randomised phase 3 trial. Lancet Oncol 2014;15(11):1224–35 doi 10.1016/S1470-2045(14)70420-6. - DOI - PubMed

Publication types

MeSH terms