. 2019 Sep 3;116(36):17867-17873.
doi: 10.1073/pnas.1819027116. Epub 2019 Aug 19.

Global change effects on plant communities are magnified by time and the number of global change factors imposed

Kimberly J Komatsu  1 Meghan L Avolio  2 Nathan P Lemoine  3 Forest Isbell  4 Emily Grman  5 Gregory R Houseman  6 Sally E Koerner  7 David S Johnson  8 Kevin R Wilcox  9 Juha M Alatalo  10   11 John P Anderson  12 Rien Aerts  13 Sara G Baer  14 Andrew H Baldwin  15 Jonathan Bates  16 Carl Beierkuhnlein  17 R Travis Belote  18 John Blair  19 Juliette M G Bloor  20 Patrick J Bohlen  21 Edward W Bork  22 Elizabeth H Boughton  23 William D Bowman  24 Andrea J Britton  25 James F Cahill Jr  26 Enrique Chaneton  27 Nona R Chiariello  28 Jimin Cheng  29 Scott L Collins  30 J Hans C Cornelissen  13 Guozhen Du  31 Anu Eskelinen  32   33   34 Jennifer Firn  35 Bryan Foster  36   37 Laura Gough  38 Katherine Gross  39   40 Lauren M Hallett  41   42 Xingguo Han  43 Harry Harmens  44 Mark J Hovenden  45 Annika Jagerbrand  46 Anke Jentsch  47 Christel Kern  48 Kari Klanderud  49 Alan K Knapp  50   51 Juergen Kreyling  52 Wei Li  29 Yiqi Luo  53 Rebecca L McCulley  54 Jennie R McLaren  55 J Patrick Megonigal  56 John W Morgan  57 Vladimir Onipchenko  58 Steven C Pennings  59 Janet S Prevéy  60 Jodi N Price  61 Peter B Reich  62   63 Clare H Robinson  64 F Leland Russell  6 Osvaldo E Sala  65 Eric W Seabloom  4 Melinda D Smith  50   51 Nadejda A Soudzilovskaia  66 Lara Souza  67 Katherine Suding  24 K Blake Suttle  68 Tony Svejcar  69 David Tilman  4 Pedro Tognetti  27 Roy Turkington  70   71 Shannon White  22 Zhuwen Xu  72 Laura Yahdjian  27 Qiang Yu  73 Pengfei Zhang  31   74 Yunhai Zhang  43   75
Affiliations

Global change effects on plant communities are magnified by time and the number of global change factors imposed

Kimberly J Komatsu et al. Proc Natl Acad Sci U S A. .

Abstract

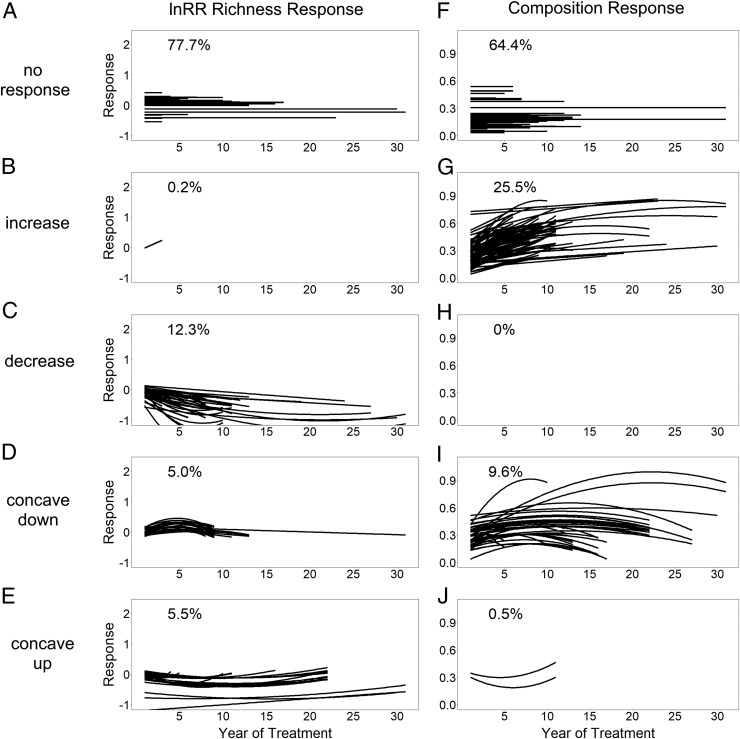
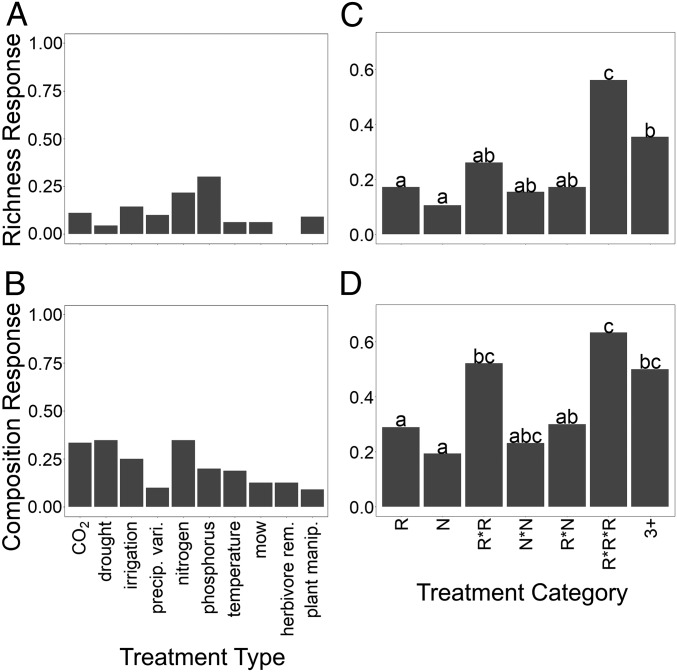
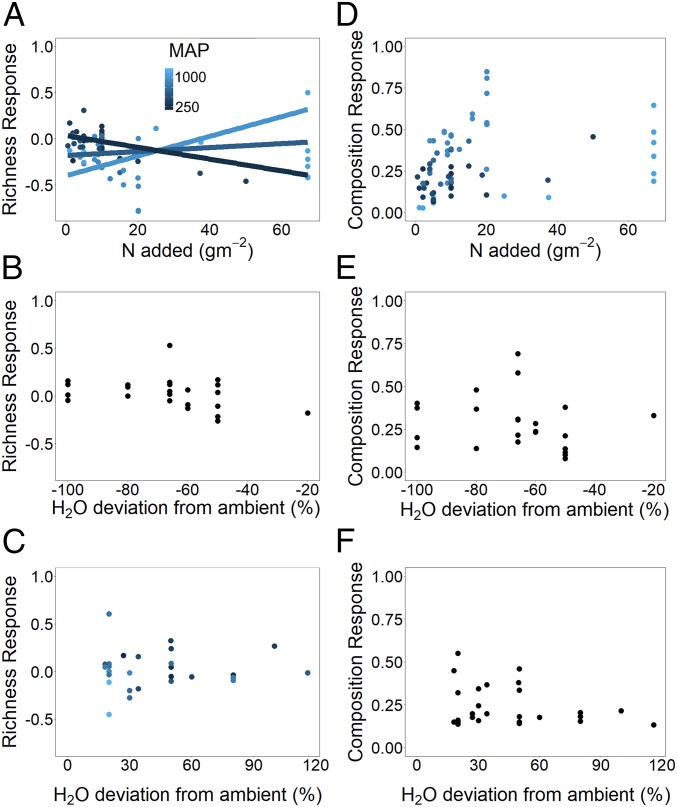
Global change drivers (GCDs) are expected to alter community structure and consequently, the services that ecosystems provide. Yet, few experimental investigations have examined effects of GCDs on plant community structure across multiple ecosystem types, and those that do exist present conflicting patterns. In an unprecedented global synthesis of over 100 experiments that manipulated factors linked to GCDs, we show that herbaceous plant community responses depend on experimental manipulation length and number of factors manipulated. We found that plant communities are fairly resistant to experimentally manipulated GCDs in the short term (<10 y). In contrast, long-term (≥10 y) experiments show increasing community divergence of treatments from control conditions. Surprisingly, these community responses occurred with similar frequency across the GCD types manipulated in our database. However, community responses were more common when 3 or more GCDs were simultaneously manipulated, suggesting the emergence of additive or synergistic effects of multiple drivers, particularly over long time periods. In half of the cases, GCD manipulations caused a difference in community composition without a corresponding species richness difference, indicating that species reordering or replacement is an important mechanism of community responses to GCDs and should be given greater consideration when examining consequences of GCDs for the biodiversity-ecosystem function relationship. Human activities are currently driving unparalleled global changes worldwide. Our analyses provide the most comprehensive evidence to date that these human activities may have widespread impacts on plant community composition globally, which will increase in frequency over time and be greater in areas where communities face multiple GCDs simultaneously.

Keywords: community composition; global change experiments; herbaceous plants; species richness.


Conflict of interest statement

The authors declare no conflict of interest.

Figures

Fig. 1.
Fig. 1.
Experimental global change manipulations drive temporal differences in plant community composition. Richness responses (AE) are measured as the lnRR of richness between treatment and control plots within a year; positive values indicate net species gains in treatment plots relative to control plots, while negative values indicate net species losses. lnRR richness response has a lower bound of −1 and no upper bound. Composition responses (FJ) are measured as the Euclidean distance between centroids of control and treatment plots within a year in a principle coordinates analysis based on a Bray–Curtis dissimilarity matrix; composition response is bounded by 0 and 1. Responses are grouped among 5 possible shapes indicated along the left sides of the panels. For all panels, lines correspond to models for 438 individual global change treatments responses across 105 experiments. For all lines, slopes and intercepts are plotted as 0 when 95% credible intervals of parameters include 0. Percentages are percentages of studies exhibiting a particular response shape across all experiments (i.e., not considering experiment length). Percentage responses for short-term vs. long-term experiments can be found in Table 2.
Fig. 2.
Fig. 2.
Across all datasets, the proportions of significant temporal plant community responses (lnRR richness and composition differences) to global change treatments do not vary by the type of single-factor global change manipulation imposed (A and B, respectively), but do vary by the number of treatments simultaneously imposed (C and D, respectively). Single-factor global change manipulations are categorized into treatment types (CO2 = increased atmospheric CO2; drought = reduced precipitation; irrigation = increased precipitation; precip. vari. = variation in precipitation timing but not amount; nitrogen = nitrogen additions; phosphorus = phosphorous additions; temperature = increased temperature; mow = mowing aboveground biomass; herbivore rem. = removal of above- and/or belowground herbivores; plant manip. = 1-time manipulation of plant through seed additions or diversity treatments at the start of the experiment). Treatment categories group treatments by the number and type of manipulations imposed (R = single resource; N = single nonresource; R × R = 2-way interactions with both treatments manipulating resources; N × N = 2-way interactions with both treatments manipulating nonresources; R × N = 2-way interactions with 1 resource and 1 nonresource manipulation; R × R × R = 3 or more way interactions with all treatments manipulating resources; 3+ = ≥3-way interactions with both resource and nonresource manipulations). Significant differences in the proportion of significant richness and composition responses among treatment categories are indicated by letters as determined by Fisher’s exact test for all pairwise combinations. a indicates significant differences in the proportion of richness or composition responses compared to results marked by b or c at P < 0.05 as determined by Fisher’s exact test. b indicates significant differences in the proportion of richness or composition responses compared to results marked by a or c at P < 0.05 as determined by Fisher’s exact test. c indicates significant differences in the proportion of richness or composition responses compared to results marked by a or b at P < 0.05 as determined by Fisher’s exact test.
Fig. 3.
Fig. 3.
Differences in (AC) richness and (DF) plant composition to the magnitude of (A and D) N addition treatments, (B and E) drought manipulation treatments, and (C and F) irrigation manipulation experiments. Points represent treatment responses for each experiment at each site in the final year of treatment, and lines indicate Bayesian regressions between treatment magnitude and richness or composition responses where significant. Points are colored by site-level MAP where the independent effect of MAP was significant, and lines are colored by MAP where the interactive effect between MAP and treatment magnitude was significant.

References

    1. Cardinale B. J., et al. , The functional role of producer diversity in ecosystems. Am. J. Bot. 98, 572–592 (2011). - PubMed
    1. Smith M. D., Knapp A. K., Collins S. L., A framework for assessing ecosystem dynamics in response to chronic resource alterations induced by global change. Ecology 90, 3279–3289 (2009). - PubMed
    1. Franklin J., Serra-Diaz J. M., Syphard A. D., Regan H. M., Global change and terrestrial plant community dynamics. Proc. Natl. Acad. Sci. U.S.A. 113, 3725–3734 (2016). - PMC - PubMed
    1. Chalcraft D. R., et al. , Scale-dependent responses of plant biodiversity to nitrogen enrichment. Ecology 89, 2165–2171 (2008). - PubMed
    1. Dornelas M., et al. , Assemblage time series reveal biodiversity change but not systematic loss. Science 344, 296–299 (2014). - PubMed

Publication types

LinkOut - more resources